This comprehensive guide compares CTC (Creditcoin) and UNI (Uniswap), two distinct blockchain protocols serving different cryptocurrency sectors. CTC operates as a global credit network platform facilitating cross-chain lending markets, while UNI functions as a leading decentralized exchange protocol utilizing automated market maker technology. The analysis examines historical price performance, revealing CTC's current trading at $0.2785 and UNI at $5.314 as of January 2026, alongside their tokenomics, institutional adoption patterns, and technological ecosystems. Through detailed price forecasts extending to 2031, investment strategy comparisons for diverse investor profiles, and risk assessments across market, technical, and regulatory dimensions, this article addresses investors' critical question: which asset offers superior investment value. The guide provides actionable insights through comparative analysis of both short-term and long-term investment considerations, available through Gate's real-time ma
Introduction: Investment Comparison Between CTC and UNI
In the cryptocurrency market, the comparison between CTC and UNI has consistently been a topic of interest for investors. The two differ significantly in market cap ranking, application scenarios, and price performance, representing distinct crypto asset positions.
Creditcoin (CTC): Launched in 2020, it has gained market recognition as a global credit network platform, aiming to connect blockchain assets through protocols to create an inter-blockchain lending market.
Uniswap (UNI): Since its launch in 2020, it has been recognized as the first automated market maker (AMM) protocol built on the Ethereum blockchain, becoming one of the leading decentralized exchange protocols in the crypto ecosystem.
This article will comprehensively analyze the investment value comparison between CTC and UNI through historical price trends, supply mechanisms, institutional adoption, technological ecosystems, and future predictions, attempting to answer investors' most pressing question:
"Which is the better buy right now?"
I. Historical Price Comparison and Current Market Status
Historical Price Trends of CTC (Coin A) and UNI (Coin B)
- 2021: CTC reached its all-time high of $8.67 on March 14, 2021, during the broader cryptocurrency market rally.
- 2021: UNI achieved its peak price of $44.92 on May 3, 2021, driven by the expansion of decentralized finance (DeFi) adoption and increased trading activity on the Uniswap platform.
- 2023: CTC recorded its all-time low of $0.128298 on October 19, 2023, amid challenging market conditions.
- 2020: UNI established its all-time low of $1.03 on September 17, 2020, shortly after its launch.
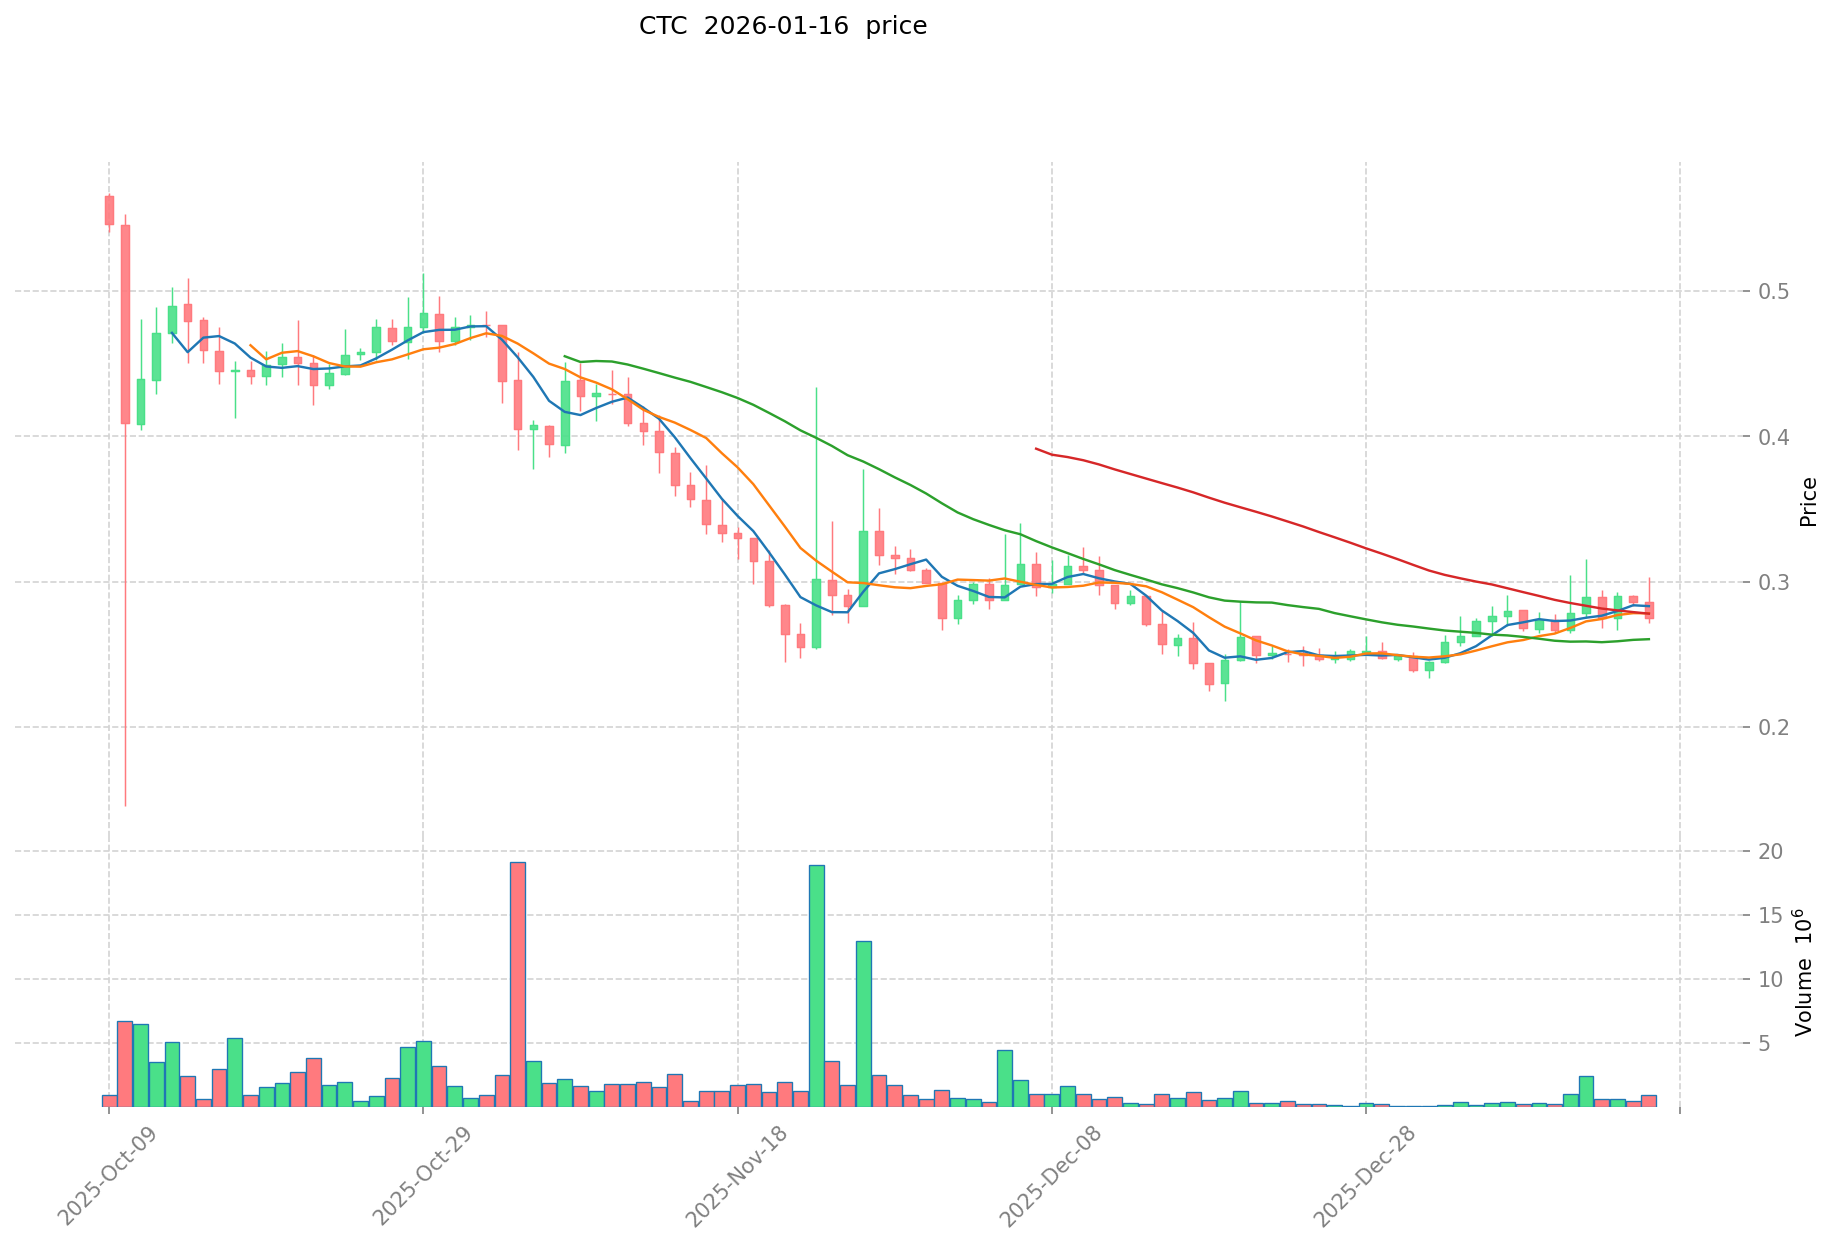
- Comparative Analysis: Over the past year, CTC has declined by 75.44%, falling from higher levels to its current range. During the same period, UNI has experienced a decline of 63.44%, showing relatively similar downward pressure across both assets in the challenging market environment.
Current Market Status (January 16, 2026)
- CTC Current Price: $0.2785
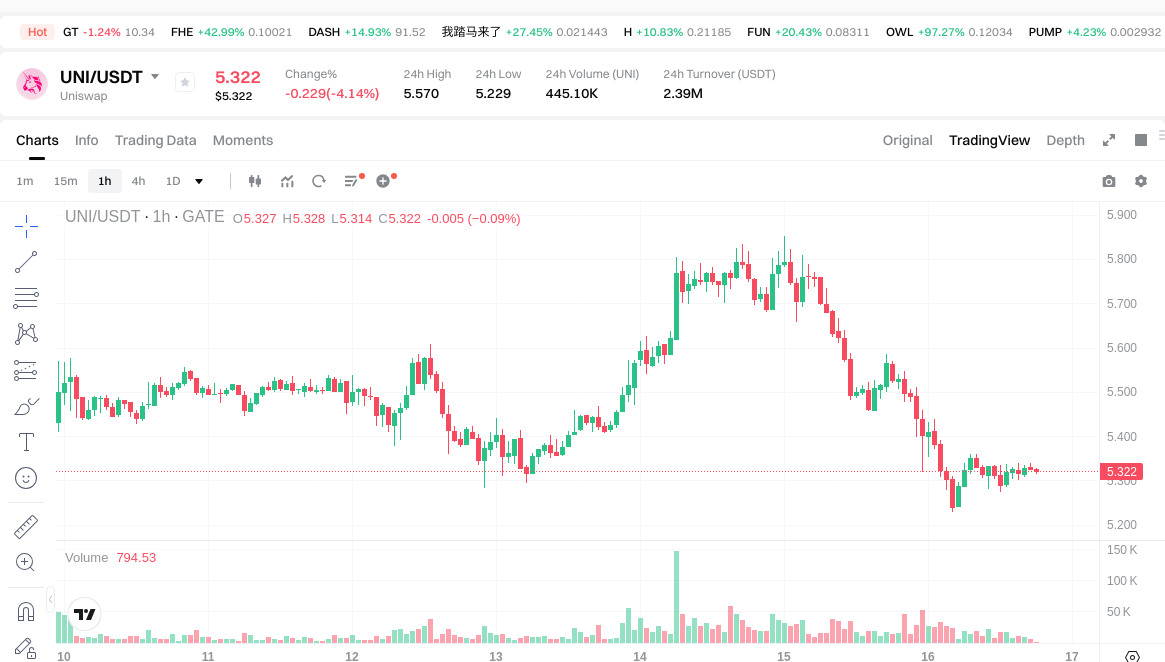
- UNI Current Price: $5.314
- 24-hour Trading Volume: CTC recorded $162,041.93, while UNI demonstrated significantly higher liquidity with $2,411,802.13
- Market Sentiment Index (Fear & Greed Index): 49 (Neutral)
Check real-time prices:
II. Core Factors Influencing CTC vs UNI Investment Value
Supply Mechanism Comparison (Tokenomics)
- CTC: Market liquidity and trading volume are key determinants of supply dynamics, with valuation influenced by investor sentiment and overall market conditions.
- UNI: Supply mechanisms are shaped by technological innovation and market adoption patterns, with regulatory environment playing a significant role in tokenomics evolution.
- 📌 Historical Pattern: Supply mechanisms interact with market cycles, where liquidity conditions and adoption rates contribute to price movement patterns over time.
Institutional Adoption and Market Application
- Institutional Holdings: Both assets require evaluation of institutional participation through careful analysis of market trends and economic factors.
- Enterprise Adoption: Market application potential depends on technological innovation trajectory, regulatory clarity, and integration within existing financial infrastructure.
- Policy Environment: Regulatory frameworks across different jurisdictions influence institutional engagement levels and market accessibility for both assets.
Technological Development and Ecosystem Building
- CTC Technical Evolution: Value proposition evolves with market liquidity improvements and trading infrastructure development.
- UNI Technical Development: Technological innovation drives ecosystem expansion, with market adoption serving as a key indicator of development progress.
- Ecosystem Comparison: Both assets operate within broader market conditions that influence their respective ecosystem growth trajectories and application scenarios.
Macroeconomic Factors and Market Cycles
- Economic Environment Performance: Investment value assessment requires understanding of how market liquidity, trading volume, and investor sentiment respond to varying economic conditions.
- Monetary Policy Impact: Overall market conditions are influenced by macroeconomic factors, which in turn affect valuation dynamics for both assets.
- Market Sentiment Factors: Investor sentiment shifts in response to economic indicators, regulatory developments, and technological progress, creating cyclical patterns that require careful monitoring and analysis.
III. 2026-2031 Price Forecast: CTC vs UNI
Short-term Forecast (2026)
- CTC: Conservative $0.167-$0.279 | Optimistic $0.279-$0.326
- UNI: Conservative $3.19-$5.32 | Optimistic $5.32-$6.12
Medium-term Forecast (2028-2029)
- CTC may enter a gradual growth phase, with projected price range of $0.182-$0.554
- UNI may enter a consolidation phase, with projected price range of $5.01-$10.02
- Key drivers: institutional capital inflows, ETF developments, ecosystem expansion
Long-term Forecast (2030-2031)
- CTC: Baseline scenario $0.364-$0.485 | Optimistic scenario $0.585-$0.865
- UNI: Baseline scenario $5.68-$8.86 | Optimistic scenario $10.72-$14.80
View detailed price predictions for CTC and UNI
Disclaimer: Price predictions are based on historical data analysis and market trends. Actual prices may vary significantly due to market volatility, regulatory changes, technological developments, and other unforeseen factors. This information should not be considered as investment advice.
CTC:
| Year |
Predicted High Price |
Predicted Average Price |
Predicted Low Price |
Price Change |
| 2026 |
0.326079 |
0.2787 |
0.16722 |
0 |
| 2027 |
0.371939085 |
0.3023895 |
0.28424613 |
8 |
| 2028 |
0.495631509975 |
0.3371642925 |
0.18206871795 |
21 |
| 2029 |
0.553809208645875 |
0.4163979012375 |
0.25816669876725 |
49 |
| 2030 |
0.683996012467779 |
0.485103554941687 |
0.363827666206265 |
74 |
| 2031 |
0.865133679883005 |
0.584549783704733 |
0.409184848593313 |
109 |
UNI:
| Year |
Predicted High Price |
Predicted Average Price |
Predicted Low Price |
Price Change |
| 2026 |
6.11685 |
5.319 |
3.1914 |
0 |
| 2027 |
8.29099125 |
5.717925 |
2.91614175 |
7 |
| 2028 |
8.40534975 |
7.004458125 |
5.7436556625 |
31 |
| 2029 |
10.01637511875 |
7.7049039375 |
5.008187559375 |
44 |
| 2030 |
12.5821081299375 |
8.860639528125 |
7.17711801778125 |
66 |
| 2031 |
14.795495884063125 |
10.72137382903125 |
5.682328129386562 |
101 |
IV. Investment Strategy Comparison: CTC vs UNI
Long-term vs Short-term Investment Strategies
- CTC: May align with investors focused on credit infrastructure development and emerging market adoption patterns, with consideration for market liquidity dynamics and trading infrastructure evolution.
- UNI: May appeal to investors interested in decentralized exchange protocol development and DeFi ecosystem expansion, with attention to technological innovation and market adoption trajectories.
Risk Management and Asset Allocation
- Conservative Investors: Portfolio consideration might involve evaluating market conditions, with potential allocation influenced by risk tolerance, liquidity requirements, and market cycle positioning.
- Aggressive Investors: Investment approach may emphasize growth potential assessment, with allocation decisions reflecting market sentiment analysis, technological development monitoring, and ecosystem expansion evaluation.
- Hedging Tools: Risk management frameworks may incorporate stablecoin positions, derivative instruments where available, and diversified portfolio construction across multiple asset categories.
V. Potential Risk Comparison
Market Risk
- CTC: Market risk factors include liquidity conditions, trading volume fluctuations, and sensitivity to broader market sentiment shifts, with price movements influenced by overall cryptocurrency market cycles.
- UNI: Market risk considerations encompass DeFi sector performance, competitive dynamics within decentralized exchange protocols, and correlation with Ethereum ecosystem developments.
Technical Risk
- CTC: Technical considerations involve infrastructure scalability requirements, network stability maintenance, and integration challenges within credit market frameworks.
- UNI: Technical risk factors include protocol upgrade complexity, smart contract security considerations, and decentralized exchange mechanism evolution.
Regulatory Risk
- Global regulatory frameworks present distinct implications for both assets, with credit-focused platforms and decentralized exchange protocols facing different compliance considerations across various jurisdictions. Regulatory clarity development, licensing requirements, and cross-border operational parameters remain important factors influencing market accessibility and institutional participation levels.
VI. Conclusion: Which Is the Better Buy?
📌 Investment Value Summary:
- CTC Characteristics: Market positioning within credit infrastructure development, with value proposition linked to blockchain-based lending market evolution and cross-chain protocol integration potential.
- UNI Characteristics: Established presence within decentralized exchange protocol sector, with ecosystem strength derived from AMM innovation and DeFi infrastructure contribution.
✅ Investment Considerations:
- Novice Investors: Investment approach should prioritize understanding of fundamental differences between credit infrastructure platforms and decentralized exchange protocols, with careful evaluation of risk tolerance, market cycle positioning, and portfolio diversification principles.
- Experienced Investors: Strategy development may involve comparative analysis of technological roadmaps, ecosystem adoption metrics, and market positioning dynamics, alongside consideration of macroeconomic factors and regulatory environment evolution.
- Institutional Investors: Decision framework should encompass comprehensive due diligence across multiple dimensions including liquidity assessment, regulatory compliance evaluation, technological infrastructure review, and alignment with broader investment mandates and risk management protocols.
⚠️ Risk Disclosure: Cryptocurrency markets exhibit substantial volatility and uncertainty. This analysis does not constitute investment advice, financial guidance, or recommendations for specific investment actions. Investment decisions should be made based on individual circumstances, risk tolerance, and comprehensive research.
VII. FAQ
Q1: What are the main differences between CTC and UNI in terms of their core functions?
CTC (Creditcoin) functions as a global credit network platform focused on blockchain-based lending markets and cross-chain protocol integration, while UNI (Uniswap) operates as a decentralized exchange protocol utilizing automated market maker (AMM) technology. CTC aims to connect blockchain assets through protocols to create inter-blockchain lending infrastructure, positioning itself within the credit market sector. UNI, launched as the first AMM protocol on Ethereum, serves as a decentralized trading platform enabling token swaps without traditional order books, establishing its role within the DeFi exchange ecosystem. The fundamental distinction lies in their use cases: CTC addresses credit and lending infrastructure, whereas UNI facilitates decentralized token exchange mechanisms.
Q2: How do the historical price performances of CTC and UNI compare?
CTC reached its all-time high of $8.67 on March 14, 2021, and its all-time low of $0.128298 on October 19, 2023, while UNI achieved its peak of $44.92 on May 3, 2021, and its lowest point of $1.03 on September 17, 2020. Over the past year, CTC has declined by 75.44% compared to UNI's 63.44% decline, indicating both assets have experienced significant downward pressure. As of January 16, 2026, CTC trades at $0.2785 with a 24-hour trading volume of $162,041.93, while UNI trades at $5.314 with substantially higher liquidity of $2,411,802.13 in 24-hour volume. UNI demonstrates greater market liquidity and maintained a relatively higher price point throughout its trading history compared to CTC.
Q3: What are the price predictions for CTC and UNI through 2031?
For 2026, CTC's conservative forecast ranges from $0.167-$0.279, with optimistic projections of $0.279-$0.326, while UNI's conservative range is $3.19-$5.32, with optimistic estimates of $5.32-$6.12. By 2031, CTC's baseline scenario projects $0.364-$0.485 (optimistic: $0.585-$0.865), representing approximately 109% growth from 2026 levels, whereas UNI's baseline forecast suggests $5.68-$8.86 (optimistic: $10.72-$14.80), indicating approximately 101% growth. These predictions are based on historical data analysis and market trends, considering factors such as institutional capital inflows, ETF developments, and ecosystem expansion. However, actual prices may vary significantly due to market volatility, regulatory changes, technological developments, and unforeseen factors.
Q4: Which investment strategy is more suitable for different types of investors?
Conservative investors might evaluate both assets based on market conditions, risk tolerance, liquidity requirements, and market cycle positioning, with portfolio allocation decisions reflecting careful consideration of volatility patterns and fundamental analysis. Aggressive investors may emphasize growth potential assessment, focusing on market sentiment analysis, technological development monitoring, and ecosystem expansion evaluation when determining allocation between CTC and UNI. Experienced investors should conduct comparative analysis of technological roadmaps, ecosystem adoption metrics, and market positioning dynamics, alongside macroeconomic factors and regulatory environment evolution. Institutional investors require comprehensive due diligence encompassing liquidity assessment, regulatory compliance evaluation, technological infrastructure review, and alignment with broader investment mandates and risk management protocols.
Q5: What are the primary risks associated with investing in CTC versus UNI?
CTC's market risks include liquidity conditions, trading volume fluctuations, and sensitivity to broader market sentiment shifts, with technical considerations involving infrastructure scalability and integration challenges within credit market frameworks. UNI faces market risks encompassing DeFi sector performance, competitive dynamics within decentralized exchange protocols, and correlation with Ethereum ecosystem developments, alongside technical risks including protocol upgrade complexity and smart contract security considerations. Both assets face regulatory risks as global frameworks present distinct implications for credit-focused platforms and decentralized exchange protocols, with regulatory clarity development, licensing requirements, and cross-border operational parameters remaining important factors. Cryptocurrency markets exhibit substantial volatility, and investment decisions should be made based on individual circumstances and comprehensive research.
Q6: How do institutional adoption patterns differ between CTC and UNI?
Both assets require evaluation of institutional participation through careful analysis of market trends and economic factors, though they operate within different sectors of the cryptocurrency ecosystem. UNI benefits from established presence within the decentralized exchange protocol sector and contribution to DeFi infrastructure, potentially attracting institutional interest focused on decentralized trading mechanisms. CTC's market positioning within credit infrastructure development may appeal to institutions interested in blockchain-based lending market evolution and cross-chain protocol integration. Enterprise adoption potential for both depends on technological innovation trajectory, regulatory clarity, and integration within existing financial infrastructure. Policy environments across different jurisdictions influence institutional engagement levels and market accessibility differently for credit platforms versus decentralized exchange protocols.
Q7: What role do macroeconomic factors play in the investment comparison between CTC and UNI?
Investment value assessment for both CTC and UNI requires understanding how market liquidity, trading volume, and investor sentiment respond to varying economic conditions. Overall market conditions are influenced by macroeconomic factors including monetary policy decisions, which affect valuation dynamics for both assets, though potentially with different degrees of impact given their distinct market sectors. Investor sentiment shifts in response to economic indicators, regulatory developments, and technological progress, creating cyclical patterns that influence both credit infrastructure platforms and decentralized exchange protocols. Key drivers for medium to long-term performance include institutional capital inflows, ETF developments, and ecosystem expansion, all of which are interconnected with broader macroeconomic trends and market cycle positioning.
Q8: What factors should be considered when determining portfolio allocation between CTC and UNI?
Portfolio allocation decisions should consider the fundamental differences between credit infrastructure platforms and decentralized exchange protocols, evaluating risk tolerance, market cycle positioning, and diversification principles. Market liquidity analysis reveals UNI's significantly higher 24-hour trading volume ($2,411,802.13) compared to CTC ($162,041.93), which impacts position entry and exit capabilities. Technological roadmap assessment, ecosystem adoption metrics, and market positioning dynamics provide insight into long-term growth potential for each asset. Risk management frameworks may incorporate stablecoin positions, derivative instruments where available, and diversified portfolio construction across multiple asset categories. The neutral market sentiment index (49) suggests balanced consideration of both growth opportunities and risk factors when determining allocation percentages.
* The information is not intended to be and does not constitute financial advice or any other recommendation of any sort offered or endorsed by Gate.