This comprehensive analysis compares ENA and AAVE tokens to determine which offers superior yield farming opportunities in 2024-2031. ENA, launched in 2024, positions itself as an Ethereum-based synthetic dollar protocol with emerging stablecoin infrastructure and Layer-2 network development, while AAVE maintains its leadership as an established decentralized lending protocol since 2020 with $31.92 billion TVL. The article examines critical investment factors including historical price trends, tokenomics with different unlock schedules, institutional adoption levels, technical ecosystem development, and macroeconomic sensitivities. Current pricing shows ENA at $0.2284 versus AAVE at $175.02, with significantly different risk profiles and revenue generation models. Long-term forecasts through 2031 project ENA reaching $0.39-$0.60 and AAVE reaching $222-$319, catering to distinct investor risk tolerances and DeFi strategy preferences through detailed portfolio allocation recommendations.
Introduction: Investment Comparison Between ENA and AAVE
In the cryptocurrency market, the comparison between ENA vs AAVE has consistently been a topic investors cannot avoid. Both show significant differences in market cap rankings, application scenarios, and price performance, representing distinct positioning within the crypto asset landscape.
ENA (Ethena): Launched in 2024, it has gained market recognition through its positioning as an Ethereum-based synthetic dollar protocol offering a crypto-native solution for money and a globally accessible dollar-denominated savings instrument.
AAVE: Since its launch in 2020, it has been recognized as a leading decentralized lending protocol, providing open-source deposit and lending services with algorithmic interest rate determination.
This article will comprehensively analyze the investment value comparison between ENA vs AAVE, focusing on historical price trends, supply mechanisms, institutional adoption, technical ecosystems, and future predictions, attempting to answer the question investors care about most:
"Which is the better buy right now?"
I. Historical Price Comparison and Current Market Status
ENA and AAVE Historical Price Trends
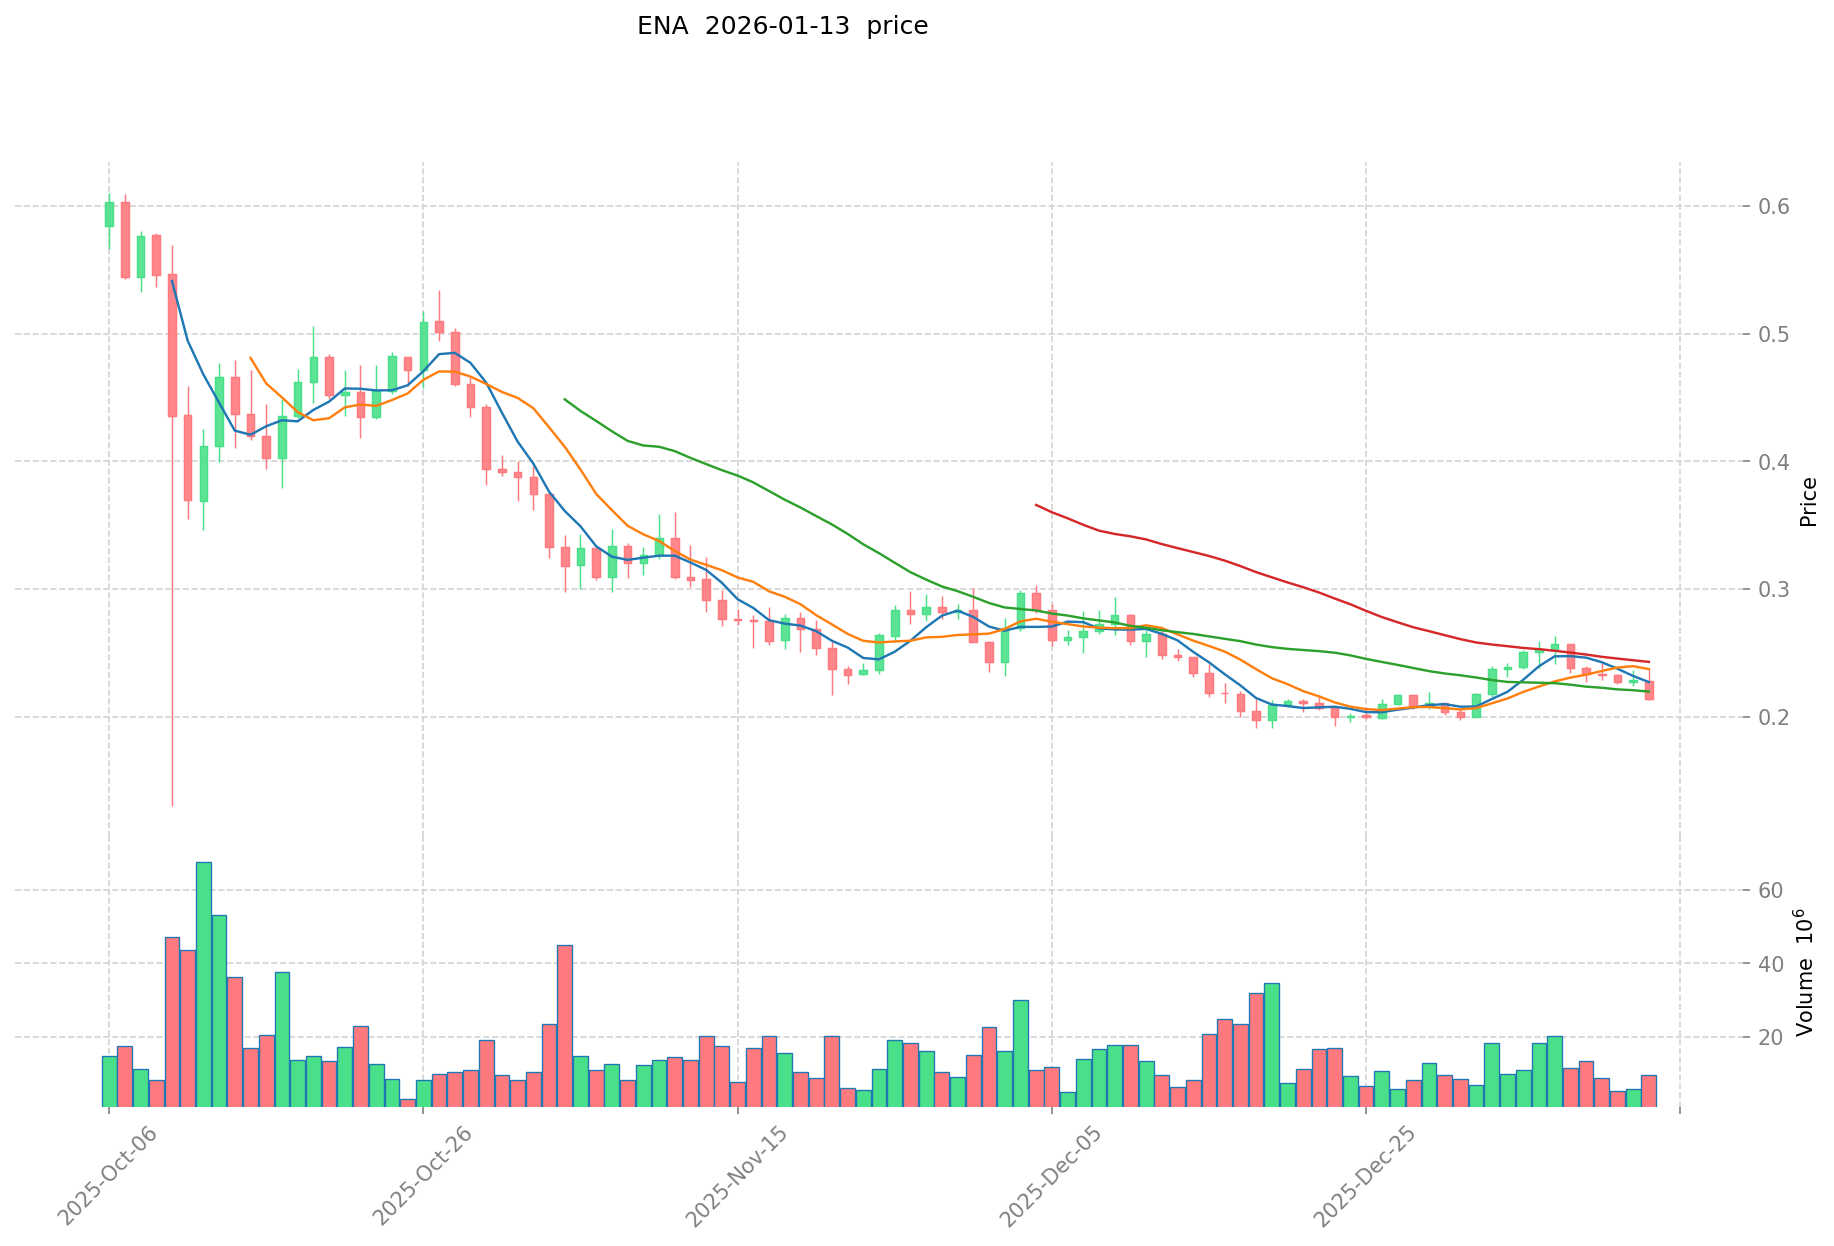
- 2024: ENA reached a peak price of $1.5208 on April 11, 2024. Following this milestone, the token experienced significant downward pressure throughout the year.
- 2025: ENA recorded its lowest price point of $0.1299 on October 10, 2025, reflecting substantial volatility during this period.
- 2020: AAVE converted from its predecessor token LEND at a 100:1 ratio on October 3, 2020 (block height 10978863), marking a key transformation in the protocol's evolution.
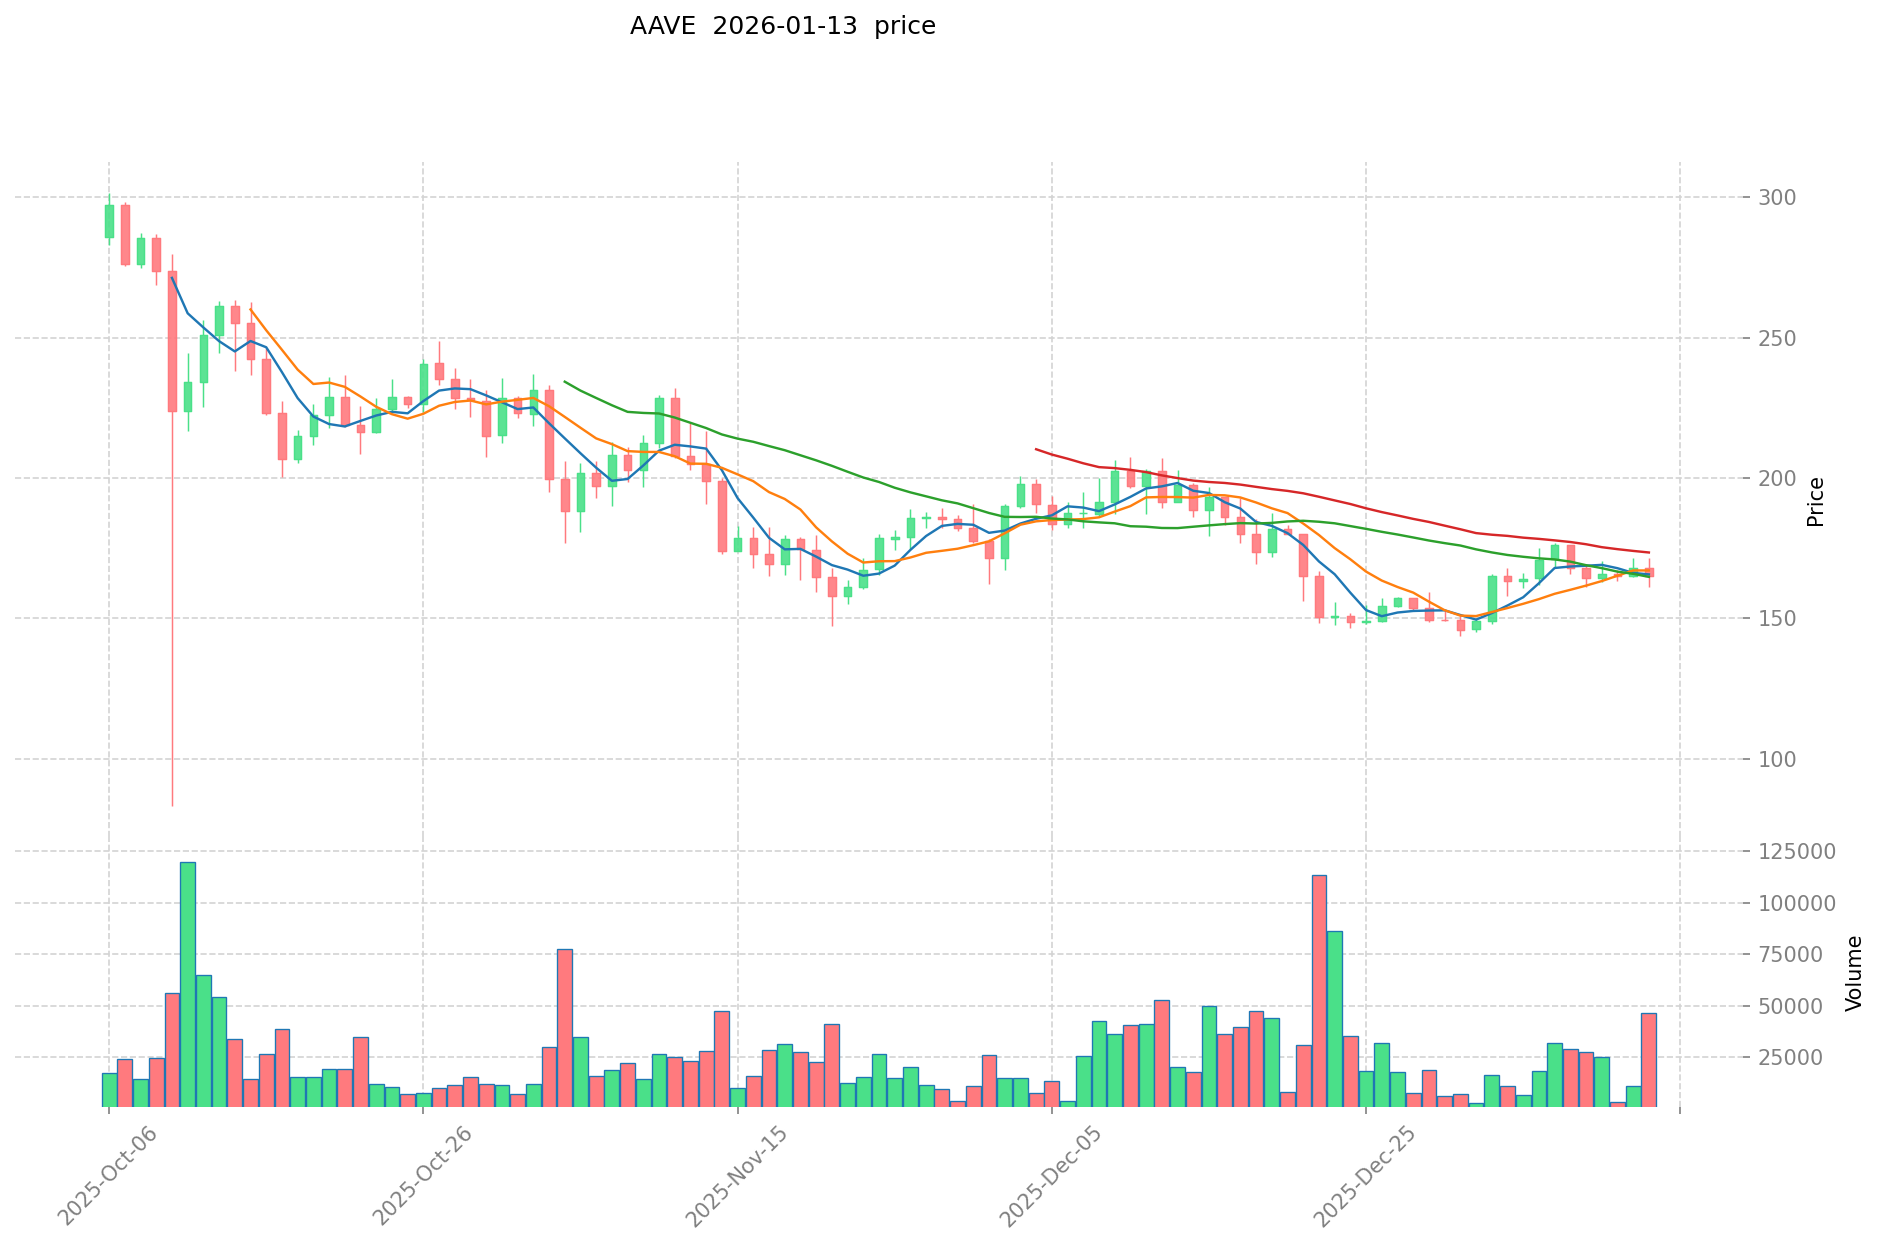
- 2021: AAVE achieved its peak price of $661.69 on May 19, 2021, during the broader cryptocurrency market rally of that period.
- Comparative Analysis: During the recent market cycle, ENA declined from its peak of $1.5208 to $0.1299, representing a decrease of over 91%. Meanwhile, AAVE dropped from $661.69 to a low of $26.02 (recorded on November 5, 2020), and has since recovered partially, though it remains significantly below its peak levels.
Current Market Status (January 14, 2026)
- ENA Current Price: $0.2284
- AAVE Current Price: $175.02
- 24-Hour Trading Volume: ENA recorded $2,485,882.68 compared to AAVE's $7,170,362.29
- Market Sentiment Index (Fear & Greed Index): 26 (Fear)
View real-time prices:
II. Core Factors Influencing ENA vs AAVE Investment Value
Tokenomics Comparison
-
ENA: Fixed maximum supply of 15 billion tokens with a current circulating supply of approximately 6.35 billion tokens (42.36% of total supply). The protocol employs a phased unlock schedule with significant token releases planned over the next 12 months, including over $500 million in private investor unlocks and approximately $640 million allocated to founding teams and early contributors.
-
AAVE: Circulating supply of 15.2 million tokens with a market capitalization reflecting established protocol maturity. AAVE demonstrates a more mature token distribution model with reduced unlock pressure compared to newer protocols.
-
📌 Historical Pattern: ENA's token unlock schedule presents potential selling pressure, with net token releases expected to decrease from 41.6% to 34.6% of circulating supply following StablecoinX treasury buyback activities. AAVE's established distribution pattern provides more predictable supply dynamics.
Institutional Adoption and Market Application
-
Institutional Holdings: AAVE maintains stronger institutional confidence with a Total Value Locked (TVL) of $31.92 billion, demonstrating sustained DeFi user trust. ENA shows rapid growth with TVL reaching $8.91 billion despite its newer market presence.
-
Enterprise Adoption: ENA focuses on stablecoin infrastructure through USDe integration across 16 blockchain networks and partnerships with DeFi protocols including Pendle, Aave, Morpho, and Euler. AAVE serves as core lending infrastructure integrated into fintech applications and traditional finance systems, providing backend services for decentralized borrowing and lending.
-
Regulatory Positioning: ENA demonstrates proactive compliance efforts through USDtb stablecoin development aligned with the GENIUS Act framework, partnering with Anchorage Digital for institutional-grade custody services. AAVE benefits from established regulatory relationships as a mature DeFi protocol.
Technology Development and Ecosystem Building
-
ENA Technical Development: The protocol is developing Converge Chain, an Ethereum Layer-2 network built on Arbitrum, introducing KYC/KYB verification and permissioned validator nodes. ENA tokens serve as staking requirements for network validators. Additional ecosystem projects include Ethereal (a decentralized exchange centered on USDe) and Strata (a risk-tranching protocol for yield-bearing stablecoins).
-
AAVE Technical Evolution: AAVE continues expanding its lending protocol infrastructure with Esco savings products that distribute GHO borrowing revenue to users without lock-up periods. The protocol maintains high capital efficiency with borrowing pool utilization rates between 88-92%.
-
Ecosystem Comparison: ENA focuses on stablecoin-centric applications spanning DeFi, payments, and cross-chain integration. AAVE emphasizes lending protocol optimization and integration into broader financial technology infrastructure. Both protocols demonstrate active DeFi engagement, though with different strategic focuses.
Macroeconomic Factors and Market Cycles
-
Performance in Inflationary Environments: ENA's revenue generation model correlates strongly with market sentiment, as funding rates typically increase during bull markets (potentially exceeding 10% APY) but may decline or turn negative during bearish periods. AAVE demonstrates more stable performance across market cycles due to consistent lending demand.
-
Macroeconomic Policy Impact: Rising interest rates and dollar strength affect both protocols differently. ENA's yield generation depends heavily on perpetual contract funding rates and ETH staking returns, creating market-sensitive revenue streams. AAVE benefits from increased borrowing demand during periods of rising risk appetite.
-
Geopolitical Considerations: Cross-border transaction demands and international regulatory developments influence adoption patterns. ENA's compliance-focused approach through USDtb positions it for institutional adoption in regulated markets, while AAVE's established infrastructure serves as critical DeFi plumbing regardless of geopolitical shifts.
III. 2026-2031 Price Forecast: ENA vs AAVE
Short-term Forecast (2026)
- ENA: Conservative $0.13-$0.23 | Optimistic $0.23-$0.24
- AAVE: Conservative $142-$207 | Optimistic $175-$207
Medium-term Forecast (2028-2029)
- ENA may enter a consolidation phase with potential growth, estimated price range $0.24-$0.39
- AAVE may enter a development phase, estimated price range $160-$271
- Key drivers: institutional capital inflows, ETF developments, ecosystem expansion
Long-term Forecast (2030-2031)
- ENA: Baseline scenario $0.27-$0.48 | Optimistic scenario $0.39-$0.60
- AAVE: Baseline scenario $140-$319 | Optimistic scenario $222-$319
View detailed price predictions for ENA and AAVE
Disclaimer
ENA:
| Year |
Predicted High Price |
Predicted Average Price |
Predicted Low Price |
Price Change |
| 2026 |
0.23961 |
0.2282 |
0.12551 |
0 |
| 2027 |
0.33448415 |
0.233905 |
0.19881925 |
2 |
| 2028 |
0.386504622 |
0.284194575 |
0.250091226 |
24 |
| 2029 |
0.385652038275 |
0.3353495985 |
0.238098214935 |
46 |
| 2030 |
0.48307109663925 |
0.3605008183875 |
0.26677060560675 |
57 |
| 2031 |
0.603153919244126 |
0.421785957513375 |
0.388043080912305 |
84 |
AAVE:
| Year |
Predicted High Price |
Predicted Average Price |
Predicted Low Price |
Price Change |
| 2026 |
206.6888 |
175.16 |
141.8796 |
0 |
| 2027 |
208.107596 |
190.9244 |
141.284056 |
9 |
| 2028 |
241.41435758 |
199.515998 |
159.6127984 |
13 |
| 2029 |
271.1721686817 |
220.46517779 |
194.0093564552 |
25 |
| 2030 |
290.066034418303 |
245.81867323585 |
140.1166437444345 |
40 |
| 2031 |
318.851401054221035 |
267.9423538270765 |
222.392153676473495 |
53 |
IV. Investment Strategy Comparison: ENA vs AAVE
Long-term vs Short-term Investment Strategies
-
ENA: Suitable for investors focused on stablecoin infrastructure development and emerging DeFi ecosystem opportunities. The protocol's positioning in synthetic dollar solutions and upcoming Layer-2 network development (Converge Chain) may appeal to those seeking exposure to next-generation stablecoin technology. The phased token unlock schedule presents considerations for entry timing strategies.
-
AAVE: Suitable for investors seeking exposure to established DeFi lending infrastructure with demonstrated market resilience. The protocol's mature TVL of $31.92 billion and consistent lending demand across market cycles may attract those prioritizing proven business models over speculative growth potential.
Risk Management and Asset Allocation
-
Conservative Investors: ENA 20-30% vs AAVE 70-80%. This allocation reflects AAVE's established market position and more predictable supply dynamics compared to ENA's emerging protocol status and significant upcoming token unlocks.
-
Aggressive Investors: ENA 50-60% vs AAVE 40-50%. Higher ENA allocation may capture potential upside from stablecoin infrastructure adoption and ecosystem expansion, while AAVE provides portfolio stability through established DeFi positioning.
-
Hedging Tools: Stablecoin allocation in portfolio construction, derivatives positioning through options strategies, and cross-asset diversification across complementary DeFi protocols. Consider correlation patterns between lending protocols and stablecoin infrastructure during different market conditions.
V. Potential Risk Comparison
Market Risk
-
ENA: Revenue generation model exhibits strong correlation with market sentiment and funding rate fluctuations. During bearish market conditions, perpetual contract funding rates may decline or turn negative, potentially impacting protocol revenue streams. The token's significant price volatility (over 91% decline from peak to low) indicates elevated market risk exposure.
-
AAVE: Demonstrated resilience across market cycles with sustained lending demand, though protocol TVL and token price remain sensitive to broader DeFi market conditions. Historical price performance shows significant drawdowns during adverse market environments, though recovery patterns suggest established market support levels.
Technical Risk
-
ENA: Protocol development includes ambitious expansion into Layer-2 infrastructure (Converge Chain) with KYC/KYB verification requirements and permissioned validator systems. Implementation complexity and ecosystem adoption rates present technical execution risks. Integration across 16 blockchain networks creates multi-chain coordination challenges.
-
AAVE: As a mature lending protocol, technical risks center on smart contract security, oracle reliability, and capital efficiency optimization. Borrowing pool utilization rates between 88-92% indicate high capital efficiency but may create liquidity constraints during stress scenarios. Protocol upgrades and governance decisions impact operational stability.
Regulatory Risk
- Global regulatory developments affect both protocols differently based on their operational models. ENA's focus on compliant stablecoin infrastructure (USDtb development aligned with GENIUS Act framework) positions it within evolving regulatory frameworks but creates dependency on policy outcomes. AAVE's established DeFi lending operations face ongoing regulatory scrutiny regarding securities classification, lending license requirements, and consumer protection standards across jurisdictions. Cross-border operational considerations and varying regional regulatory approaches present compliance complexity for both protocols.
VI. Conclusion: Which Is the Better Buy?
📌 Investment Value Summary:
-
ENA Strengths: Emerging stablecoin infrastructure positioning with USDe integration across multiple blockchains, proactive regulatory compliance approach through USDtb development, and Layer-2 network expansion plans. Current market price of $0.2284 represents significant discount from peak levels, potentially offering entry opportunities for those accepting higher risk profiles.
-
AAVE Strengths: Established DeFi lending protocol with TVL of $31.92 billion demonstrating sustained market confidence, proven business model generating consistent revenue across market cycles, mature token distribution reducing unlock pressure, and integration into broader fintech infrastructure. Current market price of $175.02 reflects established protocol positioning within DeFi ecosystem.
✅ Investment Recommendations:
-
New Investors: Consider initiating positions with AAVE's established protocol infrastructure while maintaining cautious exposure to ENA's emerging ecosystem. Dollar-cost averaging approaches may help navigate market volatility across both assets. Prioritize understanding fundamental protocol mechanics before committing capital.
-
Experienced Investors: Evaluate portfolio allocation based on risk tolerance and conviction in stablecoin infrastructure versus lending protocol positioning. Consider timing entry points relative to token unlock schedules (particularly relevant for ENA) and broader market cycle dynamics. Monitor protocol development milestones and ecosystem adoption metrics for both assets.
-
Institutional Investors: AAVE's mature TVL, established regulatory relationships, and proven market presence may align with institutional risk parameters. ENA's compliance-focused stablecoin development and institutional custody partnerships through Anchorage Digital present opportunities for those seeking exposure to regulated stablecoin infrastructure. Due diligence on governance structures, technical security audits, and regulatory positioning remains essential for both protocols.
⚠️ Risk Warning: Cryptocurrency markets exhibit high volatility. This content does not constitute investment advice. Conduct thorough research and consider professional financial guidance before making investment decisions.
VII. FAQ
Q1: What are the main differences in revenue models between ENA and AAVE?
ENA generates revenue primarily through perpetual contract funding rates and ETH staking yields, making it highly sensitive to market sentiment and volatility. AAVE generates revenue through lending interest rate spreads and protocol fees, providing more stable income streams across different market conditions with borrowing pool utilization rates consistently maintained between 88-92%.
Q2: How does token unlock schedule impact ENA's short-term price potential?
ENA faces significant selling pressure from upcoming token unlocks, with over $500 million in private investor unlocks and approximately $640 million allocated to founding teams and early contributors planned over the next 12 months. This represents a decrease in circulating supply from 41.6% to 34.6% following StablecoinX treasury buyback activities, potentially creating downward price pressure during unlock periods compared to AAVE's more mature and predictable token distribution.
Q3: Which protocol demonstrates stronger institutional adoption?
AAVE maintains stronger institutional confidence with a Total Value Locked (TVL) of $31.92 billion, demonstrating sustained DeFi user trust and integration into traditional finance systems. While ENA shows rapid growth with TVL reaching $8.91 billion despite its newer market presence, AAVE's established infrastructure and proven track record since 2020 provide stronger evidence of institutional adoption and market resilience.
Q4: How do regulatory developments differently affect ENA versus AAVE?
ENA demonstrates proactive compliance through USDtb stablecoin development aligned with the GENIUS Act framework and partnerships with Anchorage Digital for institutional-grade custody services, positioning it within evolving regulatory frameworks but creating dependency on policy outcomes. AAVE faces ongoing regulatory scrutiny regarding securities classification, lending license requirements, and consumer protection standards across jurisdictions, though its established DeFi operations benefit from clearer regulatory precedents as a mature protocol.
Q5: What portfolio allocation strategy suits different investor risk profiles?
Conservative investors should consider 20-30% ENA versus 70-80% AAVE allocation, reflecting AAVE's established market position and predictable supply dynamics. Aggressive investors may allocate 50-60% ENA versus 40-50% AAVE to capture potential upside from stablecoin infrastructure adoption while maintaining portfolio stability through AAVE's proven DeFi positioning. Both strategies require ongoing monitoring of protocol development milestones and market cycle dynamics.
Q6: How do macroeconomic conditions impact each protocol's performance?
ENA's revenue generation correlates strongly with market sentiment, as funding rates typically increase during bull markets (potentially exceeding 10% APY) but may decline or turn negative during bearish periods, making it more volatile across economic cycles. AAVE demonstrates more stable performance due to consistent lending demand regardless of market conditions, though protocol TVL and token price remain sensitive to broader risk appetite and interest rate environments affecting DeFi borrowing activity.
Q7: What are the key technical risks investors should consider?
ENA faces technical execution risks from ambitious Layer-2 infrastructure development (Converge Chain) with KYC/KYB verification requirements and multi-chain integration across 16 blockchain networks, creating coordination complexity. AAVE's technical risks center on smart contract security, oracle reliability, and potential liquidity constraints during stress scenarios given high capital efficiency with borrowing pool utilization rates between 88-92%. Both protocols require ongoing monitoring of development progress and security audit outcomes.
Q8: Which protocol offers better long-term growth potential through 2031?
Price forecasts suggest ENA may reach $0.39-$0.60 by 2031 (representing potential 84% increase from 2026 baseline), while AAVE may reach $222-$319 (representing potential 53% increase from 2026 baseline). However, these projections depend heavily on protocol adoption rates, regulatory developments, and broader market conditions. ENA offers higher speculative growth potential through emerging stablecoin infrastructure positioning, while AAVE provides more predictable returns through established DeFi lending operations and proven business model sustainability.
* The information is not intended to be and does not constitute financial advice or any other recommendation of any sort offered or endorsed by Gate.