This comprehensive analysis examines the cryptocurrency market's response to recent volatility and anticipated Federal Reserve rate cuts. The article explains how Bitcoin's recent $87,000 decline resulted from leverage liquidations rather than fundamental deterioration, while institutional adoption via BlackRock ETFs and strong consumer spending indicate underlying market strength. With an 87% probability of rate cuts, the analysis outlines how monetary policy shifts typically benefit crypto assets through dollar weakness and increased liquidity. The guide provides tailored strategies for cash holders, current asset owners, and active traders, emphasizing risk-reward optimization during this transitional period. Critical monitoring indicators include Treasury yields, dollar index movements, funding rates, and Bitcoin's $85,000 technical support level, offering readers actionable insights for navigating near-term market uncertainty while positioning for potential institutional-driven rallies.
What's Happening in the Market Recently?
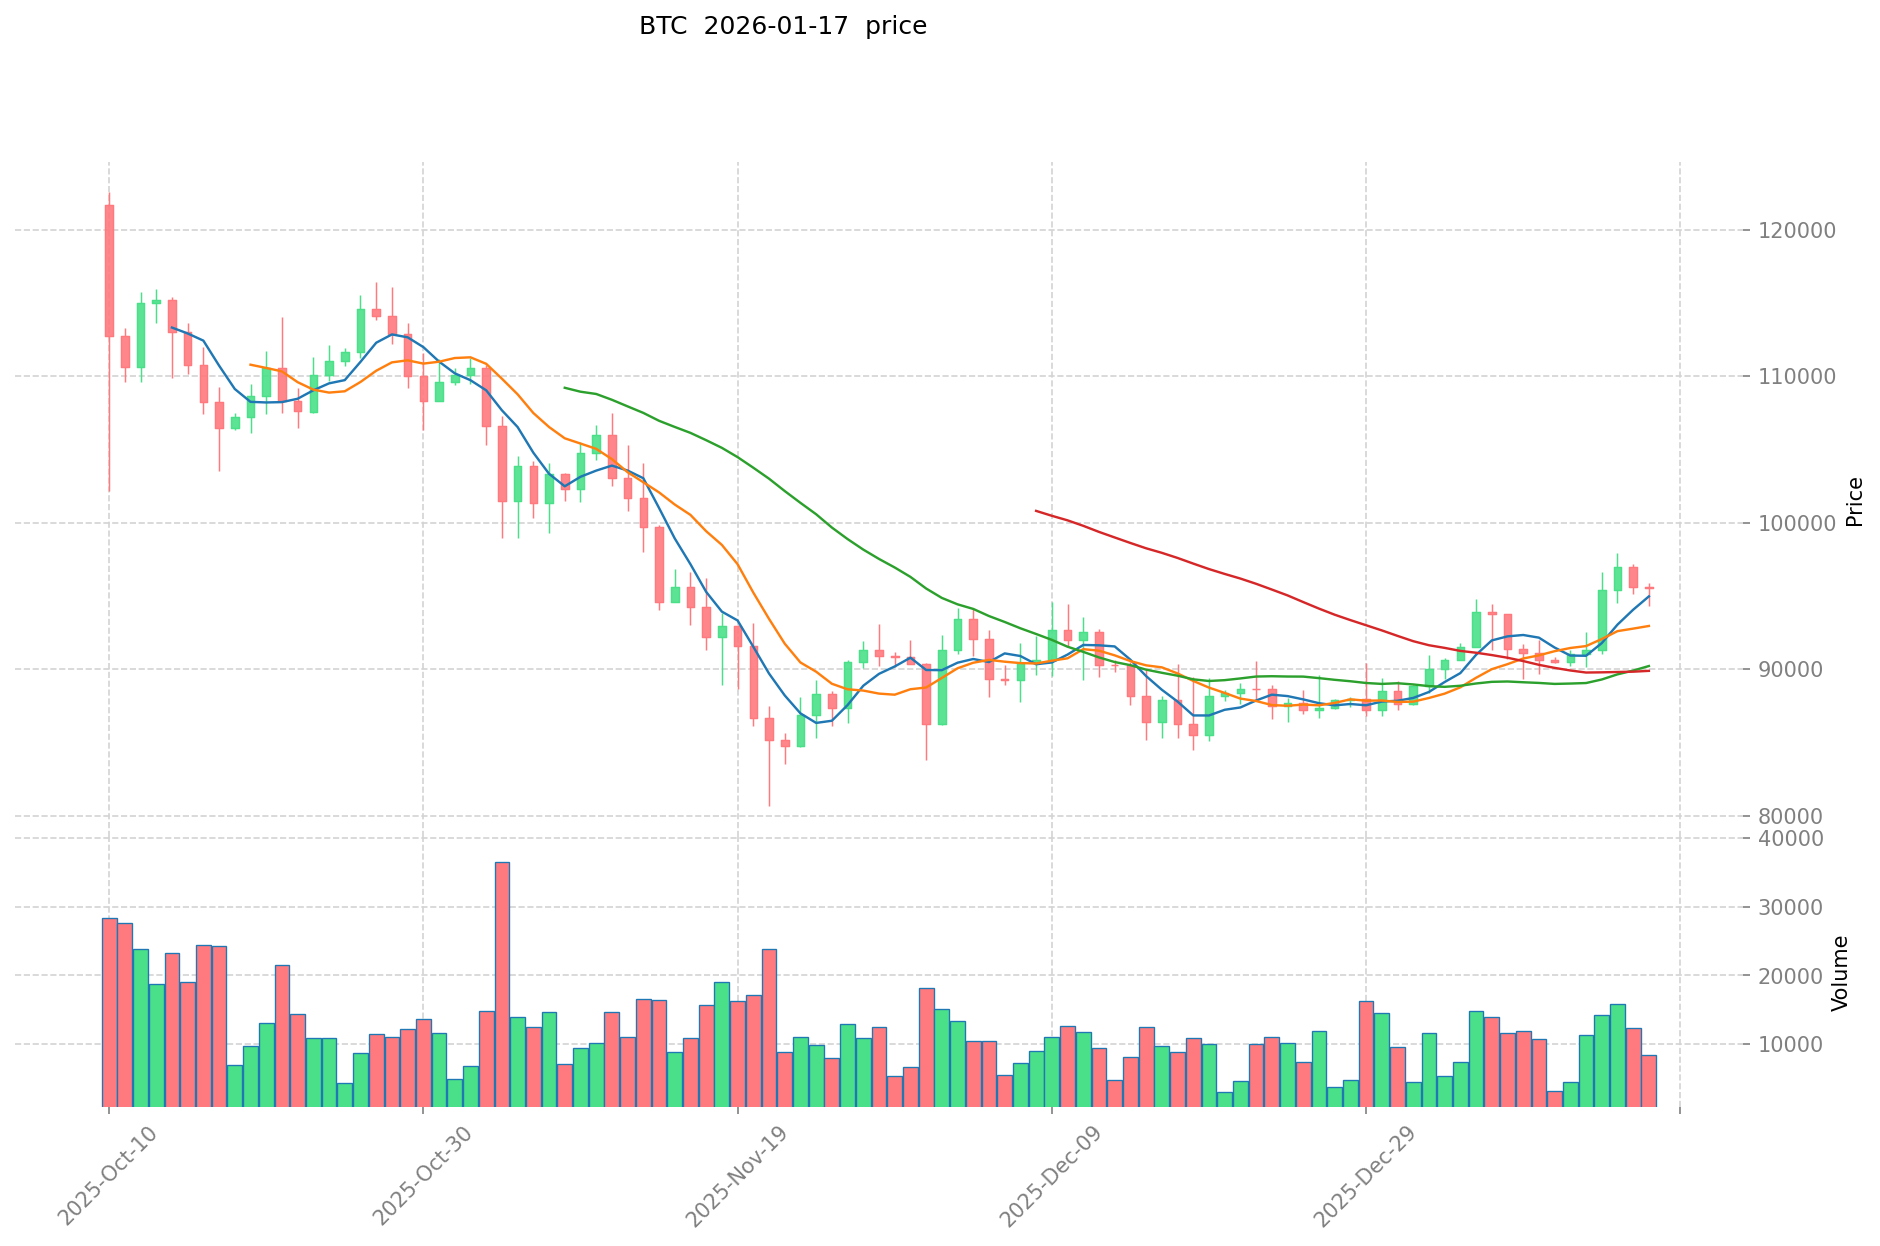
Over the recent weekend, Bitcoin experienced a sharp decline from approximately $90,000 to below $87,000. This dramatic price movement triggered over $200 million in leveraged position liquidations within a single hour. The broader crypto market witnessed a massive capital outflow, with $140 billion evaporating from the total market capitalization within just four hours.
This volatility created significant uncertainty among investors. However, examining the concurrent developments reveals a more nuanced picture of market dynamics. Several positive indicators emerged simultaneously with the price decline, suggesting underlying strength in the market fundamentals.
During this same period, BlackRock announced that Bitcoin ETFs have become their largest revenue source, marking a significant milestone in institutional adoption. Michael Saylor, known for his aggressive Bitcoin accumulation strategy, hinted at additional purchases during the dip. Consumer spending demonstrated remarkable resilience, with Black Friday online spending reaching a record-breaking $11.8 billion. Additionally, gold prices hit all-time highs, indicating strong demand for hard assets amid economic uncertainty.
This creates an apparent paradox: Is the market collapsing or strengthening? The answer is both, and understanding why is crucial for navigating the coming month successfully. The price action reflects technical deleveraging, while fundamental demand continues to build, creating opportunities for informed investors.
Why Did the Decline Occur?
This wasn't a fundamental breakdown but rather a classic leverage liquidation cascade. Understanding the mechanics of this event is essential for contextualizing the current market situation and identifying potential opportunities.
A large number of investors had established leveraged long positions, betting on continued price appreciation. When prices began declining during the weekend, the reduced liquidity characteristic of weekend trading amplified the impact. This triggered a chain reaction of forced liquidations, where one liquidation pushed prices lower, triggering additional liquidations in a cascading effect.
Think of this as a crowded exit scenario. When everyone attempts to exit simultaneously, a stampede occurs. However, once the crowd disperses, the building remains structurally sound. The infrastructure and fundamental reasons that attracted investors initially remain intact and, in many cases, have strengthened during the decline.
The catalysts that continue to excite long-term investors haven't changed. In fact, while prices dropped, these fundamental drivers have become more compelling. Institutional adoption continues accelerating, regulatory clarity improves, and the macroeconomic environment increasingly favors hard assets. The leverage flush actually creates a healthier market structure by removing excessive speculation and resetting funding rates to more sustainable levels.
This type of technical correction, while painful for overleveraged traders, often creates attractive entry points for patient capital. The distinction between technical price action and fundamental value becomes most apparent during such events, separating short-term traders from long-term investors.
What Does the 87% Probability of a Rate Cut Mean?
When the Federal Reserve cuts interest rates, borrowing costs decrease across the economy. This monetary policy shift has profound implications for asset prices, particularly for high-growth and liquidity-sensitive assets like cryptocurrencies. Understanding this transmission mechanism is crucial for positioning portfolios appropriately.
Lower interest rates make traditional savings less attractive, pushing capital toward higher-yielding investments. More money flows into markets, especially into assets that move quickly during liquidity expansions. Cryptocurrencies, with their 24/7 trading and global accessibility, often lead these liquidity-driven rallies.
The typical sequence unfolds as follows:
Stage One: Expectation Building - As rate cut expectations increase, the dollar weakens in anticipation. This initial phase often sees smart money positioning ahead of the actual policy change. Currency markets typically move first, followed by commodities and alternative assets.
Stage Two: Dollar Weakness - A weaker dollar makes hard assets like Bitcoin and gold more attractive. International investors find dollar-denominated assets cheaper, increasing demand. This phase often sees increased correlation between crypto and traditional safe-haven assets.
Stage Three: Liquidity Injection - More liquidity entering markets causes risk assets to rally. This liquidity doesn't distribute evenly; it flows through specific channels, with crypto often receiving disproportionate inflows due to its accessibility and growth potential.
Stage Four: Cascading Rally - Bitcoin typically moves first, establishing a trend. Subsequently, altcoins follow, often with amplified movements. This sequencing creates opportunities for tactical allocation shifts within crypto portfolios.
We're currently in the first stage, with markets beginning to price in upcoming developments. This explains why sophisticated investors like Saylor are buying during dips. They're positioning not for today's price, but for the coming liquidity shift. The current weakness represents a discount relative to expected future conditions rather than a fundamental deterioration.
Historically, the anticipation phase of rate cuts has proven more profitable than the actual implementation, as markets front-run policy changes. Understanding where we are in this cycle provides a strategic advantage for portfolio positioning.
What Should You Do?
If You're Holding Cash
This could represent a favorable entry point, not because the bottom is definitively in, but because several factors align favorably. The risk-reward profile has improved significantly compared to recent weeks.
Leveraged positions have been liquidated, leaving the market with healthier structure. Excessive speculation has been flushed out, reducing the risk of further cascading liquidations. The macroeconomic environment is turning supportive, with rate cuts likely and institutional adoption accelerating. Major institutions continue accumulating despite short-term volatility, demonstrating conviction in long-term value.
Consider implementing a dollar-cost averaging strategy with gradual purchases. This approach provides several advantages: If prices decline further, you acquire assets at lower costs, improving your average entry price. If prices recover, you're already positioned to benefit from the move. This strategy removes the pressure of timing the exact bottom while ensuring participation in potential upside.
For implementation, consider dividing your intended allocation into multiple tranches over several weeks. This approach balances the opportunity cost of waiting with the risk of buying before further declines. Adjust the pace based on market conditions and technical levels.
If You're Already Holding Assets
Patience has strong justification based on current conditions. The signals that prompted your initial purchases haven't changed; many have strengthened. Maintaining conviction during volatility separates successful long-term investors from those who exit prematurely.
ETF demand continues growing, with institutional products seeing consistent inflows. This represents sticky, long-term capital rather than speculative hot money. Rate cuts are approaching, with an 87% probability indicating high market confidence in this outcome. Adoption metrics continue rising across multiple dimensions: wallet growth, transaction volumes, and institutional integration all trend positively.
Short-term volatility represents the entry ticket to this market, not a reason to exit. If 10-15% fluctuations cause significant stress, you may have excessive position size relative to your risk tolerance. Consider whether your allocation aligns with your investment timeline and risk capacity. Long-term holders should view volatility as opportunity rather than threat, potentially adding to positions during weakness rather than reducing exposure.
Maintaining a long-term perspective requires discipline during volatile periods. Review your original investment thesis and assess whether fundamental conditions have changed. In most cases, short-term price action reflects technical factors rather than fundamental deterioration.
If You're Actively Trading
The month preceding Fed decisions typically features choppy, range-bound price action. This environment, while challenging for trend followers, creates opportunities for range-trading strategies and systematic approaches.
Grid trading bots can execute automatic buy-sell operations within defined ranges, capitalizing on volatility without requiring constant monitoring. These systems work particularly well in range-bound markets, generating returns from oscillation rather than directional movement.
Monitor funding rates closely as indicators of market positioning. Following liquidation peaks, markets typically calm as excessive leverage is removed. Neutral or slightly negative funding rates indicate balanced positioning and reduced risk of further cascades.
Maintain smaller position sizes than normal until clear directional momentum emerges. This approach preserves capital and flexibility while allowing participation in potential moves. Consider using wider stop losses to avoid getting shaken out by normal volatility, or eliminate stops entirely for small positions you're comfortable holding through drawdowns.
Focus on high-probability setups rather than forcing trades in unclear conditions. The coming month may offer fewer but higher-quality opportunities as the market digests recent moves and positions for the Fed decision.
What to Watch This Month
For Fed Decision Implications:
Treasury bond yields serve as a critical indicator of rate expectations. Declining yields signal increasing confidence in rate cuts, which typically benefits crypto assets. Monitor the 10-year Treasury yield as the benchmark for long-term rate expectations.
The dollar index (DXY) provides insight into currency market positioning. Dollar weakness generally correlates with crypto strength, as international investors find dollar-denominated assets more attractive and liquidity flows into alternative assets.
Fed official speeches before the upcoming meeting offer clues about policy direction. Pay particular attention to voting members' comments, as these carry more weight in predicting actual decisions. Look for shifts in language regarding inflation concerns versus growth priorities.
For Crypto Momentum Indicators:
Funding rates remaining neutral or slightly negative indicates healthy market structure. Extremely positive funding rates suggest overleveraged long positions vulnerable to liquidation, while extremely negative rates might indicate excessive pessimism and potential for short squeezes.
ETF flow data provides insight into institutional demand. Consistent inflows demonstrate sustained interest regardless of short-term price action, while outflows might signal deteriorating sentiment among traditional investors.
Bitcoin maintaining above $85,000 represents a critical technical level. This price point has served as support multiple times, and holding above it suggests underlying demand. A high-volume break below this level would change the technical picture, potentially indicating deeper correction.
Additional factors to monitor include on-chain metrics such as exchange balances (declining balances suggest accumulation), active addresses (increasing activity indicates growing engagement), and miner behavior (holding versus selling indicates confidence in future prices).
If Bitcoin breaks below $85,000 with high volume, the scenario changes significantly, potentially indicating a deeper correction phase. Until then, this movement appears more like a healthy reset than a fundamental breakdown, clearing excessive leverage and resetting market structure for potential continuation of the broader uptrend.
Summary
The market experienced a classic leverage liquidation event rather than a fundamental breakdown. Prices dropped sharply as overleveraged traders were forced out, and the market is now reshaping from a healthier base with reduced speculative excess.
The macroeconomic picture is turning supportive for risk assets and particularly for cryptocurrencies. Rate cut probability stands at 87%, indicating high confidence in accommodative monetary policy ahead. Institutions continue accumulating despite short-term volatility, demonstrating conviction in long-term value. Consumer spending remains strong, suggesting economic resilience. Gold reaching historic highs confirms strong demand for hard assets amid uncertainty.
None of this guarantees prices will rise immediately. Markets can remain irrational or range-bound for extended periods. However, these factors indicate that underlying demand remains robust while the recent decline was primarily mechanical rather than fundamental. The distinction between technical price action and fundamental value is crucial for maintaining appropriate perspective.
The coming month will likely feature continued volatility as markets digest recent moves and position for the Fed decision. Investors focusing on the bigger picture rather than short-term price fluctuations will have a clearer roadmap for navigating this period. Patience and discipline will likely be rewarded as the fundamental drivers of crypto adoption and institutional integration continue developing regardless of short-term price noise.
This environment favors those with longer time horizons and appropriate position sizing over those attempting to trade every fluctuation. The reset in leverage and funding rates creates a healthier foundation for potential continuation of the broader uptrend once near-term uncertainty resolves.
FAQ
How does Federal Reserve rate cuts directly impact Bitcoin and Ethereum crypto prices?
Fed rate cuts lower borrowing costs and boost liquidity, encouraging investors to seek higher-yield assets like Bitcoin and Ethereum. Lower rates weaken the dollar, reduce opportunity costs for non-yielding assets, and enhance risk appetite, typically driving crypto prices higher over the coming month.
Why is the cryptocurrency market so sensitive to Federal Reserve interest rate decisions?
Low Fed rates reduce returns on traditional investments, pushing investors toward higher-risk crypto assets. Rising rates reverse this flow, redirecting capital to safer securities. Crypto's volatility amplifies rate-driven market shifts significantly.
Historically, how long does it typically take for cryptocurrencies to react after a Federal Reserve rate cut?
Cryptocurrencies typically respond within days to weeks following Fed rate cuts. Historically, Bitcoin and altcoins have shown positive reactions within 1-4 weeks as lower borrowing costs increase market liquidity and capital flows into risk assets. Some movements can occur immediately upon announcement, while broader market rallies develop over subsequent weeks.
If the Fed cuts rates next month, how should I adjust my crypto investment strategy?
Consider increasing exposure to undervalued assets like ETH and resilient meme coins such as Pepe and Doge for potential gains. Focus on emerging projects with strong community support and solid fundamentals. Stay informed on regulatory developments and market sentiment shifts during the easing cycle.
Will Fed rate cuts increase inflation risk for cryptocurrencies?
Fed rate cuts typically increase monetary supply, potentially driving inflation. This historically diverts capital from traditional banks into alternative assets like crypto, increasing demand and prices. However, inflation impact on crypto depends on market sentiment and broader economic conditions.
What does 87% Fed rate cut probability mean? Has the market already priced it in?
An 87% probability signals imminent global liquidity expansion and potential awakening of dormant capital into risk assets. Market has partially priced this in, but crypto typically sees major moves post-announcement as flows accelerate. Early positioning before official cuts could yield significant gains.
In a rate cut environment, Bitcoin and other store-of-value assets typically outperform as safe-haven investments. Low-cap altcoins and yield-generating tokens may also benefit from increased liquidity and lower borrowing costs, driving speculative trading volume growth.
What is the relationship between Federal Reserve rate cuts and cryptocurrency mining yields?
Fed rate cuts lower borrowing costs and increase liquidity, making risk assets like crypto more attractive. Lower interest rates typically boost mining profitability as capital becomes cheaper and investor demand for crypto strengthens, potentially increasing mining rewards' real value.
* The information is not intended to be and does not constitute financial advice or any other recommendation of any sort offered or endorsed by Gate.