This comprehensive analysis compares GLQ and QNT, two distinct blockchain platforms addressing different market needs. GLQ, launched in 2021, offers no-code DeFi automation with current ranking #2029 and market cap $2.08M. QNT, operational since 2018, provides enterprise-grade interoperability solutions, ranking #75 with $1B+ market capitalization. The article examines historical price trends, tokenomics, institutional adoption, and technological ecosystems. GLQ presents higher-risk growth opportunities for emerging automation technologies, while QNT suits investors seeking established blockchain interoperability with proven enterprise adoption. Price forecasts through 2031 project significant growth potential for both assets. Investment strategies vary by risk profile: conservative allocations favor QNT 85-90%, while aggressive portfolios may increase GLQ exposure to 30-40%. The analysis addresses liquidity differences, regulatory implications, and market cycle dynamics, providing investors with data-driven
Introduction: GLQ vs QNT Investment Comparison
In the cryptocurrency market, the comparison between GLQ vs QNT has been a topic of ongoing interest among investors. The two assets differ significantly in market capitalization ranking, application scenarios, and price performance, representing distinct positioning within the crypto asset landscape.
GraphLinq Protocol (GLQ): Launched in 2021, this project aims to automate decentralized DeFi data monitoring and external execution through multi-chain applications. GLQ positions itself as a no-code blockchain automation solution, connecting blockchain networks with external systems.
Quant (QNT): Operating since 2018, Quant Network has established itself as a technology provider enabling trusted digital interactions. Through its Overledger operating system, QNT addresses blockchain interoperability challenges and serves enterprises, regulators, governments, and individuals.
As of February 2026, GLQ ranks #2029 with a market capitalization of approximately $2.08 million and a token price of $0.00613, while QNT holds #75 ranking with a market capitalization exceeding $1 billion and trades at $68.89. The circulating supply stands at 340 million GLQ tokens (68% of max supply) compared to 14.54 million QNT tokens (approximately 32% of max supply).
This article examines historical price trends, supply mechanisms, institutional adoption, technical ecosystems, and future outlook to provide a comprehensive analysis of GLQ vs QNT investment value comparison. We address key questions that matter most to investors:
"Which asset aligns better with different investment strategies and risk profiles?"
I. Historical Price Comparison and Current Market Status
GLQ (Coin A) and QNT (Coin B) Historical Price Trends
- 2021: QNT reached a significant milestone with its price climbing to $427.42 in September 2021, marking a notable period of growth.
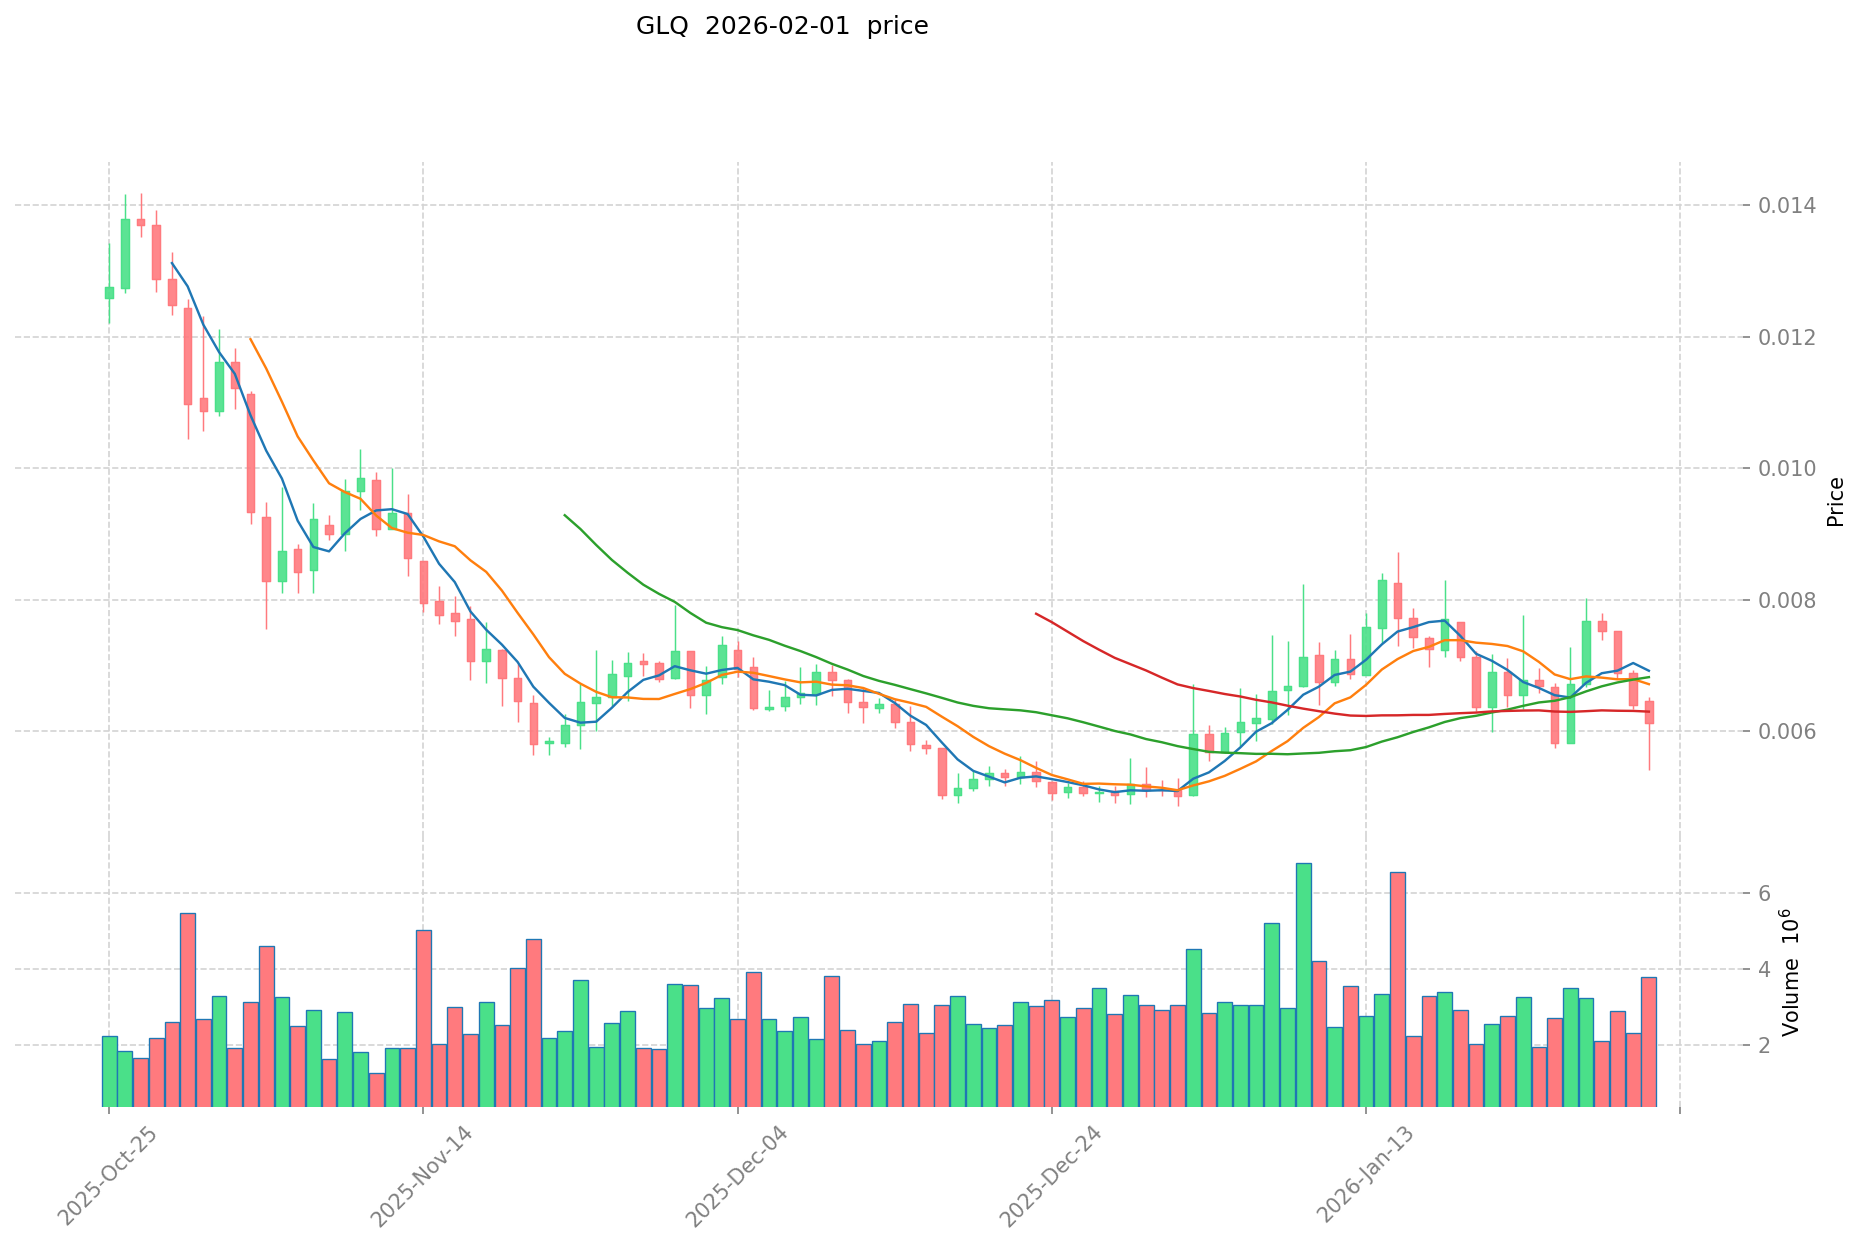
- 2022: GLQ experienced considerable volatility, with its price declining to a historical low of $0.00118009 in June 2022.
- Comparative Analysis: During the recent market cycle, GLQ declined from its historical high of $0.19361 in March 2024 to its current level, while QNT has retreated from its peak of $427.42 to approximately $68.89, representing a substantial correction from its historical high.
Current Market Status (2026-02-01)
- GLQ current price: $0.00613
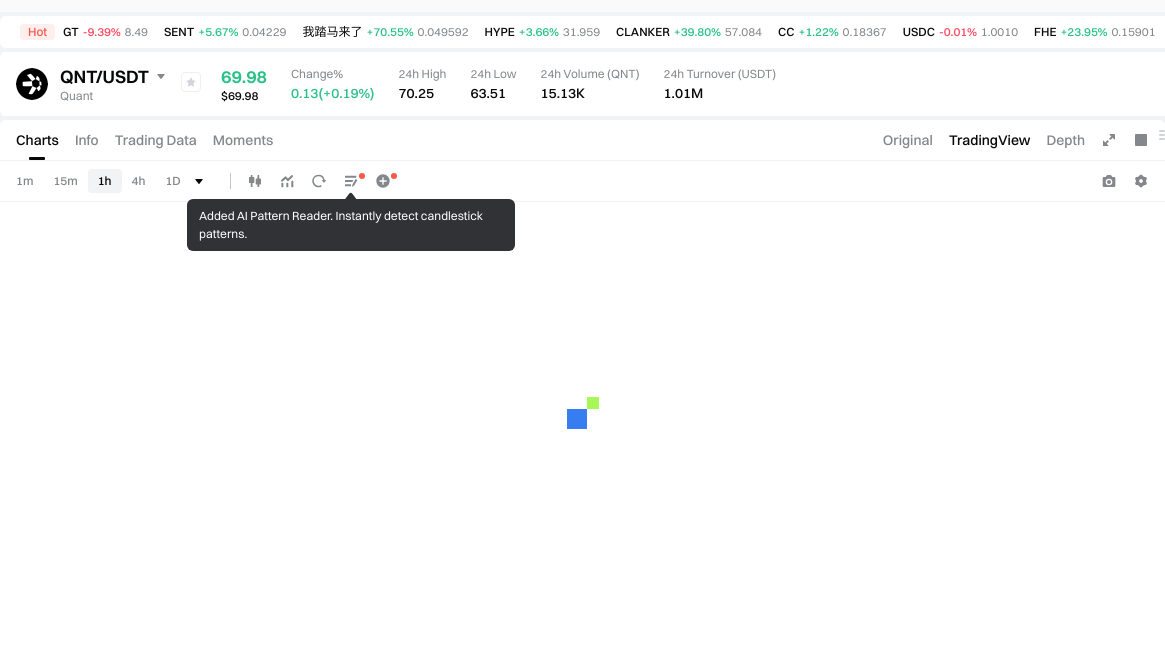
- QNT current price: $68.89
- 24-hour trading volume: GLQ $22,769.72 vs QNT $1,002,027.25
- Market sentiment index (Fear & Greed Index): 20 (Extreme Fear)
View real-time prices:
II. Core Factors Influencing GLQ vs QNT Investment Value
Supply Mechanism Comparison (Tokenomics)
- GLQ: The value dynamics are influenced by supply and demand ratios in the cryptocurrency market, with scarcity and utility playing significant roles in determining token value.
- QNT: Market value is similarly affected by supply-demand balance and practical application scenarios within the crypto ecosystem.
- 📌 Historical Pattern: Supply mechanisms and scarcity factors have historically contributed to price fluctuations, with demand-side pressure and utility considerations driving market cycles.
Institutional Adoption and Market Application
- Institutional Holdings: Market activity and investor demand influence the relative appeal of both assets to institutional participants.
- Enterprise Adoption: Both tokens serve distinct roles within the cryptocurrency landscape, with their utility and practical applications affecting adoption patterns.
- Regulatory Environment: Market acceptance is shaped by varying regulatory approaches across different jurisdictions.
Technology Development and Ecosystem Building
- GLQ Technology: The token operates within its unique framework in the crypto market, with value tied to specific use cases.
- QNT Technology: Similarly positioned with distinct utility characteristics within the digital asset space.
- Ecosystem Comparison: Both assets participate in the broader cryptocurrency ecosystem, with their respective applications contributing to overall market dynamics.
Macroeconomic Environment and Market Cycles
- Inflation Environment Performance: Cryptocurrency assets generally respond to macroeconomic conditions, with scarcity and market demand influencing performance during different economic cycles.
- Macroeconomic Monetary Policy: Interest rates, currency valuations, and broader financial market conditions affect cryptocurrency market dynamics.
- Geopolitical Factors: Cross-border transaction demand and international market conditions may influence adoption patterns and market activity for digital assets.
III. 2026-2031 Price Forecast: GLQ vs QNT
Short-term Forecast (2026)
- GLQ: Conservative $0.004347 - $0.00621 | Optimistic $0.00621 - $0.0085077
- QNT: Conservative $50.2704 - $69.82 | Optimistic $69.82 - $76.802
Mid-term Forecast (2028-2029)
- GLQ may enter a consolidation phase, with projected price range of $0.00607988187 - $0.00968277483 in 2028, potentially reaching $0.005156640549 - $0.00953978501565 in 2029
- QNT may enter an expansion phase, with projected price range of $48.22764135 - $107.8991298 in 2028, potentially reaching $88.183016082 - $135.593239782 in 2029
- Key drivers: institutional capital inflows, ETF developments, ecosystem expansion
Long-term Forecast (2030-2031)
- GLQ: Baseline scenario $0.0069816615833 - $0.009067092965325 (2030) | Optimistic scenario $0.009654640589478 - $0.012068300736847 (2031)
- QNT: Baseline scenario $63.36376397505 - $115.206843591 (2030) | Optimistic scenario $91.6585647609996 - $160.4024883317493 (2031)
View detailed price predictions for GLQ and QNT
Disclaimer
GLQ:
| Year |
Predicted High Price |
Predicted Average Price |
Predicted Low Price |
Price Change |
| 2026 |
0.0085077 |
0.00621 |
0.004347 |
1 |
| 2027 |
0.007653204 |
0.00735885 |
0.006034257 |
20 |
| 2028 |
0.00968277483 |
0.007506027 |
0.00607988187 |
22 |
| 2029 |
0.00953978501565 |
0.008594400915 |
0.005156640549 |
40 |
| 2030 |
0.012875272010761 |
0.009067092965325 |
0.0069816615833 |
47 |
| 2031 |
0.012068300736847 |
0.010971182488043 |
0.009654640589478 |
78 |
QNT:
| Year |
Predicted High Price |
Predicted Average Price |
Predicted Low Price |
Price Change |
| 2026 |
76.802 |
69.82 |
50.2704 |
1 |
| 2027 |
90.17253 |
73.311 |
37.38861 |
6 |
| 2028 |
107.8991298 |
81.741765 |
48.22764135 |
18 |
| 2029 |
135.593239782 |
94.8204474 |
88.183016082 |
37 |
| 2030 |
154.37717041194 |
115.206843591 |
63.36376397505 |
67 |
| 2031 |
160.4024883317493 |
134.79200700147 |
91.6585647609996 |
95 |
IV. Investment Strategy Comparison: GLQ vs QNT
Long-term vs Short-term Investment Strategies
- GLQ: May appeal to investors exploring emerging automation technologies within the blockchain space, focusing on niche application scenarios and higher-risk growth opportunities
- QNT: May suit investors seeking exposure to established blockchain interoperability solutions with broader enterprise adoption patterns and more developed market positioning
Risk Management and Asset Allocation
- Conservative investors: GLQ 10-15% vs QNT 85-90%
- Aggressive investors: GLQ 30-40% vs QNT 60-70%
- Hedging tools: stablecoin allocation, options strategies, cross-asset portfolio diversification
V. Potential Risk Comparison
Market Risk
- GLQ: Lower market capitalization ranking (#2029) and limited trading volume ($22,769.72 daily) may contribute to heightened price volatility and liquidity constraints during market stress periods
- QNT: While holding a stronger market position (#75 ranking), the asset has experienced considerable price corrections from historical levels, indicating exposure to broader market cycle dynamics
Technology Risk
- GLQ: Scalability considerations, network stability requirements, and adoption challenges associated with emerging automation protocols
- QNT: Operational complexity of multi-chain interoperability infrastructure, technical implementation barriers, and dependency on enterprise integration timelines
Regulatory Risk
- Global regulatory approaches toward blockchain interoperability solutions and automation protocols vary across jurisdictions, potentially affecting adoption pathways, compliance requirements, and market access for both assets differently based on their respective use cases and target audiences
VI. Conclusion: Which Is the Better Buy?
📌 Investment Value Summary:
- GLQ advantages: Positioning in blockchain automation sector with potential for niche application development; lower entry price point offering different risk-reward characteristics
- QNT advantages: Established market presence with enterprise-focused interoperability solutions; stronger liquidity profile and higher market capitalization providing relative stability within the crypto asset class
✅ Investment Recommendations:
- Novice investors: Consider prioritizing assets with stronger market positioning, higher liquidity, and more established track records; thorough research and risk assessment are essential before any allocation decisions
- Experienced investors: Evaluate portfolio diversification strategies that account for different risk profiles, market cycles, and technological development stages; consider allocation ratios aligned with individual risk tolerance levels
- Institutional investors: Conduct comprehensive due diligence on regulatory compliance, custody solutions, liquidity management, and alignment with investment mandates; assess both assets within broader digital asset allocation frameworks
⚠️ Risk Warning: The cryptocurrency market exhibits extreme volatility. This content does not constitute investment advice.
VII. FAQ
Q1: What are the main differences between GLQ and QNT in terms of market positioning?
GLQ is an emerging blockchain automation protocol ranked #2029 with a market cap of $2.08 million, while QNT is an established blockchain interoperability solution ranked #75 with over $1 billion market cap. GLQ focuses on no-code automation for DeFi monitoring, whereas QNT provides enterprise-grade interoperability through its Overledger operating system. The fundamental difference lies in their maturity levels: QNT has been operational since 2018 with proven enterprise adoption, while GLQ launched in 2021 targeting niche automation scenarios with significantly higher volatility and lower liquidity.
Q2: How do the supply mechanisms of GLQ and QNT affect their investment value?
GLQ has 340 million tokens in circulation (68% of max supply) with a current price of $0.00613, while QNT has 14.54 million tokens circulating (approximately 32% of max supply) trading at $68.89. QNT's lower circulating supply percentage suggests greater scarcity dynamics, potentially supporting price stability during market cycles. Both tokens' value is influenced by supply-demand ratios, with QNT's more limited circulation and higher token price reflecting established market demand. GLQ's higher circulation percentage indicates most tokens are already in the market, which may limit scarcity-driven appreciation potential.
Q3: What are the price forecasts for GLQ and QNT through 2031?
For 2026, GLQ's conservative forecast ranges from $0.004347 to $0.00621, with optimistic scenarios reaching $0.0085077, while QNT forecasts range conservatively from $50.27 to $69.82, with optimistic projections up to $76.80. By 2031, GLQ could reach $0.009654 to $0.012068 in optimistic scenarios, representing potential 78% growth from current levels. QNT's long-term forecast suggests $91.66 to $160.40 by 2031, indicating 95% potential growth. These forecasts depend heavily on institutional adoption, ecosystem development, regulatory clarity, and broader market cycle dynamics affecting the cryptocurrency sector.
Q4: Which asset presents better liquidity for investors?
QNT demonstrates significantly superior liquidity with 24-hour trading volume of $1,002,027.25 compared to GLQ's $22,769.72. This 44x difference in trading volume means QNT investors can execute larger orders with minimal price impact, while GLQ's limited liquidity may result in substantial slippage during entry or exit. QNT's #75 market ranking and established exchange presence provide more trading pairs and deeper order books. For institutional investors or those managing larger positions, QNT's liquidity profile reduces execution risk, whereas GLQ's thin trading volume may restrict position sizing and increase transaction costs.
Q5: How do technological capabilities compare between GLQ and QNT?
GLQ offers no-code blockchain automation connecting blockchain networks with external systems for DeFi monitoring and execution, targeting developers seeking simplified automation tools. QNT's Overledger operating system addresses enterprise-grade blockchain interoperability challenges, serving governments, regulators, and large organizations requiring multi-chain infrastructure. QNT's technology maturity is evidenced by its 2018 launch and enterprise client base, while GLQ represents emerging automation technology with higher implementation risk. From a technological risk perspective, QNT's proven operational history provides greater certainty, whereas GLQ faces scalability questions and adoption barriers typical of newer protocols.
Q6: What allocation strategy should investors consider for portfolio diversification?
Conservative investors should consider allocating 85-90% to QNT and 10-15% to GLQ, prioritizing established assets with proven market presence and liquidity. Aggressive investors may increase GLQ exposure to 30-40% while maintaining 60-70% in QNT, accepting higher volatility for potential growth from emerging technologies. This allocation recognizes QNT's relative stability within crypto assets and GLQ's higher-risk, higher-potential-reward profile. Portfolio construction should incorporate stablecoin buffers, consider options strategies for downside protection, and regularly rebalance based on market conditions. All investors should ensure total crypto exposure aligns with overall risk tolerance and financial objectives.
Q7: What are the primary regulatory risks affecting GLQ and QNT differently?
Both assets face regulatory uncertainty, but their risk profiles differ based on use cases. QNT's enterprise focus on serving governments and regulated institutions requires compliance with evolving securities regulations, data privacy laws, and cross-border transaction rules. Regulatory clarity could accelerate QNT adoption as institutions gain confidence, but adverse rulings might restrict enterprise deployment. GLQ's DeFi automation applications face potential scrutiny regarding smart contract regulations, automated trading restrictions, and decentralized protocol oversight. Geographic regulatory fragmentation affects both assets differently: QNT may benefit from regulatory frameworks supporting institutional blockchain adoption, while GLQ faces uncertainties around DeFi regulatory treatment across jurisdictions.
Q8: During extreme market fear conditions, how do GLQ and QNT typically perform?
With the current Fear & Greed Index at 20 (Extreme Fear), historical patterns suggest both assets experience downward pressure, though with different characteristics. QNT's higher liquidity and institutional presence may provide relative resilience during panic selling, as established holders and larger market depth can absorb some selling pressure. GLQ's thin liquidity exacerbates volatility during fear phases, potentially seeing sharper percentage declines as limited buy-side support allows prices to gap lower. Recovery patterns also differ: QNT typically rebounds more steadily as institutional interest returns, while GLQ may experience more erratic price action. Investors should anticipate amplified volatility for GLQ during extreme fear periods and consider this when sizing positions or planning entry strategies.
* The information is not intended to be and does not constitute financial advice or any other recommendation of any sort offered or endorsed by Gate.