This article provides a thorough analysis of Bubblemaps (BMT), assessing its investment potential through tokenomics, use cases, and market dynamics. It explores BMT's distinctive position as the first DeFi supply auditing tool, highlighting its importance for investor transparency and fraud protection. Key sections cover BMT's price history, current market status, distribution challenges, and valuation metrics. The analysis also addresses potential risks and strategic investment approaches for various investor types. Suitable for crypto investors seeking insights into BMT’s long-term viability and underlying infrastructure developments with relevant market data sourced from Gate.
Introduction: Bubblemaps (BMT) Investment Position and Market Prospects
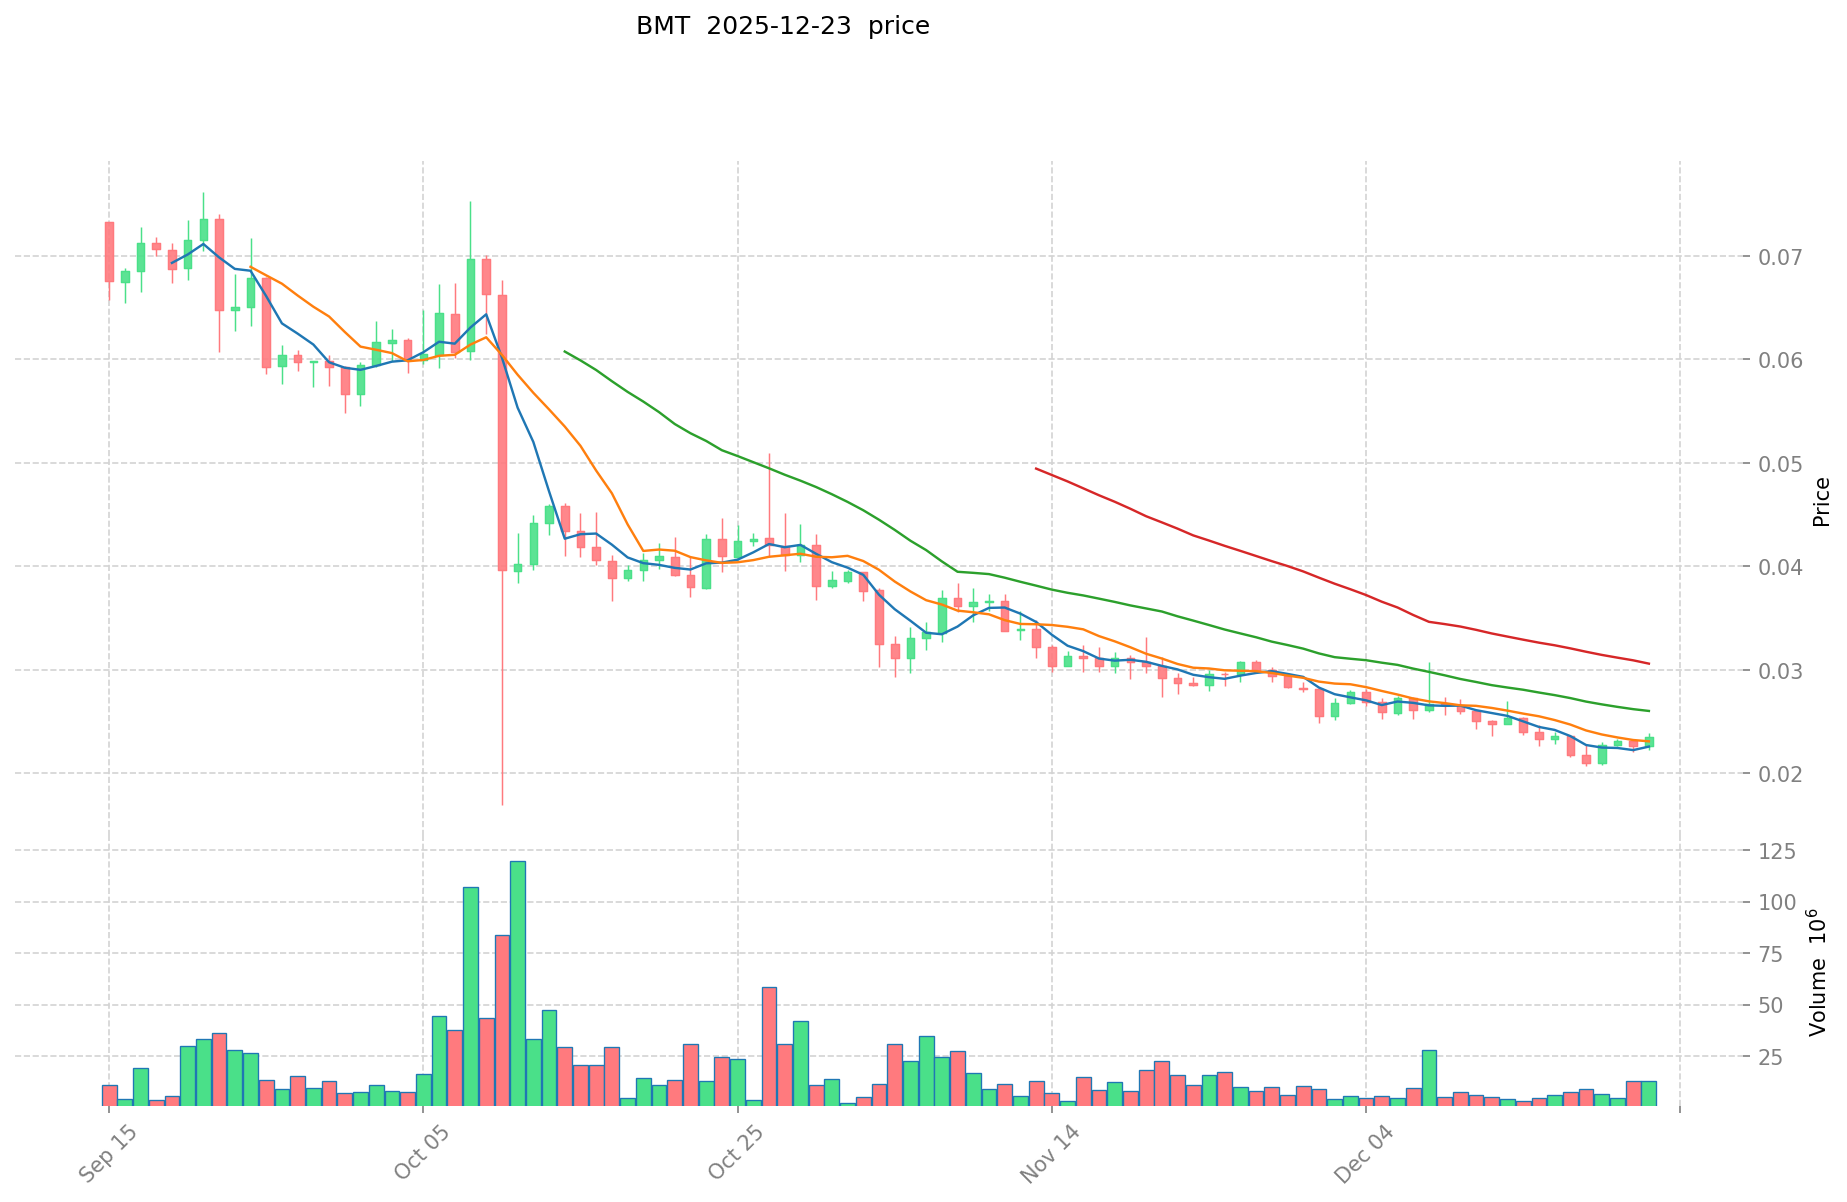
Bubblemaps (BMT) is an important asset in the cryptocurrency field. As the first supply auditing tool for DeFi tokens and NFTs, BMT has carved out a distinctive niche in the decentralized finance ecosystem. As of December 23, 2025, BMT maintains a market capitalization of approximately $23.62 million with a fully diluted valuation of the same amount. The token has a circulating supply of 256.18 million BMT out of a total supply of 1 billion BMT, with the current price positioned at $0.02362. Operating on both Solana and BEP-20 blockchains, BMT has established itself across 28 trading exchanges with 27,590 token holders.
The token exhibits notable price volatility, having reached an all-time high of $0.3262 on March 18, 2025, while dropping to an all-time low of $0.01687 on October 10, 2025, reflecting the broader market dynamics and investor sentiment shifts within the DeFi tooling sector. Recent performance shows mixed signals, with a 24-hour gain of 3.87% contrasting against a 30-day decline of 17.38% and a one-year depreciation of 74.94%.
Given the growing importance of supply auditing and token transparency tools in maintaining ecosystem integrity and protecting investors from fraudulent projects, BMT's specialized positioning raises relevant questions among market participants regarding its investment viability and long-term potential. This article provides a comprehensive analysis of BMT's investment value proposition, historical price trends, future price projections, and associated investment risks to inform investor decision-making.
Bubblemaps (BMT) Crypto Asset Research Report
I. BMT Price History Review and Current Investment Value Status
Based on the available data as of December 23, 2025:
- All-Time High (ATH): $0.3262 (March 18, 2025)
- All-Time Low (ATL): $0.01687 (October 10, 2025)
- Current Price: $0.02362
Price Movement Analysis:
The token experienced significant volatility throughout 2025. From its ATH of $0.3262 in mid-March to its ATL of $0.01687 in October, BMT declined approximately 94.83% over a seven-month period. However, recovery has been observed from October to December, with the price rising from the low point.
Current BMT Market Status (December 23, 2025)
| Metric |
Value |
| Current Price |
$0.02362 |
| 24-Hour Change |
+3.87% |
| 7-Day Change |
+2.83% |
| 30-Day Change |
-17.38% |
| 1-Year Change |
-74.94% |
| 24-Hour Trading Volume |
$277,603.16 |
| Market Capitalization |
$6,050,992.86 |
| Fully Diluted Valuation (FDV) |
$23,620,000.00 |
| Circulating Supply |
256,180,900 BMT |
| Total Supply |
1,000,000,000 BMT |
| Circulating Supply Ratio |
25.7% |
| Market Rank |
#1,428 |
| Number of Holders |
27,590 |
| Exchange Listings |
28 |
Market Sentiment: Positive (Score: 1)
Access real-time BMT market data at Gate
II. Project Overview and Core Functionality
Project Description
Bubblemaps is the first supply auditing tool specifically designed for DeFi tokens and NFTs. The platform provides transparency and analysis capabilities for understanding token distribution and supply structures in the decentralized finance ecosystem.
Blockchain Infrastructure
BMT operates on multiple blockchain networks:
| Blockchain |
Contract Address |
Network |
| BSC (Binance Smart Chain) |
0x7d814b9ed370ec0a502edc3267393bf62d891b62 |
BEP-20 |
| Solana |
FQgtfugBdpFN7PZ6NdPrZpVLDBrPGxXesi4gVu3vErhY |
Solana |
Key Resources
III. Token Economics and Distribution
Supply Structure
- Total Supply: 1,000,000,000 BMT
- Maximum Supply: 1,000,000,000 BMT
- Circulating Supply: 256,180,900 BMT (25.7% of total supply)
- Remaining Supply to Circulate: 743,819,100 BMT (74.3%)
The token distribution indicates that approximately three-quarters of the total supply remains to be released into circulation, which could potentially impact price dynamics as supply gradually increases.
IV. Market Position and Metrics
Market Share and Dominance
- Market Capitalization Rank: #1,428 among all cryptocurrencies
- Market Dominance: 0.00073%
- Market Cap to FDV Ratio: 25.7%
The market cap to fully diluted valuation ratio of 25.7% suggests significant dilution potential upon full supply circulation.
Trading and Liquidity
- 24-Hour Trading Volume: $277,603.16
- Volume-to-Market Cap Ratio: Approximately 4.59%
- Exchange Presence: Listed on 28 different exchanges
- Holder Count: 27,590 addresses
V. Price Volatility Analysis
Short-Term Price Movements
| Time Period |
Price Change |
Absolute Change |
| 1 Hour |
+0.25% |
+$0.00006 |
| 24 Hours |
+3.87% |
+$0.00088 |
| 7 Days |
+2.83% |
+$0.00065 |
| 30 Days |
-17.38% |
-$0.00497 |
| 1 Year |
-74.94% |
-$0.07063 |
The data demonstrates significant volatility with recovery in the short term (1H, 24H, 7D) but substantial losses over medium (30D) and long-term (1Y) periods.
Price Range Analysis
- 24-Hour High: $0.02387
- 24-Hour Low: $0.02221
- Range Volatility: 7.5%
Report Generated: December 23, 2025
Data Source: Gate Market Data
Disclaimer: This report presents factual market data and project information. It does not constitute investment advice, and readers should conduct their own research before making any investment decisions.
Bubblemaps (BMT) Investment Analysis Report
Report Date: December 23, 2025
I. Executive Summary
Bubblemaps (BMT) is the first supply auditing tool for DeFi tokens and NFTs, operating on Solana and BSC blockchains. As of December 23, 2025, BMT is trading at $0.02362 with a market capitalization of approximately $6.05 million and a fully diluted valuation of $23.62 million. The token has demonstrated significant volatility, with a year-to-date decline of 74.94% and a 30-day decline of 17.38%, though it has recovered 3.87% in the last 24 hours.
II. Core Factors Affecting BMT Investment Viability
A. Supply Mechanism and Scarcity
Token Distribution:
- Total Supply: 1,000,000,000 BMT
- Circulating Supply: 256,180,900 BMT (25.7% of total supply)
- Circulating to Fully Diluted Ratio: 25.7%
- Total Holders: 27,590
Investment Implications: The relatively low circulation ratio suggests significant future token inflation potential as more tokens enter circulation. This structural supply dynamic represents a headwind for price appreciation in the near to medium term.
Historical Price Action:
- All-Time High: $0.3262 (March 18, 2025)
- All-Time Low: $0.01687 (October 10, 2025)
- Current Price: $0.02362
- 24-Hour Range: $0.02221 - $0.02387
Multi-Timeframe Performance:
| Period |
Change |
Amount |
| 1 Hour |
+0.25% |
+$0.000059 |
| 24 Hours |
+3.87% |
+$0.000880 |
| 7 Days |
+2.83% |
+$0.000650 |
| 30 Days |
-17.38% |
-$0.004969 |
| 1 Year |
-74.94% |
-$0.070634 |
C. Market Adoption and Exchange Presence
Trading Infrastructure:
- Listed on 28 cryptocurrency exchanges
- 24-Hour Trading Volume: $277,603.16
- Network Deployment: Solana and BSC (BEP-20)
- Contract Addresses:
- BSC: 0x7d814b9ed370ec0a502edc3267393bf62d891b62
- Solana: FQgtfugBdpFN7PZ6NdPrZpVLDBrPGxXesi4gVu3vErhY
III. Market Position and Valuation Metrics
Ranking and Dominance:
- CoinGecko Ranking: #1,428
- Market Share: 0.00073%
- Market Cap Rank: Highly fragmented crypto market position
Valuation Assessment:
- Current market cap ($6.05M) represents significant discount from ATH valuation ($326.2M equivalent at $0.3262 price)
- Fully diluted valuation of $23.62M suggests current undervaluation relative to maximum supply
- Low trading volume relative to market cap indicates limited liquidity
IV. Project Fundamentals
Use Case: Supply auditing tool for DeFi tokens and NFTs represents a specialized infrastructure play within the broader blockchain ecosystem.
Project Resources:
V. Mixed Market Outlook
Available market analysis presents divergent perspectives:
Bullish Indicators:
- Potential growth in 2025-2030 period driven by increased demand for blockchain analytics
- Price recovery trajectory evident in recent trading (up 3.87% in 24 hours)
- Price action established strong base above $0.09 zone since early June
Bearish Indicators:
- 74.94% decline over the past year
- 17.38% decline over the past 30 days
- Technical analysis indicates bearish signals despite strong fundamentals
- Significant discount from all-time high suggests market pessimism
VI. Key Considerations for Market Participants
I. Liquidity Constraints: Low 24-hour trading volume relative to market cap suggests potential slippage for larger transactions and limited exit liquidity.
II. Supply Pressure: With only 25.7% of total supply in circulation, future token releases represent significant dilution risk for existing holders.
III. Specialization Risk: As a specialized analytics tool, market adoption depends on DeFi ecosystem adoption rates and competitive positioning against alternative solutions.
IV. Volatility Profile: 74.94% annual decline demonstrates extreme price volatility, indicating this asset class carries substantial risk.
VII. Conclusion
Bubblemaps (BMT) represents a specialized infrastructure token within the blockchain analytics space. The current market valuation reflects significant bearish sentiment despite the project's fundamental focus on supply auditing for DeFi tokens and NFTs. The divergent market forecasts—ranging from bullish growth projections to bearish technical outlooks—indicate genuine uncertainty regarding the token's investment trajectory.
Market participants should consider the structural supply dynamics, limited trading liquidity, and historical price volatility when evaluating BMT's investment profile. The specialized nature of the supply auditing tool creates both opportunity and concentration risk depending on broader DeFi ecosystem adoption trends.
Data as of: December 23, 2025, 09:19 UTC
III. BMT Future Investment Forecast and Price Outlook (Is Bubblemaps(BMT) worth investing in 2026-2030)
Short-term Investment Forecast (2026, short-term BMT investment outlook)
- Conservative Forecast: $0.0156 - $0.0248
- Neutral Forecast: $0.0248 - $0.0357
- Optimistic Forecast: $0.0357 - $0.0457
Mid-term Investment Outlook (2027-2029, mid-term Bubblemaps(BMT) investment forecast)
- Market Stage Expectations: Bubblemaps is positioned to benefit from increased institutional adoption of on-chain analytics and growing enterprise demand for supply auditing tools across DeFi and NFT ecosystems.
- Investment Return Predictions:
- 2027: $0.0206 - $0.0445 (28% potential upside)
- 2028: $0.0258 - $0.0546 (58% potential upside)
- 2029: $0.0441 - $0.0653 (94% potential upside)
- Key Catalysts: Expansion of enterprise adoption in blockchain forensics and institutional analysis; integration with new trading venues; increased token utility through platform enhancement.
Long-term Investment Outlook (Is Bubblemaps a good long-term investment?)
- Base Case Scenario: $0.0490 - $0.0629 (fundamental growth in on-chain auditing demand and steady platform adoption)
- Optimistic Scenario: $0.1264 - $0.1374 (widespread institutional adoption and emergence of Bubblemaps as industry standard tool; 825%+ appreciation potential by 2030)
- Risk Scenario: $0.0190 - $0.0300 (market saturation, competitive pressures, or reduced institutional demand for analytics tools)
Click to view BMT long-term investment and price forecast: Price Prediction
2025-12-23 - 2030 Long-term Outlook
- Base Case Scenario: $0.0490 - $0.0629 USD (corresponding to steady market development and mainstream adoption of supply auditing solutions)
- Optimistic Scenario: $0.0629 - $0.1264 USD (corresponding to large-scale institutional adoption and favorable market environment)
- Transformative Scenario: $0.1374 USD and above (should the ecosystem achieve breakthrough progress and achieve mainstream penetration)
- 2030-12-31 Predicted High: $0.0629 USD (based on optimistic development assumptions)
Disclaimer: This analysis is for informational purposes only and does not constitute investment advice. Price predictions involve significant uncertainty and risk. Investors should conduct thorough due diligence and consult financial advisors before making investment decisions.
| 年份 |
预测最高价 |
预测平均价格 |
预测最低价 |
涨跌幅 |
| 2025 |
0.0261072 |
0.02352 |
0.0190512 |
0 |
| 2026 |
0.035731584 |
0.0248136 |
0.015632568 |
5 |
| 2027 |
0.04450071024 |
0.030272592 |
0.02058536256 |
28 |
| 2028 |
0.0545845106352 |
0.03738665112 |
0.0257967892728 |
58 |
| 2029 |
0.065299524846192 |
0.0459855808776 |
0.044146157642496 |
94 |
| 2030 |
0.062876084733942 |
0.055642552861896 |
0.048965446518468 |
135 |
Bubblemaps (BMT) Comprehensive Research Report
I. Project Overview
Bubblemaps is the first supply auditing tool for DeFi tokens and NFTs. The project operates on multiple blockchain networks including Solana and BEP-20 (BSC), providing transparency and verification services for token distributions.
Token Details
- Token Symbol: BMT
- Market Ranking: 1,428
- Current Price: $0.02362
- Total Supply: 1,000,000,000
- Circulating Supply: 256,180,900 (25.7% of total supply)
- Market Capitalization: $6,050,992.86
- Fully Diluted Valuation: $23,620,000
- Number of Holders: 27,590
- Active Exchanges: 28
Network Deployment
- BSC Contract Address: 0x7d814b9ed370ec0a502edc3267393bf62d891b62
- Solana Contract Address: FQgtfugBdpFN7PZ6NdPrZpVLDBrPGxXesi4gVu3vErhY
| Time Period |
Change Percentage |
Change Amount |
| 1 Hour |
+0.25% |
+$0.000059 |
| 24 Hours |
+3.87% |
+$0.000880 |
| 7 Days |
+2.83% |
+$0.000650 |
| 30 Days |
-17.38% |
-$0.004969 |
| 1 Year |
-74.94% |
-$0.070634 |
Historical Price Extremes
- All-Time High: $0.3262 (March 18, 2025)
- All-Time Low: $0.01687 (October 10, 2025)
- 24-Hour Range: $0.02221 - $0.02387
Trading Volume & Liquidity
- 24-Hour Volume: $277,603.16
- Market Dominance: 0.00073%
- Market Emotion Indicator: Positive (1)
III. IV. Investment Strategy & Risk Management
Investment Methodology
Long-term Holding (HODL BMT)
- Suitable for conservative investors seeking exposure to DeFi infrastructure tools
- Appropriate for those believing in the long-term utility of supply auditing services
- Recommended timeframe: 12+ months
Active Trading
- Dependent on technical analysis and price action patterns
- Leverage the 24-hour volatility observed in current market conditions
- Require monitoring of trading volume across 28 active exchanges
Risk Management
Asset Allocation Recommendations
- Conservative Investors: BMT allocation ≤ 1-2% of total portfolio
- Aggressive Investors: BMT allocation ≤ 3-5% of total portfolio
- Institutional Investors: Strategic allocation based on DeFi infrastructure thesis
Security Storage
- Utilize cold wallet solutions for long-term holdings
- Hardware wallet storage recommended for significant holdings
- Consider multi-signature wallets for enhanced security
V. Investment Risks & Challenges
Market Risks
- High Volatility: Price declined 74.94% over the past year, demonstrating significant downside risk
- Low Trading Volume: $277,603 daily volume may result in price slippage during larger transactions
- Market Capitalization Risk: At $6.05M market cap, the asset remains highly susceptible to market sentiment shifts
Regulatory Risks
- Uncertainty surrounding regulatory treatment of DeFi tools and token auditing services across different jurisdictions
- Potential compliance requirements for blockchain-based analysis platforms
Technical Risks
- Network security vulnerabilities across multiple blockchain deployments (BSC and Solana)
- Platform operational risks associated with maintaining audit accuracy and reliability
- Smart contract risks on supported networks
VI. Conclusion: Is Bubblemaps (BMT) a Good Investment?
Investment Value Summary
Bubblemaps operates in the DeFi infrastructure segment, offering utility-based value through supply auditing services. However, the token has experienced significant long-term depreciation (-74.94% YoY), indicating challenges in market adoption or investor confidence. The 25.7% circulating supply ratio suggests potential dilution concerns from future token releases.
Investor Recommendations
✅ Beginners: Dollar-cost averaging into small positions combined with secure cold storage; start with minimal allocation (0.5-1% of portfolio)
✅ Experienced Investors: Monitor technical support/resistance levels; consider swing trading around identified price zones; diversify across multiple DeFi infrastructure tokens
✅ Institutional Investors: Evaluate strategic allocation only if thesis centers on long-term adoption of supply auditing tools; conduct thorough due diligence on platform utility metrics and user adoption rates
⚠️ Disclaimer: Cryptocurrency investments carry substantial risk including potential total loss of capital. This report is for informational purposes only and does not constitute investment advice, financial recommendation, or solicitation to buy or sell any asset. Readers must conduct independent research and consult with qualified financial professionals before making investment decisions.
Report Generated: December 23, 2025
Bubblemaps (BMT) Frequently Asked Questions
I. What is Bubblemaps (BMT) and what problem does it solve?
Answer: Bubblemaps is the first supply auditing tool specifically designed for DeFi tokens and NFTs. It provides transparency and verification services for token distributions across decentralized finance ecosystems. The platform operates on Solana and BSC blockchains, helping investors and market participants understand token supply structures and identify potential fraudulent projects through supply analysis.
II. What is the current price and market position of BMT as of December 23, 2025?
Answer: As of December 23, 2025, BMT is trading at $0.02362 with a market capitalization of approximately $6.05 million and a fully diluted valuation of $23.62 million. The token ranks #1,428 among all cryptocurrencies with a circulating supply of 256.18 million BMT out of a total supply of 1 billion BMT. The token is listed on 28 exchanges with 27,590 token holders.
III. Why has BMT experienced significant price decline over the past year?
Answer: BMT has declined 74.94% over the past year, dropping from higher valuations to its current price of $0.02362. This decline reflects broader market dynamics within the DeFi tooling sector, investor sentiment shifts, competitive pressures, and potential challenges in user adoption. The token reached an all-time high of $0.3262 on March 18, 2025, but fell to an all-time low of $0.01687 on October 10, 2025, demonstrating extreme volatility.
IV. What is the supply dilution risk associated with BMT?
Answer: BMT presents significant dilution risk as only 25.7% of the total supply (256.18 million tokens) is currently in circulation. The remaining 743.82 million tokens (74.3% of total supply) remain to be released into circulation. This structural dynamic suggests substantial future inflation potential as more tokens enter the market, which could exert downward pressure on the token price in the near to medium term.
V. Is BMT a suitable investment for different investor types in 2026?
Answer: BMT investment suitability varies by investor profile. Conservative investors should limit BMT allocation to 1-2% of their portfolio, while aggressive investors may allocate up to 3-5%. Beginners are recommended to use dollar-cost averaging with minimal positions and cold storage security. Experienced traders may consider swing trading around identified price zones. Institutional investors should only consider strategic allocation if their thesis centers on long-term adoption of supply auditing tools, following thorough due diligence on platform metrics and user adoption rates.
VI. What are the price forecasts for BMT from 2026 to 2030?
Answer: Short-term forecasts (2026) range from $0.0156 to $0.0457 depending on market conditions. Mid-term projections show 2027-2029 with potential upside of 28-94%. Long-term scenarios by 2030 range from a conservative base case of $0.0490-$0.0629 to an optimistic scenario of $0.1264-$0.1374, representing potential appreciation of 825%+ if institutional adoption accelerates. However, these projections involve significant uncertainty and should not be considered guaranteed outcomes.
VII. What are the primary risks associated with investing in BMT?
Answer: Key investment risks include: (1) Market volatility - the token declined 74.94% year-over-year; (2) Low trading liquidity - $277,603 daily volume may cause price slippage during larger transactions; (3) Supply dilution - 74.3% of tokens remain unreleased; (4) Regulatory uncertainty surrounding DeFi tools; (5) Technical risks across multiple blockchain deployments; (6) Competitive pressures from alternative analytics platforms; (7) Dependency on broader DeFi ecosystem adoption rates.
VIII. Where can investors access BMT tokens and what security measures are recommended?
Answer: BMT is available on 28 cryptocurrency exchanges and operates on Solana (contract: FQgtfugBdpFN7PZ6NdPrZpVLDBrPGxXesi4gVu3vErhY) and BSC networks (contract: 0x7d814b9ed370ec0a502edc3267393bf62d891b62). Security best practices include utilizing cold wallet solutions for long-term holdings, hardware wallet storage for significant positions, and multi-signature wallets for enhanced security. Official resources include the website at https://bubblemaps.io/ and documentation at https://wiki.bubblemaps.io/.
Disclaimer: This FAQ is for informational purposes only and does not constitute investment advice, financial recommendation, or solicitation to buy or sell any asset. Cryptocurrency investments carry substantial risk including potential total loss of capital. Readers must conduct independent research and consult with qualified financial professionals before making investment decisions.
* The information is not intended to be and does not constitute financial advice or any other recommendation of any sort offered or endorsed by Gate.