The article offers a comprehensive analysis of Nibiru Chain (NIBI) as an investment, focusing on its tokenomics, use cases, and market potential. It explores NIBI's price history, current market status, and factors influencing its investment value. Readers will gain insights into the token's volatility, supply structure, and ecosystem development, aiding in informed investment decisions. The article is structured to present a price performance review, project overview, token distribution analysis, and future price predictions. This succinct overview caters to cryptocurrency investors seeking to understand the viability and risks of NIBI in the evolving digital asset landscape.
Introduction: Nibiru Chain (NIBI) Investment Position and Market Prospects
NIBI is an important asset in the cryptocurrency field. As of December 2025, NIBI has achieved a market capitalization of USD 19.335 million with a circulating supply of approximately 186.69 million tokens. The current price is trading around USD 0.01289. Nibiru Chain, positioned as "a breakthrough L1 blockchain and smart contract ecosystem," has gradually become a focal point when investors discuss "Is Nibiru Chain (NIBI) a good investment?" The project aims to establish itself as the most developer-friendly and user-friendly smart contract platform in Web3, offering superior throughput and unparalleled security.
This analysis will comprehensively examine NIBI's investment value, historical price trends, future price forecasts, and investment risks to provide investors with valuable reference points for decision-making.
Nibiru Chain (NIBI) Comprehensive Analysis Report
I. Price History Review and Current Investment Status
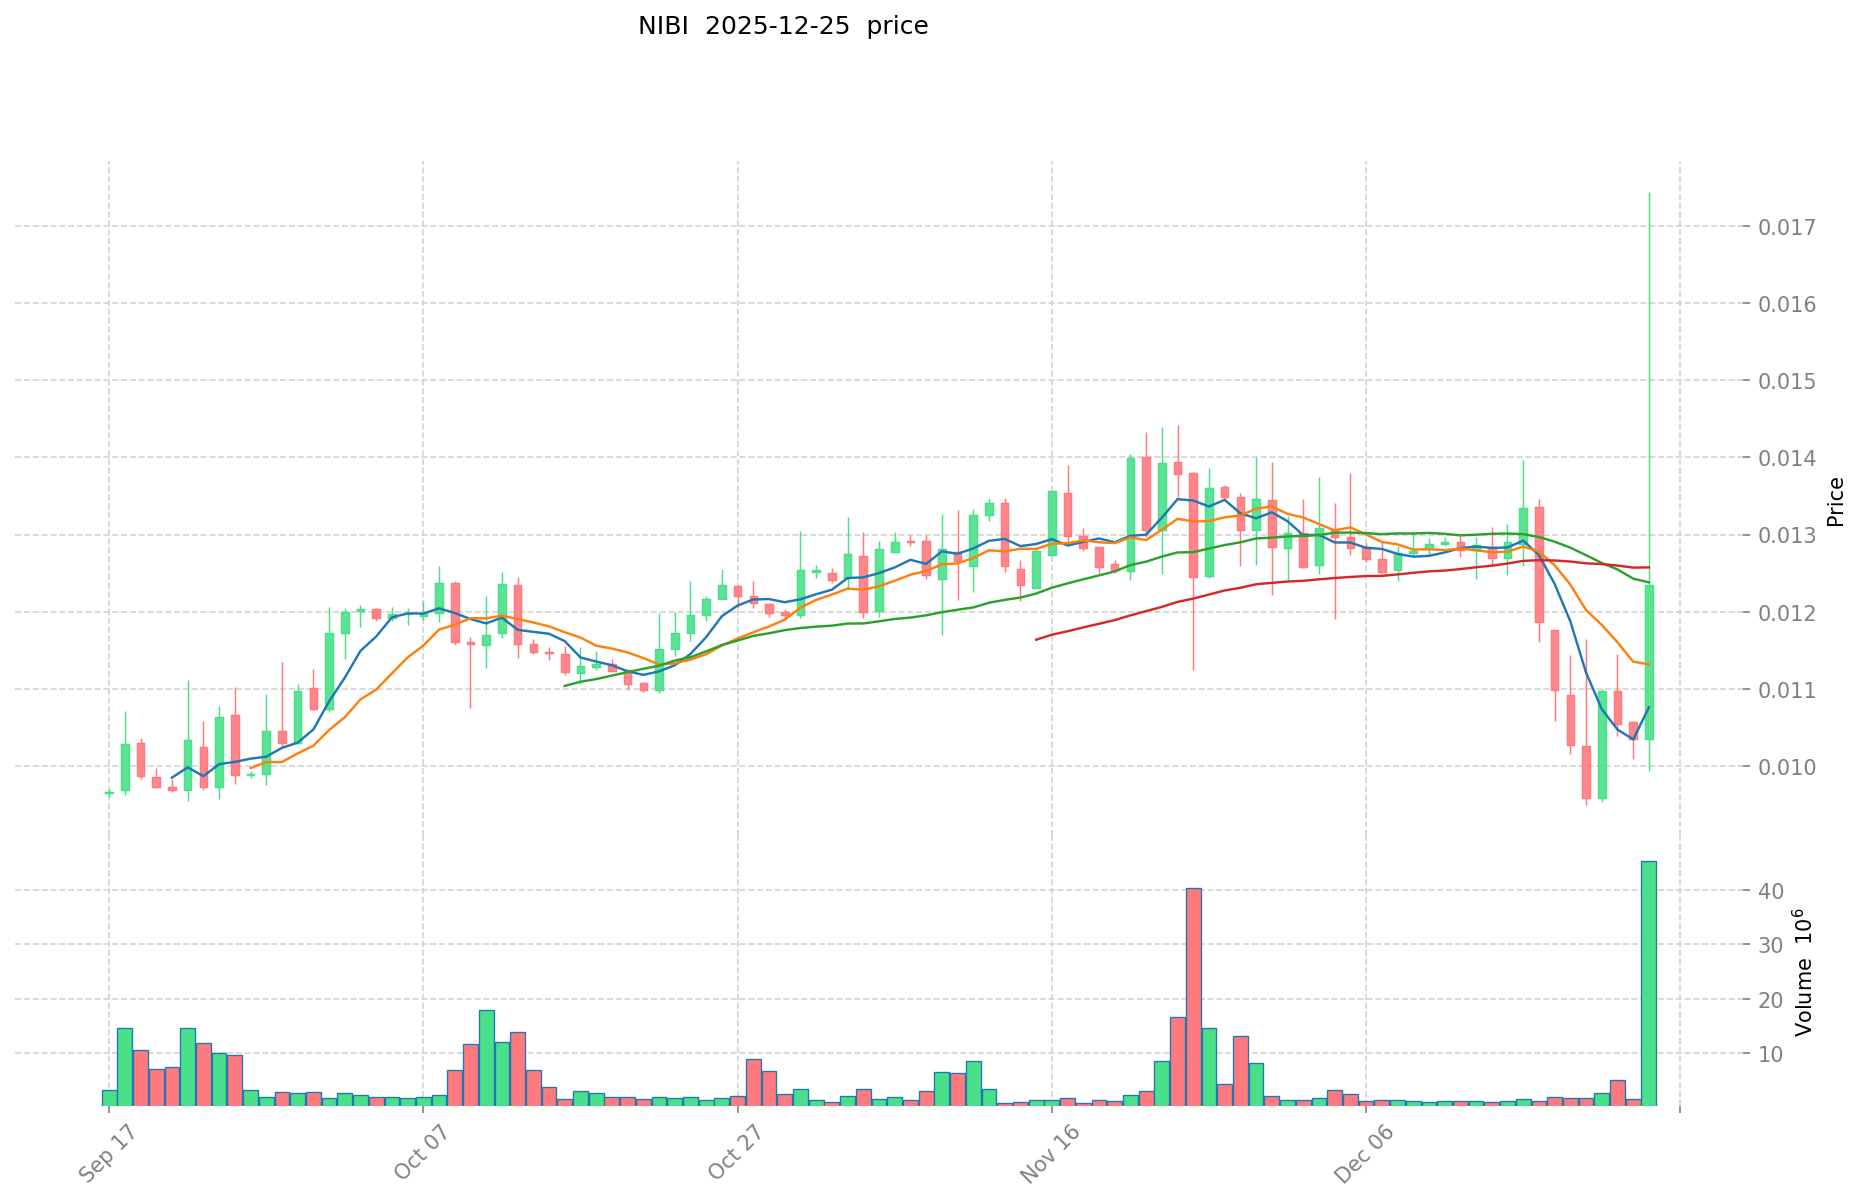
Based on available market data as of December 25, 2025:
| Period |
Price Level |
Key Metrics |
| All-Time High |
$1.032 |
Reached on March 12, 2024 |
| All-Time Low |
$0.008219 |
Reached on August 14, 2025 |
| Current Price |
$0.01289 |
As of December 25, 2025 |
Performance Analysis:
The asset has experienced significant volatility since its launch. From the all-time high of $1.032 in March 2024, the token declined substantially, reaching its lowest point of $0.008219 in August 2025. The current price of $0.01289 represents a recovery from the lows, though it remains significantly below historical peaks.
Annual Performance:
- One-year change: -77.23% (from the launch price of approximately $0.1 on March 12, 2024)
- 30-day change: -6.64%
- 7-day change: +9.48%
- 24-hour change: +20.68%
Current NIBI Market Status (December 25, 2025)
Price Metrics:
- Current price: $0.01289
- 24-hour high: $0.017443
- 24-hour low: $0.009936
- Market sentiment index: 0 (neutral)
Market Scale:
- 24-hour trading volume: $617,738.80
- Fully diluted valuation: $19,335,000
- Market capitalization (current): $2,406,496.56
- Circulating supply: 186,694,846 NIBI
- Total supply: 1,500,000,000 NIBI
- Circulating supply ratio: 12.45%
Market Position:
- Global ranking: #2,023
- Market dominance: 0.0006%
For real-time NIBI market price, visit Gate
II. Project Overview
Nibiru Chain is positioned as a breakthrough Layer 1 (L1) blockchain and smart contract ecosystem. The project aims to provide:
- Superior throughput capabilities
- Unparalleled security infrastructure
- Developer-friendly environment
- User-friendly smart contract platform for Web3 applications
The project targets establishing itself as one of the most accessible blockchain platforms for both developers and end-users within the Web3 ecosystem.
III. Token Distribution and Availability
| Parameter |
Value |
| Maximum Supply |
1,500,000,000 NIBI |
| Total Supply |
1,500,000,000 NIBI |
| Circulating Supply |
186,694,846 NIBI |
| Launch Price |
$0.1 |
| Circulating/Total Ratio |
12.45% |
Supply Analysis:
The token maintains a structured distribution model with circulating supply representing approximately 12.45% of total supply. This indicates a significant portion of tokens remain in the vesting or reserve phase, which may influence future price dynamics as additional tokens enter circulation.
IV. Market Volatility Assessment
Price Fluctuation Analysis
| Timeframe |
Change |
Status |
| 1 hour |
-0.75% |
Slight decline |
| 24 hours |
+20.68% |
Significant gain |
| 7 days |
+9.48% |
Positive trajectory |
| 30 days |
-6.64% |
Negative trend |
| 1 year |
-77.23% |
Substantial decline |
Volatility Observations:
The asset demonstrates substantial short-term volatility with a recent 24-hour gain of 20.68%, while maintaining negative performance over longer timeframes. The disparity between positive weekly performance (+9.48%) and negative monthly performance (-6.64%) suggests recent price recovery following a period of decline.
V. Disclaimer
This analysis is based on publicly available market data current as of December 25, 2025. The cryptocurrency market is subject to extreme volatility and rapid changes. Historical performance does not guarantee future results. This report is informational in nature and should not be construed as financial advice or investment recommendations. Investors should conduct independent research and consult with qualified financial professionals before making investment decisions.
Nibiru Chain (NIBI) Investment Analysis Report
Report Date: December 25, 2025
I. Executive Summary
Nibiru Chain is positioned as a Layer 1 blockchain and smart contract ecosystem designed to provide superior throughput and security. As of the report date, NIBI is trading at $0.01289 with a market capitalization of approximately $2.41 million (fully diluted valuation of $19.34 million). The token demonstrates mixed performance characteristics, with significant volatility and divergent market forecasts regarding its investment potential.
II. Core Factors Influencing NIBI as an Investment
Supply Mechanism and Scarcity
The NIBI token has a total supply and maximum supply of 1,500,000,000 tokens, with 186,694,846 tokens currently in circulation, representing approximately 12.45% of total supply. The circulating supply ratio indicates substantial room for token dilution as remaining tokens enter circulation. This supply structure presents both opportunities and risks for long-term holders, as increased token availability may exert downward pressure on price during the accumulation phase.
NIBI has experienced substantial price volatility since its launch on March 12, 2024 at $0.10. The token reached an all-time high of $1.032 on March 12, 2024, before declining significantly. As of December 25, 2025, the token trades 87.5% below its peak. Recent price movements show:
- 1-hour change: -0.75%
- 24-hour change: +20.68%
- 7-day change: +9.48%
- 30-day change: -6.64%
- 1-year change: -77.23%
The 24-hour trading volume of $617,738.80 suggests moderate liquidity relative to market capitalization. The token ranks 2,023 by market cap, positioning it among smaller-cap projects.
Market Sentiment and Technical Outlook
Multiple technical analysis sources indicate bullish forecasts based on quantitative indicators. However, price predictions vary significantly across different analysts:
- Some forecasts project potential gains of 35.02% by end of 2025 if targets are reached
- Conservative estimates suggest prices may reach approximately $0.042553 to $0.064302 by year-end 2025
- Long-term predictions show divergence, with some models projecting prices around $0.0189 (2025 maximum), while others forecast $0.1942
- Extended forecasts suggest potential prices of $6.88 by 2040, though such long-term predictions carry substantial uncertainty
III. Network and Ecosystem Development
Nibiru Chain positions itself as a developer-friendly and user-friendly smart contract platform within Web3. The project maintains active development infrastructure including:
- Official website and documentation
- Blockchain explorer
- Active social media presence on Twitter
The ecosystem development and adoption metrics remain critical factors for assessing long-term investment viability.
Historical Price Movement
The token's price trajectory reveals significant downside risk since launch, with the current price representing an 87.5% decline from all-time high levels. This substantial depreciation reflects either market repricing of the project's fundamentals or heightened risk perception among investors.
Market Position
With a market dominance of 0.00060% and minimal exchange listings (listed on one exchange), NIBI maintains limited market penetration compared to established cryptocurrencies. This restricted availability may impact liquidity and price discovery mechanisms.
V. Investment Considerations
Nibiru Chain presents characteristics of a speculative, early-stage cryptocurrency project. Investment decisions should consider:
- Volatility Risk: The project exhibits high price volatility, with significant drawdowns from peak valuations
- Liquidity Constraints: Limited exchange availability and modest trading volumes may restrict entry and exit opportunities
- Technology Adoption: Long-term value depends on ecosystem development and real-world application adoption
- Supply Dilution: Substantial unreleased token supply presents potential future price pressure
- Market Forecast Divergence: Wide variation in price predictions reflects high uncertainty about future trajectories
VI. Conclusion
Existing technical analysis indicates bullish short-term sentiment; however, this contrasts with the project's significant long-term price decline. NIBI remains a speculative investment suitable only for participants with high risk tolerance and conviction in Layer 1 blockchain development. Investors should conduct comprehensive due diligence on protocol development progress, ecosystem adoption metrics, and competitive positioning within the crowded Layer 1 blockchain landscape before making allocation decisions.
III. NIBI Future Investment Prediction and Price Outlook (Is Nibiru Chain (NIBI) worth investing in 2025-2030)
Short-term Investment Prediction (2025, short-term NIBI investment outlook)
- Conservative Forecast: $0.0076 - $0.0110
- Neutral Forecast: $0.0110 - $0.0138
- Optimistic Forecast: $0.0138 - $0.0160
Mid-term Investment Outlook (2026-2028, mid-term Nibiru Chain (NIBI) investment forecast)
- Market Stage Expectation: Nibiru Chain is transitioning from early-stage development to mainstream adoption phase, with gradual ecosystem expansion and developer adoption driving incremental value growth.
- Investment Return Projections:
- 2026: $0.0111 - $0.0162
- 2027: $0.0077 - $0.0218
- 2028: $0.0093 - $0.0200
- Key Catalysts: Ecosystem development progress, smart contract platform adoption among developers, DeFi protocol deployments on Nibiru, improvements in on-chain throughput and security features, and institutional interest in Layer 1 blockchain solutions.
Long-term Investment Outlook (Is Nibiru Chain a good long-term investment?)
- Base Case Scenario: $0.0195 - $0.0267 USD (2030, assuming steady ecosystem growth and moderate market adoption of Nibiru's smart contract platform)
- Optimistic Scenario: $0.0360 - $0.0665 USD (2035-2040, assuming significant increase in developer adoption, successful DeFi ecosystem expansion, and favorable regulatory environment)
- Risk Scenario: $0.0050 - $0.0120 USD (2030, under conditions of increased competition from established Layer 1 platforms, regulatory challenges, or failure to achieve meaningful ecosystem adoption)
For more information on NIBI long-term investment and price predictions: Price Prediction
2025-12-31 Long-term Outlook
- Base Case: $0.0194 - $0.0267 USD (Corresponding to steady progress in ecosystem development and incremental growth in smart contract platform adoption)
- Optimistic Case: $0.0360 - $0.0665 USD (Corresponding to widespread developer adoption, successful DeFi protocol integration, and favorable market conditions)
- Transformative Case: $0.1000 USD and above (If Nibiru achieves breakthrough ecosystem milestones and attains mainstream adoption comparable to established Layer 1 platforms)
- 2030 Year-End Peak Forecast: $0.0665 USD (Based on optimistic development trajectory and continued market expansion)
Disclaimer
This analysis is provided for informational purposes only and does not constitute investment advice or recommendations. Price predictions are based on historical data and market analysis but are subject to significant uncertainty. Cryptocurrency markets are highly volatile and influenced by numerous unpredictable factors. Past performance does not guarantee future results. Investors should conduct their own research and consult financial advisors before making investment decisions. This information should not be used as the sole basis for any investment decision.
| 年份 |
预测最高价 |
预测平均价格 |
预测最低价 |
涨跌幅 |
| 2025 |
0.01383726 |
0.012466 |
0.00760426 |
-3 |
| 2026 |
0.0161765049 |
0.01315163 |
0.0111788855 |
2 |
| 2027 |
0.0218494605005 |
0.01466406745 |
0.0077719557485 |
13 |
| 2028 |
0.020082440372775 |
0.01825676397525 |
0.009310949627377 |
41 |
| 2029 |
0.022236738521854 |
0.019169602174012 |
0.013418721521808 |
48 |
| 2030 |
0.026707089748834 |
0.020703170347933 |
0.019460980127057 |
60 |
Nibiru Chain (NIBI) Investment Analysis Report
I. Executive Summary
Nibiru Chain is a breakthrough Layer 1 blockchain and smart contract ecosystem designed to provide superior throughput and security. As of December 25, 2025, NIBI is trading at $0.01289 with a 24-hour volume of $617,738.80. The token demonstrates significant short-term volatility with a +20.68% gain over 24 hours but a -77.23% decline over the past year.
Key Metrics:
- Current Price: $0.01289
- Market Capitalization: $2,406,496.56
- Fully Diluted Valuation: $19,335,000
- Circulating Supply: 186,694,846 NIBI (12.45% of total supply)
- Market Ranking: #2023
Price Volatility Metrics
| Time Period |
Price Change |
Percentage Change |
| 1 Hour |
-$0.000097 |
-0.75% |
| 24 Hours |
+$0.00221 |
+20.68% |
| 7 Days |
+$0.00112 |
+9.48% |
| 30 Days |
-$0.00092 |
-6.64% |
| 1 Year |
-$0.04372 |
-77.23% |
Historical Price Extremes
- All-Time High: $1.032 (March 12, 2024)
- All-Time Low: $0.008219 (August 14, 2025)
- 24-Hour Range: $0.009936 - $0.017443
Analysis: NIBI exhibits extreme volatility characteristic of early-stage L1 blockchain projects. The token has depreciated significantly from its previous peak, currently trading at 98.75% below its all-time high. However, recent 24-hour and 7-day performance shows recovery momentum.
III. Fundamental Assessment
Project Overview
Nibiru Chain positions itself as a developer-friendly and user-friendly smart contract platform within the Web3 ecosystem. The project launched on March 12, 2024, at an initial price of $0.10.
Supply Dynamics
- Total Supply: 1,500,000,000 NIBI
- Circulating Supply: 186,694,846 NIBI
- Circulation Ratio: 12.45%
- Fully Diluted Valuation: $19,335,000
The significant gap between circulating and total supply suggests substantial future dilution potential, which may create downward pressure on token prices as additional tokens enter circulation.
Market Position
- Market Dominance: 0.0006%
- Market Cap to FDV Ratio: 12.45%
- Trading Venues: Available on major exchanges including Gate
IV. Investment Strategy and Risk Management
Investment Methodology
Long-Term Hold (HODL Strategy):
Suitable for conservative investors willing to endure high volatility. This approach assumes the underlying blockchain technology gains adoption and developer traction over time.
Active Trading:
Depends on technical analysis and momentum trading. The recent +20.68% 24-hour move indicates trading opportunities exist, though such volatility increases execution risk.
Risk Management Framework
Asset Allocation Guidelines:
- Conservative Investors: 1-3% portfolio allocation maximum
- Active Investors: 3-8% portfolio allocation
- Professional/Institutional: Strategic allocation based on fund mandates
Risk Mitigation Strategies:
- Portfolio Diversification: Combine with established cryptocurrencies (Bitcoin, Ethereum) and stablecoins
- Hedging Tools: Use stablecoin positions to reduce exposure during high volatility periods
- Position Sizing: Implement strict position limits to cap maximum loss per trade
Secure Storage Recommendations:
- Cold Storage: Hardware wallets (Ledger, Trezor) for long-term holdings
- Hot Wallets: Web3-compatible wallets for active trading and interaction with DeFi protocols
- Exchange Holdings: Minimize balances left on trading platforms
V. Investment Risks and Challenges
Market Risk
- High Volatility: 77.23% annual depreciation demonstrates extreme price fluctuation unsuitable for risk-averse investors
- Liquidity Risk: Relatively low 24-hour trading volume ($617,738.80) may result in significant slippage during large trades
- Price Manipulation: Low market cap increases susceptibility to coordinated trading activity
Regulatory Risk
Uncertainty surrounding cryptocurrency regulations across different jurisdictions poses potential downside risks to blockchain platforms. Regulatory clarity or restrictive policies could negatively impact adoption and tokenomics.
Technology Risk
- Network Security: Implementation vulnerabilities in smart contract infrastructure could lead to exploits
- Upgrade Execution: Failures during protocol upgrades may cause system instability
- Developer Adoption: Insufficient developer interest could hinder ecosystem growth
Token Economics Risk
The massive gap between circulating and total supply (12.45% ratio) creates significant dilution risk if vesting schedules release substantial token quantities.
VI. Conclusion: Is NIBI a Good Investment?
Investment Value Summary
Nibiru Chain presents a mixed investment profile. While the project addresses legitimate needs in the Web3 ecosystem through improved throughput and security, current market positioning reflects limited adoption and significant depreciation from launch valuations. The token's extreme volatility and small market capitalization indicate an early-stage, high-risk asset class.
Investor Recommendations
✅ Beginners:
- Consider dollar-cost averaging (DCA) with minimal capital allocation
- Prioritize secure cold storage solutions
- Allocate only disposable capital not needed for essential expenses
✅ Experienced Investors:
- Implement swing trading strategies around technical support/resistance levels
- Maintain diversified portfolio construction to reduce concentration risk
- Monitor development milestones and ecosystem adoption metrics
✅ Institutional Investors:
- Conduct comprehensive due diligence on development team and technical roadmap
- Evaluate long-term market share potential against competing L1 platforms
- Consider strategic positions aligned with multi-year blockchain adoption cycles
⚠️ Important Disclaimer
Cryptocurrency investments carry substantial risk, including potential total loss of capital. This analysis is provided for informational purposes only and does not constitute investment advice, financial recommendations, or solicitation to purchase. Investors should conduct independent research, consult qualified financial advisors, and fully understand the risks before making investment decisions. Past performance does not guarantee future results.
Report Generated: December 25, 2025
Data Source: Gate Market Data
Disclaimer: This report reflects market conditions as of the publication date and should not be relied upon as current market analysis beyond that date.
Nibiru Chain (NIBI) Frequently Asked Questions
I. FAQ
Q1: What is Nibiru Chain (NIBI) and what problem does it solve?
A: Nibiru Chain is a Layer 1 blockchain and smart contract ecosystem designed to provide superior throughput and security. The project positions itself as a breakthrough platform aimed at becoming the most developer-friendly and user-friendly smart contract platform in Web3. It addresses the need for improved scalability, performance, and accessibility in blockchain technology compared to existing Layer 1 solutions.
Q2: What is the current price of NIBI and how has it performed historically?
A: As of December 25, 2025, NIBI is trading at $0.01289. Historically, the token reached an all-time high of $1.032 on March 12, 2024, and a low of $0.008219 on August 14, 2025. Over the past year, NIBI has declined 77.23% from its launch price. Recent short-term performance shows positive momentum with a +20.68% gain over 24 hours and +9.48% over 7 days.
Q3: What is the token supply structure and what does it mean for future price dynamics?
A: NIBI has a maximum total supply of 1,500,000,000 tokens, with approximately 186.69 million currently in circulation (12.45% of total supply). The significant gap between circulating and total supply indicates substantial unreleased tokens in vesting or reserve phases. This creates potential dilution risk, as additional token releases may exert downward pressure on prices as more tokens enter circulation over time.
Q4: Is NIBI a good investment for different types of investors?
A: NIBI suitability depends on risk tolerance. Conservative investors should limit allocation to 1-3% of portfolio with long-term holding strategies. Active traders may consider 3-8% allocation using technical analysis approaches. The asset is unsuitable for risk-averse investors due to extreme volatility. Institutional investors should evaluate development milestones and competitive positioning against established Layer 1 platforms before making strategic allocations.
Q5: What are the main risks associated with investing in NIBI?
A: Key risks include market volatility (77% annual decline), liquidity constraints (low 24-hour trading volume), regulatory uncertainty surrounding cryptocurrencies, technology implementation risks including smart contract vulnerabilities, and significant token dilution risk from unreleased supply. Additionally, NIBI faces competition from established Layer 1 platforms and depends on achieving meaningful developer adoption for long-term success.
Q6: What are the price predictions for NIBI through 2030?
A: Price forecasts vary based on scenarios. Conservative 2025 estimates range $0.0076-$0.0110. Base case 2030 projections suggest $0.0195-$0.0267. Optimistic scenarios project $0.0360-$0.0665 for 2035-2040, assuming significant developer adoption and DeFi ecosystem expansion. Risk scenarios estimate $0.0050-$0.0120 if competition or adoption challenges materialize. Long-term predictions carry substantial uncertainty and should not be relied upon as certainties.
Q7: How should investors secure and manage NIBI holdings?
A: For long-term holdings, use cold storage solutions such as hardware wallets (Ledger, Trezor) to maximize security. For active trading, employ Web3-compatible hot wallets. Minimize balances left on trading exchanges to reduce counterparty risk. Implement strict position sizing limits to cap maximum potential losses per trade. Diversify holdings across established cryptocurrencies, stablecoins, and other assets to reduce concentration risk.
Q8: Where can I trade NIBI and what liquidity considerations should I understand?
A: NIBI is available on major exchanges including Gate. The 24-hour trading volume of approximately $617,738 indicates moderate liquidity. Investors should be aware that low trading volume relative to market capitalization may result in significant slippage during large trades. Limited exchange availability increases the importance of maintaining adequate liquidity planning for entry and exit strategies. Always verify current exchange listings and trading pairs before executing trades.
Disclaimer: This FAQ is informational in nature and does not constitute investment advice, financial recommendations, or solicitation to invest. Cryptocurrency investments carry substantial risk, including potential total loss of capital. Investors should conduct independent research, consult qualified financial professionals, and fully understand associated risks before making investment decisions. Past performance does not guarantee future results.
* The information is not intended to be and does not constitute financial advice or any other recommendation of any sort offered or endorsed by Gate.