This comprehensive article compares ONT and DOT, two leading Layer-1 blockchain platforms with distinct architectures and investment profiles. Ontology (ONT) functions as a distributed trust collaboration platform supporting smart contracts and distributed ledgers, while Polkadot (DOT) operates as a multi-chain interoperability protocol connecting diverse blockchains through its relay chain and parachain ecosystem. The analysis examines historical price trends revealing ONT's decline from $10.92 to $0.06607 and DOT's volatility from $54.98 to $2.157, alongside comparative trading volumes and market sentiment. Core investment factors evaluated include tokenomics and staking mechanisms, technological development, ecosystem maturity, and macroeconomic influences. Price forecasts project ONT reaching $0.1401 by 2031 (75% growth) and DOT reaching $4.14 (65% growth), with tailored investment strategies for conservative, aggressive, and institutional investors. The article provides risk assessments covering market,
Introduction: Investment Comparison Between ONT and DOT
In the cryptocurrency market, the comparison of ONT vs DOT remains a topic of keen interest among investors. These two assets demonstrate notable differences in market cap ranking, application scenarios, and price performance, representing distinct positioning within the crypto asset landscape.
Ontology (ONT): Launched in 2018, it has gained market recognition as a next-generation public infrastructure chain project and distributed trust collaboration platform, supporting complete distributed ledger and smart contract systems.
Polkadot (DOT): Since its inception in 2019, it has been positioned as a multi-chain interoperability protocol, connecting private chains, consortium chains, public chains, and oracles to facilitate trustless information and transaction exchange across independent blockchains.
This article will provide a comprehensive analysis of the investment value comparison between ONT vs DOT through examining historical price trends, supply mechanisms, institutional adoption, technological ecosystems, and future forecasts, attempting to answer the question that concerns investors most:
"Which is the better buy right now?"
I. Historical Price Comparison and Current Market Status
Ontology (ONT) and Polkadot (DOT) Historical Price Trends
- 2018: Ontology (ONT) reached a price level of $10.92 on May 3, 2018, marking a notable period in its early trading history.
- 2020: Polkadot (DOT) launched with an initial trading price of approximately $2.49 in August 2020, establishing its presence in the blockchain ecosystem.
- 2021: Polkadot (DOT) experienced price movement to $54.98 on November 4, 2021, reflecting increased market attention during that period.
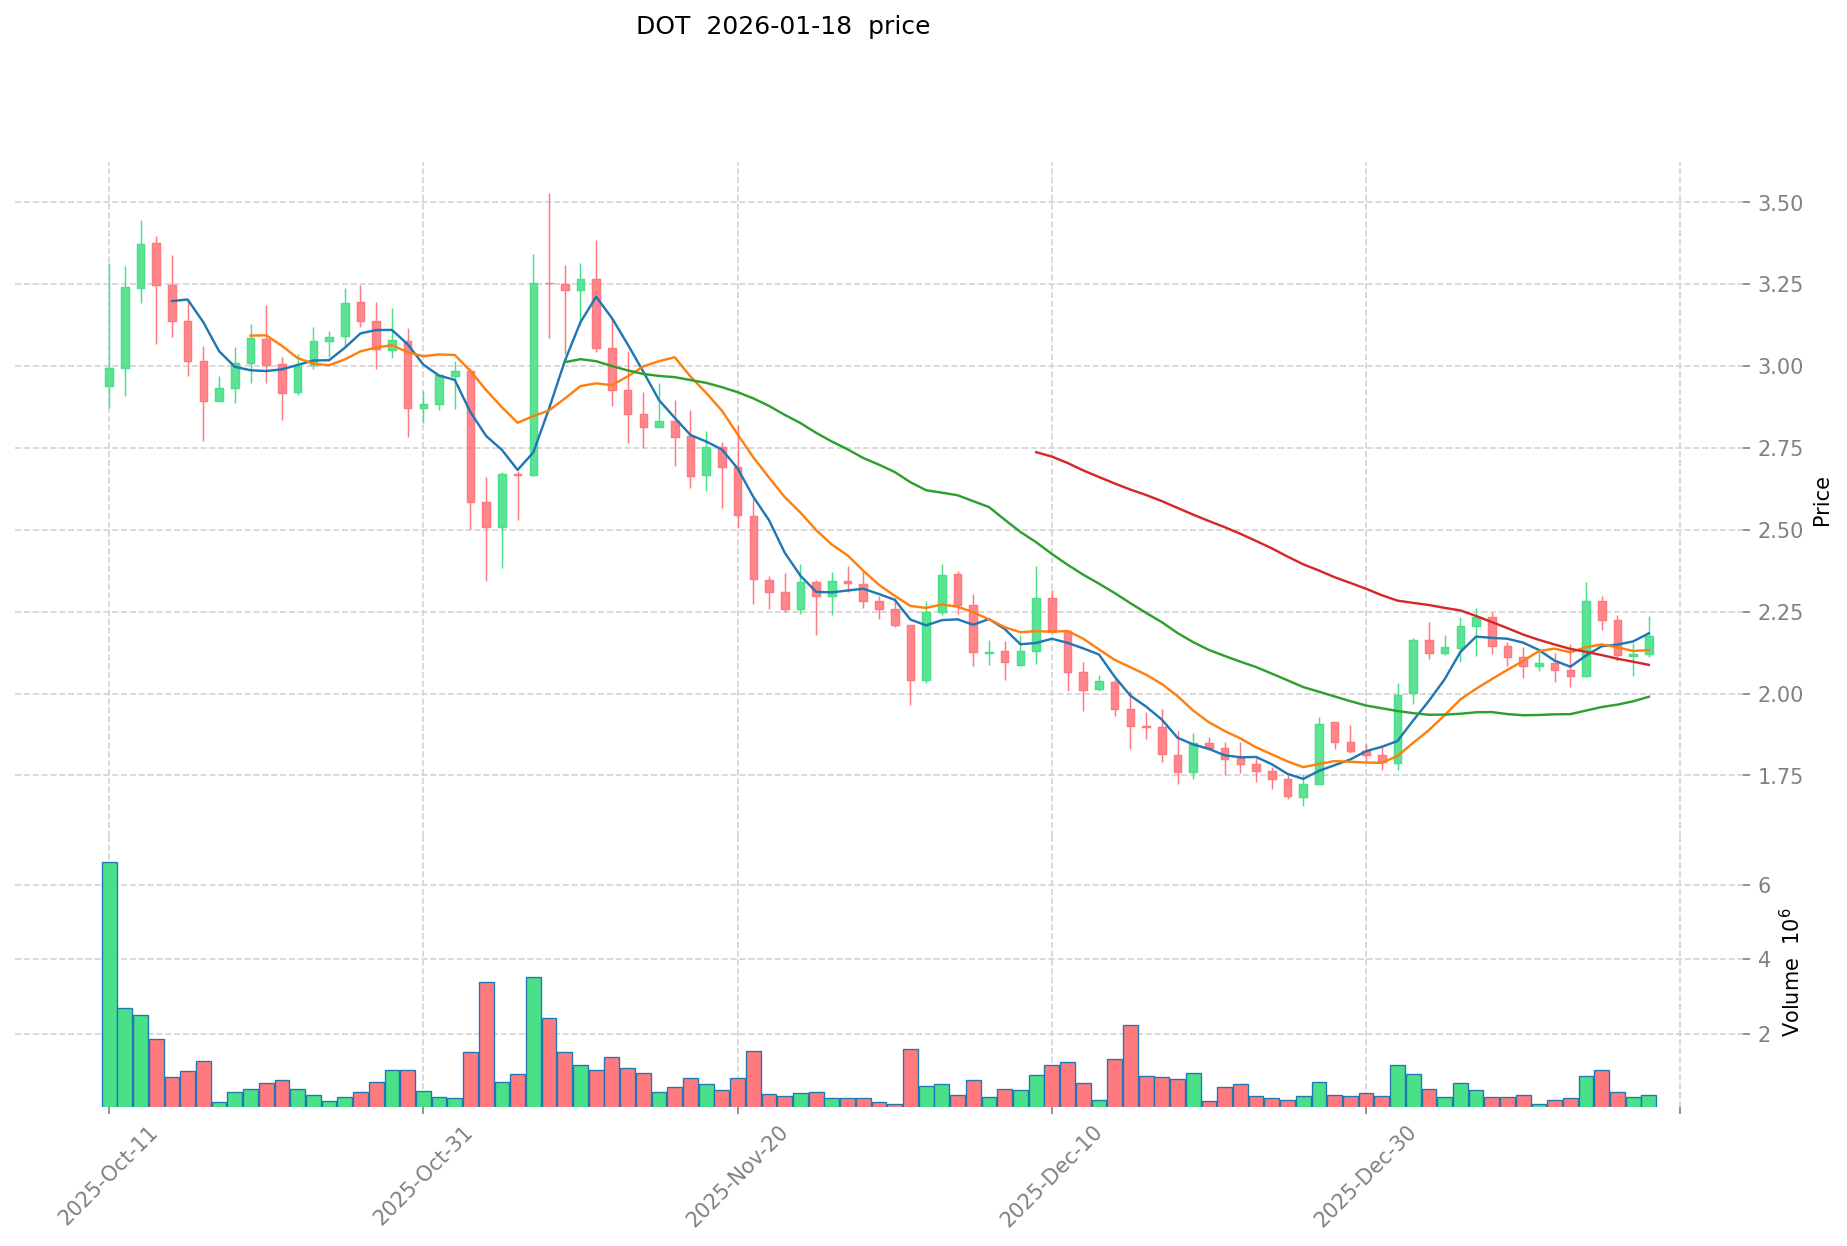
- 2025: Both assets experienced price fluctuations, with Ontology (ONT) trading at $0.051747 on December 19, 2025, and Polkadot (DOT) at $1.66 on December 26, 2025.
- Comparative Analysis: During market cycles, ONT has shown price movement from $10.92 to $0.051747, while DOT has exhibited fluctuation from $54.98 to $1.66.
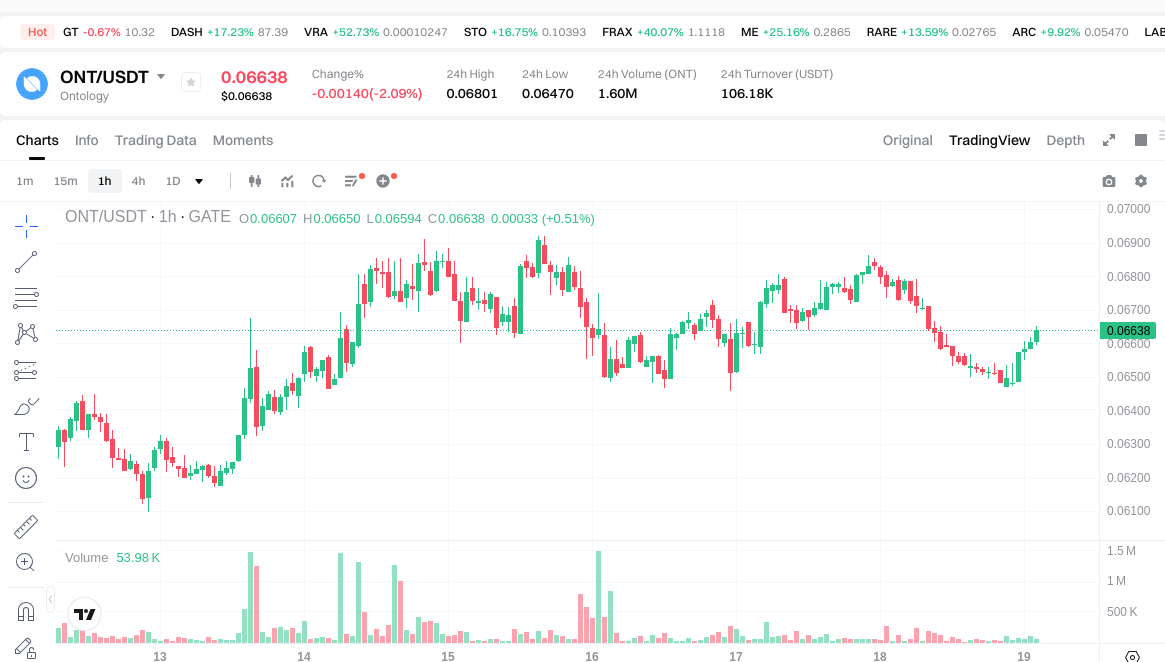
Current Market Status (January 19, 2026)
- ONT current price: $0.06607
- DOT current price: $2.157
- 24-hour trading volume: ONT $104,404.13 vs DOT $492,300.68
- Market sentiment index (Fear & Greed Index): 49 (Neutral)
View real-time prices:
II. Core Factors Influencing ONT vs DOT Investment Value
Supply Mechanism Comparison (Tokenomics)
- ONT: The materials do not provide specific details about Ontology's supply mechanism or tokenomics structure.
- DOT: Polkadot employs a Nominated Proof-of-Stake (NPoS) consensus mechanism where validators stake DOT tokens as collateral to validate transactions and add new blocks to the relay chain. Nominators can stake their DOT to support validators, contributing to network security and earning rewards.
- 📌 Historical Pattern: Staking dynamics significantly influence supply availability. When substantial amounts of DOT are staked, circulating supply decreases, potentially creating upward price pressure if demand remains stable or increases. Conversely, large-scale unstaking increases circulating supply, which may lead to price declines if demand does not correspondingly grow.
Institutional Adoption and Market Applications
- Institutional Holdings: The provided materials do not contain specific information comparing institutional preferences between ONT and DOT.
- Enterprise Adoption: No detailed information is available regarding the comparative application of ONT or DOT in cross-border payments, settlements, or investment portfolios.
- National Policies: The materials do not provide specific information about different countries' regulatory attitudes toward these two assets.
Technological Development and Ecosystem Building
- ONT Technology: The investment potential of Ontology depends on its technological capabilities and market performance, though specific upgrade details are not provided in the materials.
- DOT Technology: Polkadot features a unique architecture comprising a central relay chain and multiple parachains. The relay chain provides shared security and consensus, while parachains operate as independent blockchains capable of parallel transaction processing and smart contract execution. This design enables scalability and cross-chain interoperability. Successful implementation of network upgrades, such as new parachain launches and interoperability improvements, may enhance confidence and increase DOT demand. However, upgrade delays or technical issues could create uncertainty and trigger price declines.
- Ecosystem Comparison: The materials indicate DOT maintained a position among the top cryptocurrencies by market capitalization, ranking within the top 15 on platforms like CoinMarketCap as of October 2024. Specific comparative information about DeFi, NFT, payment systems, and smart contract implementations for both projects is not available.
Macroeconomic Environment and Market Cycles
- Performance in Inflationary Environments: The materials do not contain specific information comparing the inflation-hedging properties of ONT versus DOT.
- Macroeconomic Monetary Policy: No specific analysis is provided regarding how interest rates or the US Dollar Index affect these two assets differently.
- Geopolitical Factors: The materials do not discuss cross-border transaction demand or international situations as they relate to ONT and DOT specifically.
III. 2026-2031 Price Forecast: ONT vs DOT
Short-term Forecast (2026)
- ONT: Conservative $0.0578 - $0.0664 | Optimistic $0.0664 - $0.0883
- DOT: Conservative $1.79 - $2.16 | Optimistic $2.16 - $2.29
Mid-term Forecast (2028-2029)
- ONT may enter a gradual growth phase, with projected price range of $0.0519 - $0.1149
- DOT may enter a volatility adjustment phase, with projected price range of $1.23 - $3.38
- Key drivers: institutional capital inflows, ETF developments, ecosystem expansion
Long-term Forecast (2030-2031)
- ONT: Baseline scenario $0.1003 - $0.1158 | Optimistic scenario $0.1282 - $0.1401
- DOT: Baseline scenario $1.95 - $3.57 | Optimistic scenario $4.07 - $4.14
View detailed price predictions for ONT and DOT
Disclaimer: Price predictions are based on historical data analysis and market trends. Cryptocurrency markets are highly volatile and subject to various risk factors. These forecasts do not constitute investment advice, and actual prices may differ significantly from projections.
ONT:
| Year |
Predicted High Price |
Predicted Average Price |
Predicted Low Price |
Price Change |
| 2026 |
0.088312 |
0.0664 |
0.057768 |
0 |
| 2027 |
0.0928272 |
0.077356 |
0.06111124 |
17 |
| 2028 |
0.098706256 |
0.0850916 |
0.051905876 |
28 |
| 2029 |
0.11487366 |
0.091898928 |
0.07076217456 |
39 |
| 2030 |
0.12819900456 |
0.103386294 |
0.10028470518 |
56 |
| 2031 |
0.1401091056288 |
0.11579264928 |
0.110003016816 |
75 |
DOT:
| Year |
Predicted High Price |
Predicted Average Price |
Predicted Low Price |
Price Change |
| 2026 |
2.2896 |
2.16 |
1.7928 |
0 |
| 2027 |
2.603016 |
2.2248 |
1.490616 |
3 |
| 2028 |
3.3794712 |
2.413908 |
1.23109308 |
11 |
| 2029 |
3.099457872 |
2.8966896 |
2.809788912 |
34 |
| 2030 |
4.13734175568 |
2.998073736 |
1.9487479284 |
38 |
| 2031 |
4.0671868302576 |
3.56770774584 |
2.854166196672 |
65 |
IV. Investment Strategy Comparison: ONT vs DOT
Long-term vs Short-term Investment Strategies
-
ONT: May suit investors focused on distributed trust infrastructure and long-term ecosystem development potential. The projected price range from $0.0664 in 2026 to $0.1401 by 2031 suggests a gradual appreciation trajectory, which may align with patient, long-term holding strategies.
-
DOT: May appeal to investors interested in multi-chain interoperability technology and parachain ecosystem expansion. The forecast indicating price movement from $2.16 in 2026 to potentially $4.14 by 2031 suggests consideration for both medium and long-term positioning, particularly for those monitoring cross-chain technology adoption.
Risk Management and Asset Allocation
-
Conservative Investors: A balanced allocation approach such as ONT 30% vs DOT 70% may be considered, reflecting DOT's comparatively larger market presence and trading volume ($492,300.68 vs $104,404.13 as of January 19, 2026).
-
Aggressive Investors: A more exploratory allocation such as ONT 45% vs DOT 55% might be examined by those seeking higher risk-reward profiles, given ONT's lower price point and potential percentage gain scenarios.
-
Hedging Tools: Portfolio risk management may incorporate stablecoin allocations for liquidity preservation, options strategies for downside protection, and cross-asset combinations to diversify blockchain technology exposure.
V. Potential Risk Comparison
Market Risk
-
ONT: Price volatility remains a consideration, with the asset having experienced significant price movement from previous levels. The current 24-hour trading volume of $104,404.13 indicates relatively lower liquidity compared to larger market cap assets, which may amplify price fluctuations during periods of market stress.
-
DOT: Market cycles present ongoing considerations, as evidenced by price fluctuations observed in historical data. The Nominated Proof-of-Stake mechanism creates dynamics where large-scale staking or unstaking events may influence circulating supply and price movements. Current market sentiment (Fear & Greed Index: 49 - Neutral) reflects an environment of uncertainty.
Technical Risk
-
ONT: Considerations include the ongoing development and adoption of its distributed trust collaboration platform. Network stability and the successful implementation of technological upgrades remain factors for monitoring.
-
DOT: The relay chain and parachain architecture presents technical complexity. Successful parachain launches and cross-chain interoperability implementations are important factors. Potential delays in network upgrades or technical issues could create uncertainty. The parallel processing design requires continuous security auditing and maintenance.
Regulatory Risk
Global regulatory frameworks for blockchain assets continue to evolve, with different jurisdictions taking varied approaches to cryptocurrency oversight. Both ONT and DOT, as infrastructure-focused blockchain projects, may face scrutiny regarding their operational models, token distribution mechanisms, and cross-border transaction capabilities. Changes in regulatory policies could affect market access, exchange listings, and institutional participation for both assets.
VI. Conclusion: Which Is the Better Buy?
📌 Investment Value Summary:
-
ONT Characteristics: Positioned as a distributed trust collaboration platform with complete distributed ledger and smart contract systems. The forecasted price trajectory suggests potential for gradual appreciation from $0.0664 (2026) to $0.1401 (2031), representing a projected increase of 75% over the period. Current trading volume indicates a more specialized market presence.
-
DOT Characteristics: Functions as a multi-chain interoperability protocol with an established parachain ecosystem and Nominated Proof-of-Stake consensus mechanism. Market positioning within the top 15 cryptocurrencies by market capitalization reflects broader market recognition. Price projections suggest movement from $2.16 (2026) to potentially $4.14 (2031), indicating a projected increase of 65% in the optimistic scenario.
✅ Investment Considerations:
-
New Investors: May consider starting with smaller position sizes in either asset while developing understanding of blockchain infrastructure technology, market dynamics, and risk management principles. Emphasis on research and gradual exposure building is advisable.
-
Experienced Investors: Could evaluate allocation strategies based on portfolio diversification goals, risk tolerance, and views on distributed trust infrastructure versus multi-chain interoperability technology. Technical analysis of network development milestones and ecosystem growth metrics may inform position sizing decisions.
-
Institutional Investors: May assess both assets within broader blockchain infrastructure allocation frameworks, considering factors such as liquidity profiles, regulatory clarity, technology maturity, and ecosystem development trajectories. Due diligence on governance mechanisms, token economics, and long-term sustainability is recommended.
⚠️ Risk Disclosure: Cryptocurrency markets exhibit significant volatility and are subject to various risk factors including market, technical, regulatory, and liquidity risks. This analysis does not constitute investment advice, financial recommendation, or guarantee of future performance. Actual prices may differ substantially from projections. Investors should conduct independent research and consult qualified financial advisors before making investment decisions.
VII. FAQ
Q1: What are the main technological differences between ONT and DOT?
Ontology (ONT) operates as a distributed trust collaboration platform with complete distributed ledger and smart contract systems, while Polkadot (DOT) functions as a multi-chain interoperability protocol featuring a relay chain architecture with multiple parachains. The key distinction lies in their architectural approaches: ONT focuses on trust infrastructure and identity verification systems, whereas DOT emphasizes cross-chain communication through its relay chain that provides shared security and consensus. DOT's parachain model enables parallel transaction processing across independent blockchains, while ONT concentrates on building a comprehensive trust ecosystem for enterprise applications.
Q2: Which asset has better liquidity for trading purposes?
Polkadot (DOT) demonstrates significantly higher trading liquidity compared to Ontology (ONT). As of January 19, 2026, DOT's 24-hour trading volume reached $492,300.68, nearly 4.7 times higher than ONT's $104,404.13. Additionally, DOT maintains a position within the top 15 cryptocurrencies by market capitalization on platforms like CoinMarketCap, indicating broader market participation and easier entry/exit opportunities. This higher liquidity typically results in tighter bid-ask spreads and reduced slippage for larger transactions, making DOT more suitable for traders requiring frequent position adjustments.
Q3: How do the supply mechanisms of ONT and DOT affect their price dynamics?
Polkadot employs a Nominated Proof-of-Stake (NPoS) consensus mechanism where token holders stake DOT to support validators, directly impacting circulating supply. When substantial amounts of DOT are staked, circulating supply decreases, potentially creating upward price pressure if demand remains constant. Conversely, large-scale unstaking increases available supply, which may lead to price declines. The staking rewards system incentivizes long-term holding, reducing selling pressure during stable market conditions. While specific tokenomics details for ONT are not extensively documented in available materials, understanding these supply dynamics is crucial for predicting price movements in both assets.
Q4: What is the projected long-term growth potential for ONT versus DOT?
Based on price forecasts through 2031, ONT projects a potential increase from $0.0664 (2026) to $0.1401 (2031), representing approximately 75% growth in the optimistic scenario. DOT forecasts suggest movement from $2.16 (2026) to potentially $4.14 (2031), indicating approximately 65% growth in the optimistic case. However, these projections are based on historical data and market trend analysis. Actual performance depends on numerous factors including technological development, ecosystem expansion, regulatory changes, and overall market conditions. Cryptocurrency markets exhibit high volatility, and projected growth rates should not be interpreted as guaranteed returns.
Q5: What allocation strategy should different investor types consider for ONT vs DOT?
Conservative investors may consider a weighted allocation favoring DOT (30% ONT vs 70% DOT), reflecting DOT's larger market presence, higher liquidity, and established ecosystem. This approach prioritizes stability and market-proven technology. Aggressive investors seeking higher risk-reward profiles might explore a more balanced allocation (45% ONT vs 55% DOT), capturing potential upside from ONT's lower price point while maintaining substantial DOT exposure. Risk management should incorporate stablecoin allocations for liquidity preservation, position sizing based on portfolio volatility tolerance, and regular rebalancing aligned with market developments and personal financial objectives.
Q6: What are the primary risk factors investors should monitor for both assets?
Market risk includes price volatility influenced by overall cryptocurrency market cycles and sentiment shifts. For ONT, lower trading volume ($104,404.13) may amplify price fluctuations during market stress. For DOT, large-scale staking or unstaking events can significantly affect circulating supply and prices. Technical risk encompasses network stability, upgrade implementation success, and ecosystem development progress. DOT's complex relay chain and parachain architecture requires continuous security auditing, while ONT's distributed trust platform depends on successful adoption and integration. Regulatory risk affects both assets as global frameworks evolve, potentially impacting exchange listings, institutional participation, and cross-border transaction capabilities.
Q7: How should new investors approach entering positions in ONT or DOT?
New investors should begin with smaller position sizes while developing understanding of blockchain infrastructure technology, market dynamics, and risk management principles. Starting with an allocation representing no more than 1-3% of total investment capital allows for learning without excessive exposure. Gradual position building through dollar-cost averaging helps mitigate timing risk and reduces the impact of short-term volatility. Before investing, conduct thorough research on each project's technology, team, roadmap, and competitive positioning. Utilize secure storage solutions such as hardware wallets for long-term holdings, and only invest capital that can be risked without affecting essential financial obligations.
Q8: What market conditions favor ONT versus DOT performance?
DOT typically demonstrates stronger performance during periods of increased focus on cross-chain interoperability, parachain ecosystem expansion, and enterprise blockchain adoption. Its established market position and higher liquidity make it more responsive to institutional capital inflows and positive sentiment toward multi-chain infrastructure. ONT may benefit from growth in distributed identity verification systems, enterprise trust solutions, and regulatory developments favoring privacy-focused blockchain infrastructure. Both assets generally perform better during broader cryptocurrency market uptrends with neutral to positive sentiment (Fear & Greed Index above 50), while experiencing correlated downside during market-wide corrections or risk-off environments.
* The information is not intended to be and does not constitute financial advice or any other recommendation of any sort offered or endorsed by Gate.