This comprehensive guide compares OP and LINK, two leading blockchain infrastructure assets in the Ethereum ecosystem. OP functions as a Layer 2 scaling solution reducing transaction costs through Rollup technology, while LINK operates as a decentralized oracle network providing real-world data connectivity to smart contracts. The analysis covers historical price trends, tokenomics, technical ecosystems, and institutional adoption patterns to help investors make informed decisions. Current market data shows OP at $0.3621 and LINK at $14.089, with distinct risk-return profiles suited to different investor types. Whether you're a beginner or experienced investor, this article provides actionable investment strategies, price forecasts through 2031, and detailed risk assessments to determine which asset better aligns with your portfolio objectives on Gate exchange.
Introduction: OP vs LINK Investment Comparison
In the cryptocurrency market, the comparison between OP and LINK has consistently been a topic investors cannot overlook. The two differ significantly in market cap ranking, application scenarios, and price performance, representing distinct crypto asset positioning.
Optimism (OP): Since its launch in 2022, it has gained market recognition as a low-cost, high-speed Ethereum Layer 2 blockchain solution addressing scalability challenges.
ChainLink (LINK): Since its introduction in 2017, it has been recognized as a decentralized oracle network, becoming one of the widely adopted infrastructure tokens in the blockchain ecosystem.
This article will comprehensively analyze the investment value comparison between OP and LINK from perspectives including historical price trends, supply mechanisms, institutional adoption, technical ecosystems, and future predictions, attempting to address the question investors care about most:
"Which is the better buy right now?"
I. Historical Price Comparison and Market Status
Historical Price Trends of OP (Coin A) and LINK (Coin B)
- 2024: OP reached a price peak of $4.84 on March 6, 2024, driven by market momentum during that period.
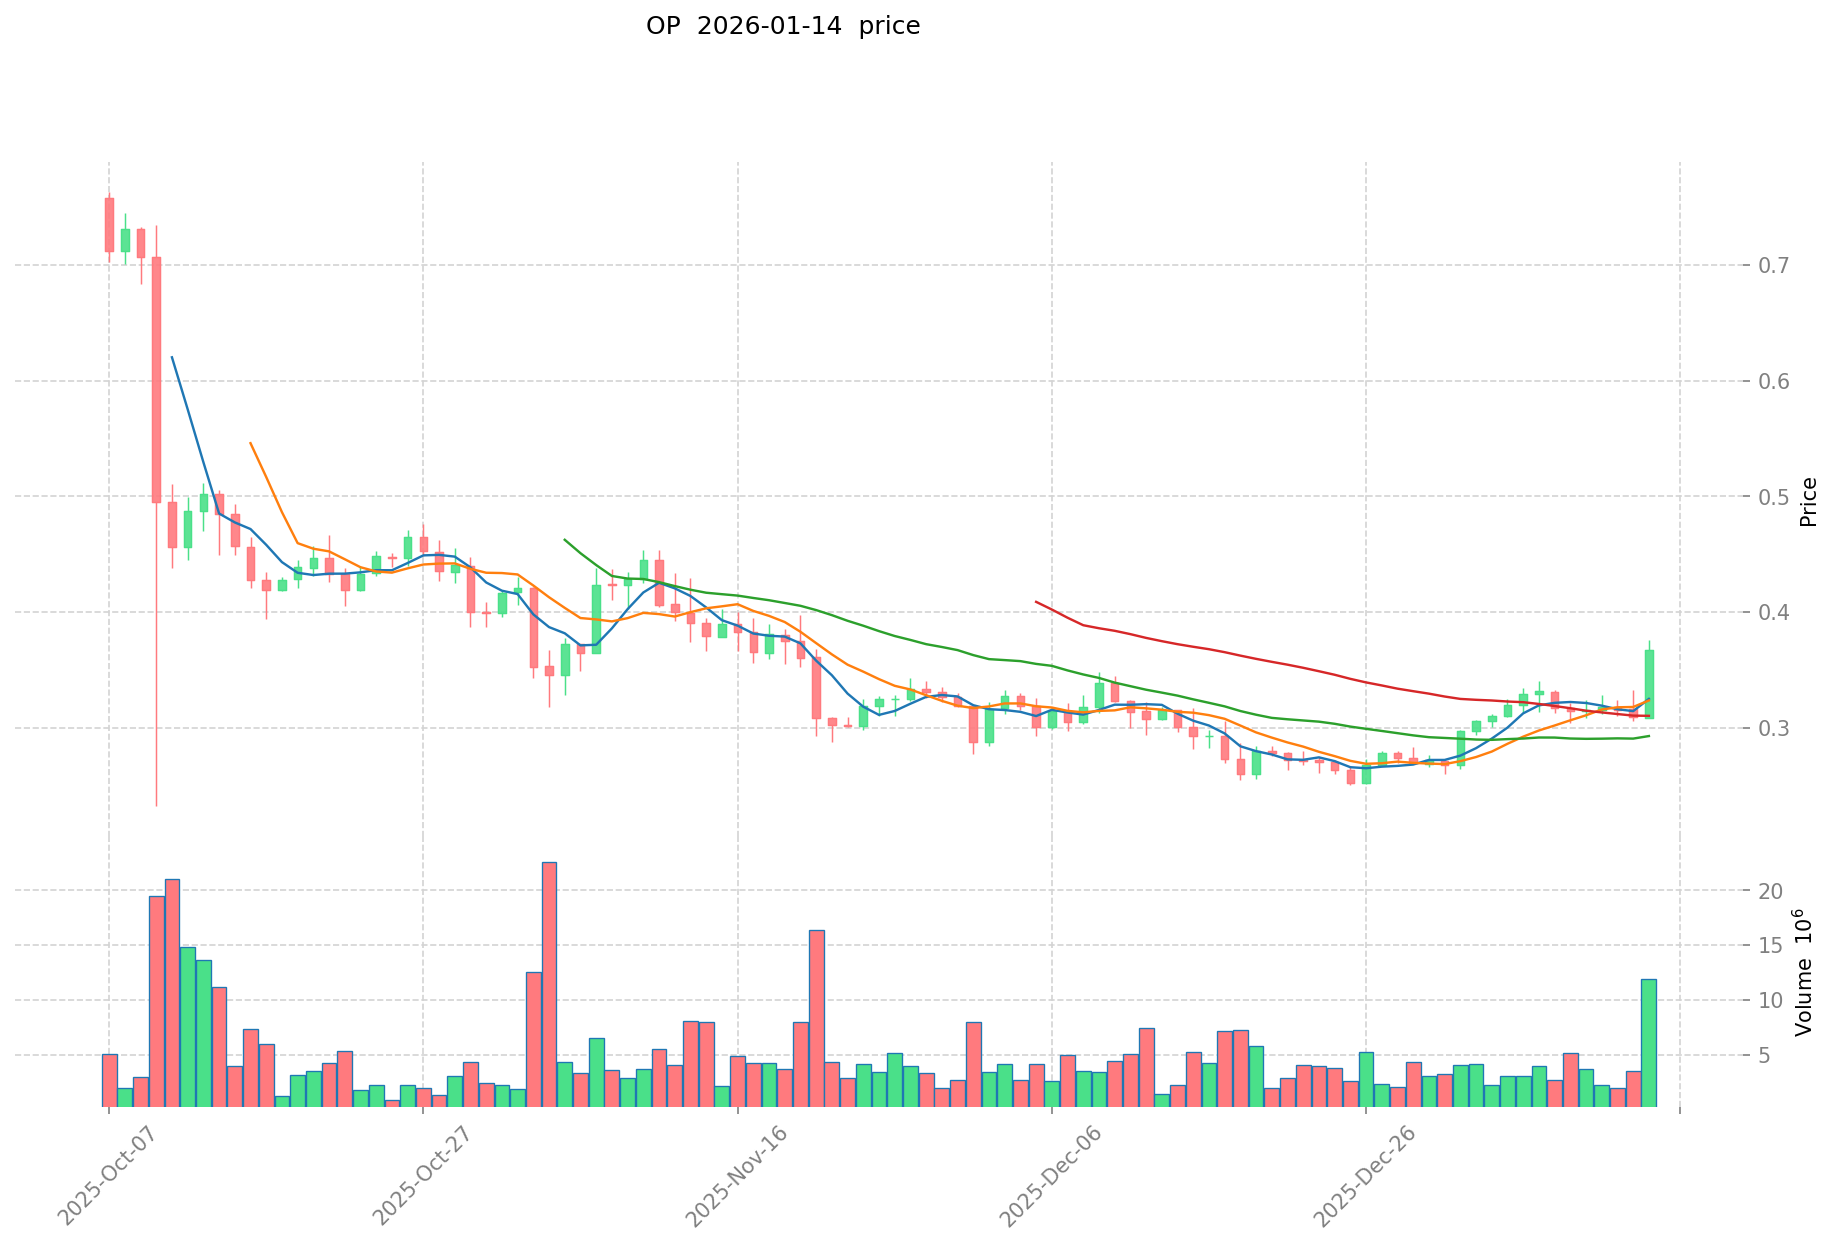
- 2025: OP experienced a significant decline, dropping to a historical low of $0.251922 on December 26, 2025, reflecting broader market corrections.
- 2021: LINK achieved an all-time high of $52.7 on May 10, 2021, supported by increased adoption of decentralized oracle networks.
- 2017: LINK launched with an initial price of $0.091429 and recorded its historical low of $0.148183 on November 29, 2017.
- Comparative Analysis: During recent market cycles, OP declined from its high of $4.84 to its low of $0.251922, representing an approximate 94.8% decrease. Meanwhile, LINK dropped from its peak of $52.7 to current levels around $14.089, showing an approximate 73.3% decline from its all-time high.
Current Market Status (2026-01-14)
- OP Current Price: $0.3621
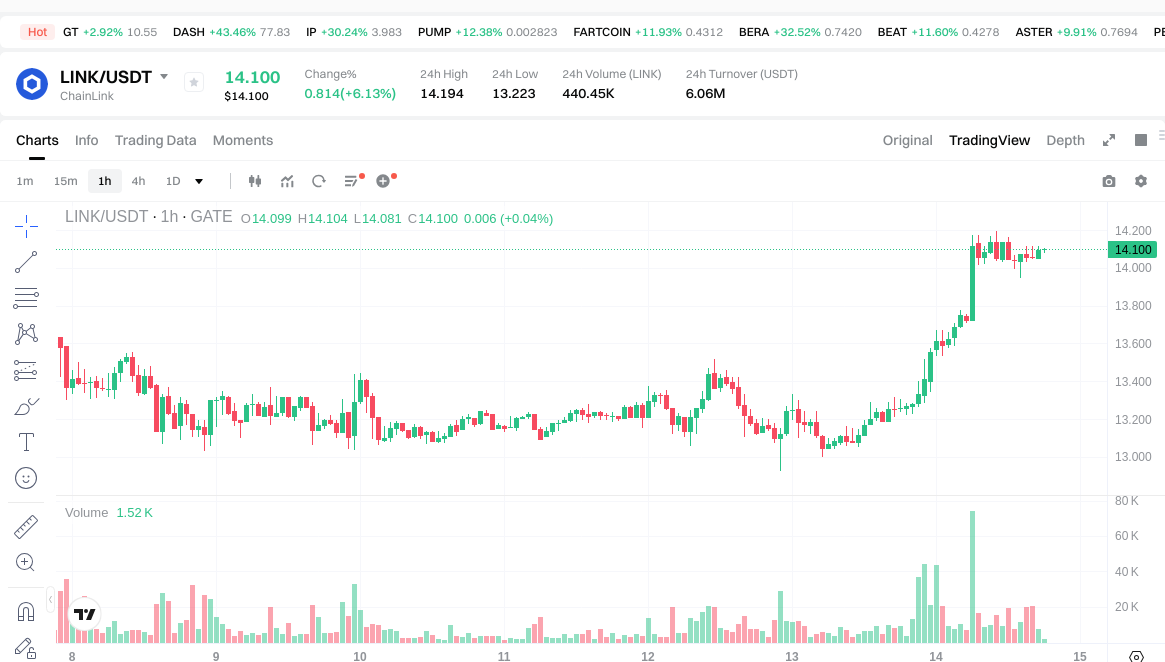
- LINK Current Price: $14.089
- 24-hour Trading Volume: OP recorded $5,412,633 compared to LINK's $6,090,278
- Market Sentiment Index (Fear & Greed Index): 48 (Neutral)
View real-time prices:
II. Core Factors Influencing OP vs LINK Investment Value
Supply Mechanism Comparison (Tokenomics)
- OP: Optimism employs a Rollup technology-based supply mechanism that aims to enhance transaction throughput by transferring transactions from the main chain to a side chain, thereby reducing costs and improving efficiency.
- LINK: Chainlink's tokenomics are designed to support its decentralized oracle network, with supply dynamics influenced by network demand for reliable data feeds in DeFi protocols.
- 📌 Historical Pattern: Supply mechanisms may contribute to price cycles by affecting network usage costs and utility demand, though specific historical patterns require more detailed market data.
Institutional Adoption and Market Application
- Institutional Holdings: Comparative institutional interest data between OP and LINK was not specifically detailed in the available materials.
- Enterprise Adoption: OP focuses on scalability solutions for Ethereum-based applications, while LINK provides oracle services that enable smart contracts to interact with real-world data, supporting various DeFi, NFT, and GameFi applications.
- National Policies: Regulatory attitudes toward blockchain scaling solutions and oracle networks vary across jurisdictions, potentially affecting adoption rates.
Technical Development and Ecosystem Building
- OP Technical Upgrades: Optimism's core advantage lies in its low-cost, high-throughput blockchain technology utilizing Rollup mechanisms to improve transaction processing capabilities.
- LINK Technical Development: Chainlink continues to develop its AI-driven capabilities within DeFi protocols, focusing on expanding market applications and enhancing data reliability.
- Ecosystem Comparison: Both projects demonstrate applications across DeFi, NFT, and smart contract implementation, with OP emphasizing scalability infrastructure and LINK concentrating on data connectivity solutions.
Macroeconomic Environment and Market Cycles
- Performance in Inflationary Environments: Specific comparative data on inflation-resistant properties between OP and LINK was not detailed in the reference materials.
- Macroeconomic Monetary Policy: Interest rates and dollar index movements may influence cryptocurrency valuations generally, though project-specific impacts require further analysis.
- Geopolitical Factors: Cross-border transaction demands and international developments may affect blockchain adoption, though specific correlations to OP and LINK were not elaborated in the available sources.
III. 2026-2031 Price Prediction: OP vs LINK
Short-term Forecast (2026)
- OP: Conservative $0.246-$0.362 | Optimistic $0.362-$0.409
- LINK: Conservative $13.25-$14.10 | Optimistic $14.10-$17.20
Mid-term Forecast (2028-2029)
- OP may enter a gradual growth phase, with estimated price range of $0.290-$0.523
- LINK may enter a moderate expansion phase, with estimated price range of $12.38-$21.24
- Key drivers: institutional capital inflows, ETF developments, ecosystem expansion
Long-term Forecast (2030-2031)
- OP: Baseline scenario $0.390-$0.526 | Optimistic scenario $0.450-$0.658
- LINK: Baseline scenario $12.21-$23.74 | Optimistic scenario $21.60-$27.78
View detailed price predictions for OP and LINK
Disclaimer
OP:
| Year |
Predicted High Price |
Predicted Average Price |
Predicted Low Price |
Price Change |
| 2026 |
0.409173 |
0.3621 |
0.246228 |
0 |
| 2027 |
0.397205595 |
0.3856365 |
0.24680736 |
6 |
| 2028 |
0.418820520825 |
0.3914210475 |
0.28965157515 |
8 |
| 2029 |
0.522605811569625 |
0.4051207841625 |
0.336250250854875 |
11 |
| 2030 |
0.589106388289899 |
0.463863297866062 |
0.44994739893008 |
28 |
| 2031 |
0.658106053847476 |
0.52648484307798 |
0.389598783877705 |
45 |
LINK:
| Year |
Predicted High Price |
Predicted Average Price |
Predicted Low Price |
Price Change |
| 2026 |
17.1959 |
14.095 |
13.2493 |
0 |
| 2027 |
17.3664495 |
15.64545 |
14.080905 |
10 |
| 2028 |
19.8071397 |
16.50594975 |
12.3794623125 |
17 |
| 2029 |
21.24315732825 |
18.156544725 |
16.15932480525 |
28 |
| 2030 |
27.77678994754125 |
19.699851026625 |
12.2139076365075 |
39 |
| 2031 |
25.162619716308112 |
23.738320487083125 |
21.601871643245643 |
68 |
IV. Investment Strategy Comparison: OP vs LINK
Long-term vs Short-term Investment Strategies
- OP: Suitable for investors focused on Ethereum Layer 2 scaling solutions and blockchain infrastructure development, particularly those seeking exposure to transaction cost reduction technologies and network efficiency improvements.
- LINK: Suitable for investors interested in decentralized oracle network infrastructure and data connectivity solutions across DeFi ecosystems, particularly those prioritizing established market presence and cross-protocol utility.
Risk Management and Asset Allocation
- Conservative Investors: OP 30% vs LINK 70%
- Aggressive Investors: OP 55% vs LINK 45%
- Hedging Tools: stablecoin allocation, options strategies, cross-asset portfolio diversification
V. Potential Risk Comparison
Market Risk
- OP: Experienced approximately 94.8% decline from its 2024 peak of $4.84 to its 2025 low of $0.251922, indicating significant price volatility sensitivity to broader market corrections and Layer 2 competitive dynamics.
- LINK: Demonstrated approximately 73.3% decline from its 2021 all-time high of $52.7, showing substantial price fluctuations while maintaining relatively stronger price support compared to its historical peak.
Technical Risk
- OP: Scalability implementation challenges, network adoption rates, competitive pressure from alternative Layer 2 solutions
- LINK: Oracle network reliability dependencies, data feed accuracy requirements, integration complexity with multiple blockchain protocols
Regulatory Risk
- Global regulatory frameworks may impact OP and LINK differently, with scaling solutions potentially facing scrutiny regarding transaction processing and security standards, while oracle networks may encounter data privacy and cross-border information transfer regulations across various jurisdictions.
VI. Conclusion: Which Is the Better Buy?
📌 Investment Value Summary:
- OP Advantages: Low-cost, high-throughput Layer 2 scaling technology addressing Ethereum network congestion; positioned within growing blockchain infrastructure sector; potential for ecosystem expansion as Ethereum adoption increases.
- LINK Advantages: Established decentralized oracle network with demonstrated utility across DeFi protocols; longer market presence since 2017; broader application scenarios connecting smart contracts with real-world data.
✅ Investment Recommendations:
- Beginner Investors: Consider starting with smaller allocations to both assets while prioritizing LINK due to its longer track record and established market position, maintaining diversification with stablecoin reserves.
- Experienced Investors: Evaluate portfolio allocation based on risk tolerance and market outlook, potentially balancing OP's growth potential in Layer 2 infrastructure with LINK's established oracle network utility, while implementing appropriate risk management strategies.
- Institutional Investors: Conduct comprehensive due diligence on technical fundamentals, ecosystem development, and regulatory landscapes for both projects, considering strategic positioning across blockchain infrastructure and data connectivity segments.
⚠️ Risk Warning: Cryptocurrency markets exhibit high volatility. This content does not constitute investment advice.
VII. FAQ
Q1: What are the main differences between OP and LINK's use cases?
OP functions as an Ethereum Layer 2 scaling solution focused on reducing transaction costs and increasing throughput, while LINK operates as a decentralized oracle network providing real-world data connectivity to smart contracts. OP addresses blockchain scalability challenges by processing transactions off the main Ethereum chain through Rollup technology, making it suitable for applications requiring high-speed, low-cost transactions. In contrast, LINK serves as critical infrastructure enabling smart contracts across various blockchains to access external data feeds, supporting DeFi protocols, NFT platforms, and other applications requiring reliable off-chain information.
Q2: Which cryptocurrency has shown better price stability historically?
LINK has demonstrated relatively better price stability with a 73.3% decline from its all-time high, compared to OP's approximate 94.8% drop from its peak. LINK launched in 2017 and reached $52.7 in May 2021, maintaining stronger price support relative to its historical peak. OP, launching more recently in 2022, peaked at $4.84 in March 2024 before declining to $0.251922 by December 2025. While both assets exhibit significant volatility characteristic of cryptocurrency markets, LINK's longer market presence and established utility across multiple protocols have contributed to relatively stronger price resilience during market corrections.
Q3: How do the supply mechanisms of OP and LINK differ?
OP employs a Rollup technology-based supply mechanism designed to enhance transaction throughput by processing transactions on a side chain before settling on Ethereum's main chain, with tokenomics structured around network usage and scaling efficiency. LINK's tokenomics support its decentralized oracle network, where supply dynamics are influenced by network demand for reliable data feeds across DeFi protocols and smart contract applications. While OP's supply mechanism focuses on transaction processing efficiency and cost reduction, LINK's supply model is tied to oracle service provision and data reliability requirements across multiple blockchain ecosystems.
Q4: What are the recommended portfolio allocations for different investor types?
Conservative investors may consider a 30% OP / 70% LINK allocation, prioritizing LINK's established market position and longer track record while maintaining exposure to OP's Layer 2 growth potential. Aggressive investors might adopt a 55% OP / 45% LINK strategy, emphasizing OP's higher growth potential within the expanding Ethereum scaling sector. Beginner investors should start with smaller allocations to both assets, potentially favoring LINK due to its demonstrated utility and market stability, while maintaining stablecoin reserves for risk management. All allocation strategies should incorporate appropriate diversification and risk management tools including stablecoin buffers and portfolio rebalancing mechanisms.
Q5: What are the key technical risks associated with OP and LINK?
OP faces technical risks including scalability implementation challenges, network adoption uncertainties, and competitive pressure from alternative Layer 2 solutions such as Arbitrum and zkSync, which may impact market share and ecosystem growth. LINK's technical risks involve oracle network reliability dependencies, data feed accuracy requirements across multiple protocols, and integration complexity with various blockchain platforms. Both projects must continuously innovate to maintain competitive advantages—OP through enhanced transaction processing capabilities and reduced costs, while LINK through improved data reliability and expanded cross-chain oracle services.
Q6: How do market cycles affect OP and LINK differently?
OP, as a newer project launched in 2022, shows greater sensitivity to market cycles with sharper price movements during both bullish and bearish phases, experiencing a 94.8% decline from peak to trough. LINK, with its longer market history since 2017, demonstrates more moderate cycle-driven fluctuations while maintaining relatively stronger support levels during corrections. During bullish cycles, OP may benefit from increased demand for Ethereum scaling solutions and infrastructure expansion, while LINK gains from broader DeFi adoption and oracle service utilization. In bearish markets, LINK's established utility and diversified protocol integrations may provide relatively better price resilience compared to OP's infrastructure-focused positioning.
Q7: What institutional adoption patterns differentiate OP from LINK?
LINK has achieved broader institutional recognition through its established presence since 2017 and demonstrated utility across numerous DeFi protocols, NFT platforms, and enterprise blockchain applications requiring reliable data connectivity. OP, as a more recent entrant focused on Ethereum Layer 2 scaling, appeals to institutions seeking exposure to blockchain infrastructure and transaction efficiency improvements. While specific institutional holdings data varies, LINK's longer track record and wider application scenarios across multiple protocols suggest stronger institutional integration, whereas OP represents emerging infrastructure investments aligned with Ethereum's scaling roadmap and growing Layer 2 ecosystem adoption.
Q8: What should investors prioritize when choosing between OP and LINK?
Investors should evaluate their risk tolerance, investment timeline, and portfolio objectives when choosing between OP and LINK. Those prioritizing established market presence, broader application utility, and relatively stronger historical price stability may favor LINK's decentralized oracle network positioning. Investors seeking exposure to emerging Ethereum scaling infrastructure with higher growth potential despite increased volatility may consider OP. Key evaluation criteria include technical development progress, ecosystem adoption rates, competitive positioning within respective sectors, regulatory landscape considerations, and alignment with overall portfolio diversification strategies. Both assets exhibit substantial volatility, requiring appropriate risk management regardless of allocation decisions.
* The information is not intended to be and does not constitute financial advice or any other recommendation of any sort offered or endorsed by Gate.