This comprehensive guide compares two leading blockchain governance tokens: Syscoin (SYS) and The Graph (GRT). SYS, launched in 2014, serves as a decentralized infrastructure platform enabling near-zero-cost transactions across e-commerce, healthcare, supply chain, and finance sectors. GRT, introduced in December 2020, functions as a decentralized indexing protocol for Ethereum blockchain data. The article analyzes historical price trends, current market status, tokenomics, institutional adoption, technical ecosystems, and investment strategies through 2031 price forecasts on Gate. Both tokens have declined substantially from peaks, with GRT showing higher trading volume ($120,785.96 vs $12,241.32). Conservative investors may consider 40% SYS/60% GRT allocation, while risk management remains essential given extreme market fear conditions and regulatory uncertainties affecting both assets.
Introduction: Investment Comparison Between SYS and GRT
In the cryptocurrency market, the comparison between SYS vs GRT has been a topic of continuous interest among investors. Both assets exhibit notable differences in market cap ranking, application scenarios, and price performance, representing distinct positioning within the crypto asset landscape.
Syscoin (SYS): Launched in 2014 as one of the early crowdfunding projects in the blockchain space, SYS has achieved several milestones including the development of a decentralized DAG network and becoming a founding member of the Microsoft-centered Decentralized Identity Foundation. The platform provides near-zero-cost financial transactions and infrastructure for businesses to securely trade goods, assets, digital certificates, and data across various sectors including e-commerce, healthcare, insurance, supply chain logistics, finance, and gaming.
The Graph (GRT): Introduced in December 2020, GRT serves as a decentralized protocol for indexing and querying blockchain data on Ethereum. The platform simplifies data queries through open APIs (subgraphs), enabling easy data access. GRT tokens function primarily for indexer staking and curator signaling, with a current market cap of approximately $392 million and ranking at 152.
This article will comprehensively analyze the investment value comparison of SYS vs GRT through historical price trends, supply mechanisms, institutional adoption, technical ecosystems, and future projections, attempting to address investors' most pressing question:
"Which is the better buy right now?"
I. Historical Price Comparison and Current Market Status
Historical Price Trends of SYS (Coin A) and GRT (Coin B)
-
2014: SYS launched as one of the earlier crowdfunding projects in the blockchain space, starting with a publish price of $0.002039.
-
2015: SYS recorded its all-time low at $0.00020971 on February 22, 2015.
-
2016: SYS underwent a significant upgrade to version 2.0 in late April 2016, adjusting its algorithm and total supply.
-
2020: GRT was launched in December 2020 with a publish price of $0.03, introducing a decentralized protocol for indexing and querying blockchain data on Ethereum.
-
2021: GRT experienced notable growth, reaching its all-time high of $2.84 on February 12, 2021.
-
2022: SYS reached its peak price of $1.3 on January 2, 2022.
-
2026: GRT recorded its all-time low at $0.03272768 on January 1, 2026.
-
Comparative analysis: During different market cycles, SYS declined from its historical high of $1.3 to a current level, while GRT showed a decline from $2.84 to near its recent low. Both assets experienced substantial corrections from their respective peaks.
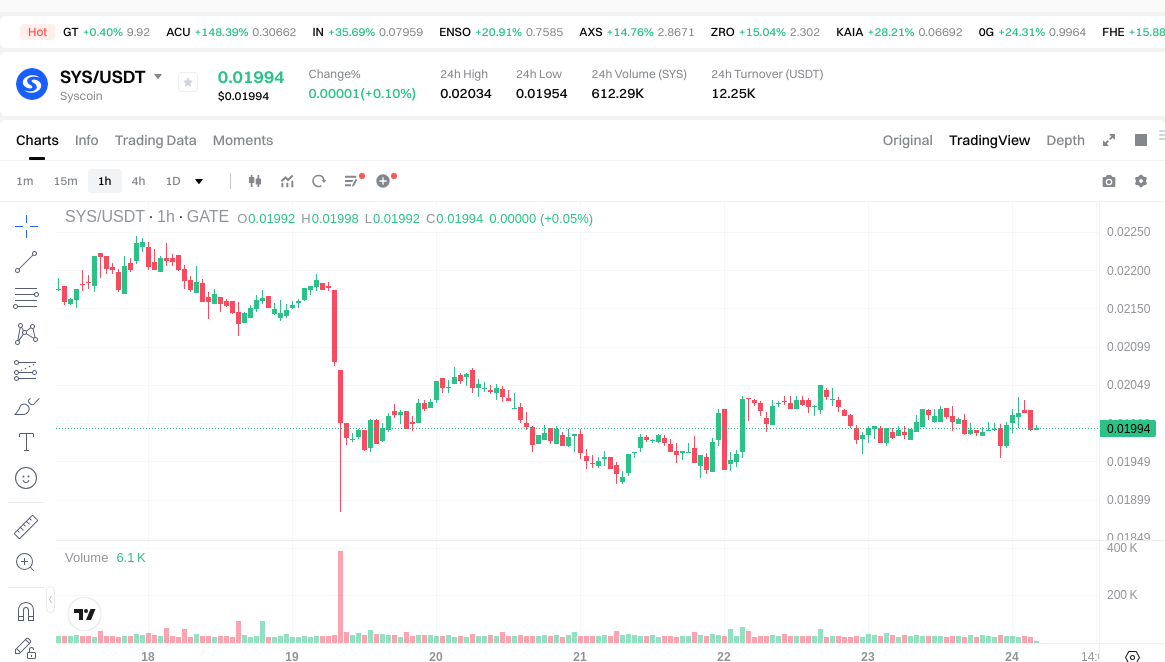
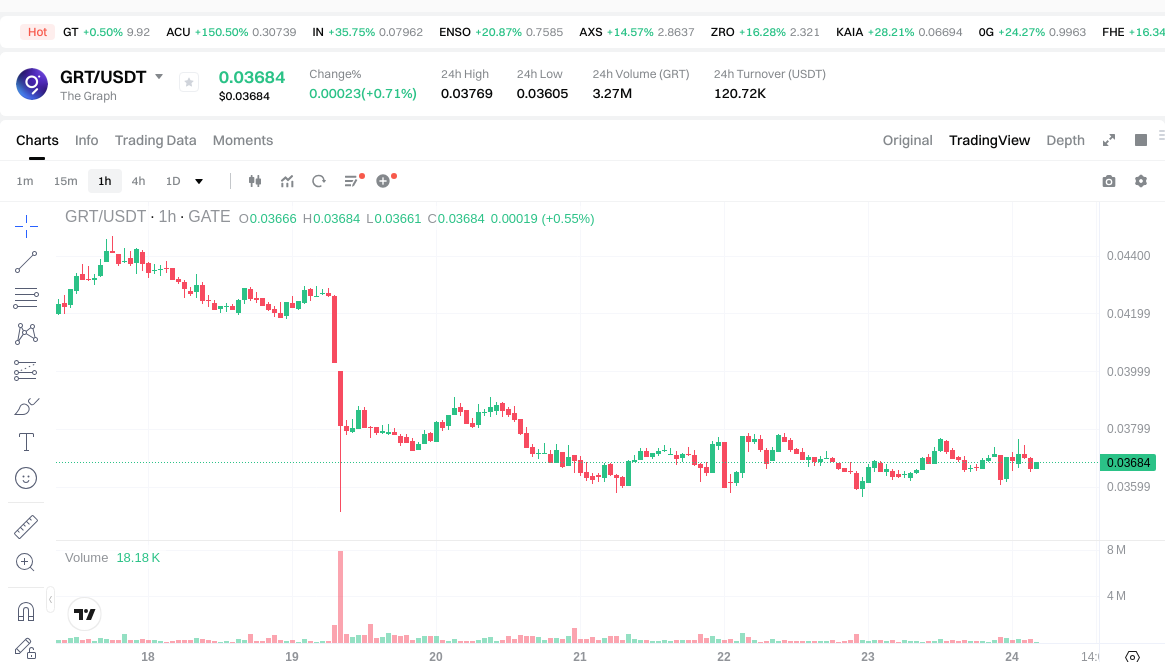
Current Market Status (January 24, 2026)
- SYS current price: $0.01998
- GRT current price: $0.03667
- 24-hour trading volume: SYS recorded $12,241.32, while GRT showed higher activity with $120,785.96
- Market Sentiment Index (Fear & Greed Index): 24 (Extreme Fear)
Check real-time prices:
II. Core Factors Influencing SYS vs GRT Investment Value
Supply Mechanism Comparison (Tokenomics)
Due to limited available data on the specific supply mechanisms of SYS and GRT, a comprehensive comparison cannot be provided at this time. Generally, supply mechanisms such as fixed supply models, deflationary designs, or halving schedules can influence token scarcity and potential price dynamics over different market cycles.
Institutional Adoption and Market Application
Institutional Holdings
Information regarding institutional preference between SYS and GRT is not currently available in the reference materials.
Enterprise Adoption
Specific applications of SYS and GRT in cross-border payments, settlement systems, or institutional investment portfolios are not detailed in the provided data.
National Policies
Regulatory attitudes toward SYS and GRT vary across jurisdictions, though specific policy frameworks for these tokens are not documented in the available materials.
Technical Development and Ecosystem Building
SYS Technical Upgrades
Details on recent or planned technical upgrades for SYS are not available in the reference materials.
GRT Technical Development
Information on GRT's technical roadmap and development priorities is not provided in the available data.
Ecosystem Comparison
A comparative analysis of SYS and GRT participation in DeFi protocols, NFT marketplaces, payment systems, and smart contract implementations cannot be conducted based on the current reference materials.
Macroeconomic Environment and Market Cycles
Empirical data comparing the inflation-hedging properties of SYS versus GRT is not available in the provided materials.
Macroeconomic Monetary Policy
The correlation between interest rate movements, U.S. Dollar Index fluctuations, and the price performance of SYS and GRT requires further data analysis.
Geopolitical Factors
The impact of cross-border transaction demand and international geopolitical developments on SYS and GRT adoption remains an area requiring additional research and data.
III. 2026-2031 Price Forecast: SYS vs GRT
Short-term Forecast (2026)
- SYS: Conservative $0.0106-$0.0199 | Optimistic $0.0199-$0.0277
- GRT: Conservative $0.0331-$0.0368 | Optimistic $0.0368-$0.0430
Mid-term Forecast (2028-2029)
- SYS may enter a consolidation phase, with estimated price range of $0.0179-$0.0334
- GRT may enter an expansion phase, with estimated price range of $0.0297-$0.0590
- Key drivers: institutional capital inflows, ETF developments, ecosystem growth
Long-term Forecast (2031)
- SYS: Baseline scenario $0.0200-$0.0339 | Optimistic scenario $0.0339-$0.0434
- GRT: Baseline scenario $0.0300-$0.0578 | Optimistic scenario $0.0578-$0.0653
View detailed price predictions for SYS and GRT
Disclaimer: Price predictions are based on historical data analysis and market trends. Cryptocurrency markets are highly volatile and subject to numerous external factors. These forecasts should not be considered as investment advice.
SYS:
| Year |
Predicted High Price |
Predicted Average Price |
Predicted Low Price |
Price Change |
| 2026 |
0.0277027 |
0.01993 |
0.0105629 |
0 |
| 2027 |
0.030484928 |
0.02381635 |
0.0216728785 |
19 |
| 2028 |
0.03040871568 |
0.027150639 |
0.01791942174 |
35 |
| 2029 |
0.0333844257144 |
0.02877967734 |
0.0184189934976 |
44 |
| 2030 |
0.036676820802096 |
0.0310820515272 |
0.019581692462136 |
55 |
| 2031 |
0.043365678290749 |
0.033879436164648 |
0.019988867337142 |
69 |
GRT:
| Year |
Predicted High Price |
Predicted Average Price |
Predicted Low Price |
Price Change |
| 2026 |
0.0430092 |
0.03676 |
0.033084 |
0 |
| 2027 |
0.05583844 |
0.0398846 |
0.029115758 |
8 |
| 2028 |
0.0521690568 |
0.04786152 |
0.0296741424 |
30 |
| 2029 |
0.059018040312 |
0.0500152884 |
0.041012536488 |
36 |
| 2030 |
0.06105866407872 |
0.054516664356 |
0.04579399805904 |
48 |
| 2031 |
0.065300060565616 |
0.05778766421736 |
0.030049585393027 |
57 |
IV. Investment Strategy Comparison: SYS vs GRT
Long-term vs Short-term Investment Strategies
- SYS: May be suitable for investors interested in early-stage blockchain infrastructure projects with cross-sector application potential in e-commerce, healthcare, supply chain, and financial services. The token's historical presence since 2014 reflects sustained development activity.
- GRT: May appeal to investors focusing on blockchain data infrastructure and Web3 ecosystem development, particularly those interested in decentralized indexing protocols that support Ethereum and broader multi-chain data accessibility.
Risk Management and Asset Allocation
- Conservative investors: Consider diversified exposure with potential allocation frameworks such as 40% SYS vs 60% GRT, reflecting GRT's relatively higher trading volume and established protocol functionality
- Aggressive investors: May explore alternative allocation models such as 55% SYS vs 45% GRT to capture potential upside from SYS's lower market cap positioning
- Hedging instruments: Stablecoin reserves, options strategies, and cross-asset portfolio combinations to manage volatility exposure
V. Potential Risk Comparison
Market Risk
- SYS: Exhibits lower trading volume ($12,241.32 in 24-hour period as of January 24, 2026), which may result in reduced liquidity and increased price volatility during market stress periods. The token has experienced substantial decline from its January 2022 peak of $1.3 to current levels around $0.01998.
- GRT: Demonstrates relatively higher trading activity ($120,785.96 in 24-hour volume), though has also declined significantly from its February 2021 all-time high of $2.84 to current levels near $0.03667. Market sentiment remains in extreme fear territory (Fear & Greed Index: 24).
Technical Risk
- SYS: Scalability considerations and network stability factors require ongoing evaluation, particularly as the platform supports infrastructure across multiple industry verticals
- GRT: Protocol dependency on Ethereum network performance and multi-chain integration complexity may present technical challenges. Decentralized indexer network stability and query reliability remain important operational considerations.
Regulatory Risk
- Global regulatory developments may impact both assets differently based on their distinct use cases. SYS's positioning across financial transactions and business infrastructure may face varying compliance requirements across jurisdictions. GRT's data indexing protocol function may encounter different regulatory frameworks related to data services and Web3 infrastructure. Evolving digital asset regulations in major markets could affect adoption trajectories and institutional participation for both tokens.
VI. Conclusion: Which Is the Better Buy?
📌 Investment Value Summary:
- SYS Characteristics: Established presence since 2014 with infrastructure supporting cross-sector applications including e-commerce, healthcare, supply chain logistics, finance, and gaming. Provides near-zero-cost transaction capabilities with decentralized architecture. Current price positioning at significant discount from historical peak.
- GRT Characteristics: Decentralized data indexing protocol serving blockchain data accessibility needs with focus on Ethereum ecosystem. Token utility encompasses indexer staking and curator signaling mechanisms. Demonstrates higher trading volume relative to SYS, indicating comparatively greater market liquidity.
✅ Investment Considerations:
- Novice investors: Consider gradual position building with emphasis on risk management, diversification across multiple assets, and thorough understanding of each project's technical fundamentals and use case differentiation before allocation decisions
- Experienced investors: May evaluate tactical allocation opportunities based on technical analysis, ecosystem development milestones, and comparative valuation metrics while maintaining disciplined risk parameters
- Institutional participants: Could assess strategic positioning considerations through comprehensive due diligence on protocol maturity, adoption metrics, regulatory compliance frameworks, and long-term infrastructure value propositions
⚠️ Risk Disclosure: Cryptocurrency markets exhibit extreme volatility characteristics. Price forecasts are based on historical data patterns and market trend analysis but cannot account for all variables affecting future performance. This content does not constitute investment advice, financial recommendation, or solicitation to buy or sell any digital assets. Investors should conduct independent research and consult qualified financial professionals before making investment decisions.
VII. FAQ
Q1: What are the fundamental differences between SYS and GRT in terms of use cases?
SYS functions as a blockchain infrastructure platform for near-zero-cost financial transactions and business operations across multiple sectors including e-commerce, healthcare, insurance, supply chain logistics, finance, and gaming. In contrast, GRT operates as a decentralized protocol specifically designed for indexing and querying blockchain data on Ethereum, enabling simplified data access through open APIs (subgraphs). While SYS positions itself as a comprehensive business infrastructure solution launched in 2014, GRT focuses on solving blockchain data accessibility challenges within the Web3 ecosystem since its December 2020 launch.
Q2: Which token demonstrates better liquidity based on current market data?
GRT exhibits significantly higher liquidity with a 24-hour trading volume of $120,785.96 compared to SYS's $12,241.32 as of January 24, 2026. This approximately 10x difference in trading volume suggests GRT offers substantially better market liquidity, potentially resulting in tighter bid-ask spreads, easier position entry and exit, and reduced slippage during transactions. Lower liquidity in SYS may lead to increased price volatility and execution challenges, particularly during periods of market stress.
Q3: How have SYS and GRT performed relative to their historical peaks?
Both tokens have experienced substantial corrections from their all-time highs. SYS reached its peak price of $1.3 on January 2, 2022, and currently trades at approximately $0.01998, representing a decline of roughly 98.5%. GRT achieved its all-time high of $2.84 on February 12, 2021, with a current price around $0.03667, reflecting an approximate 98.7% decline. Both assets show similar drawdown magnitudes from their respective peaks, indicating comparable vulnerability to broader crypto market cycles.
Q4: What are the projected price ranges for SYS and GRT by 2031?
According to baseline forecasts, SYS is projected to trade within a range of $0.0200-$0.0339 by 2031, with an optimistic scenario suggesting potential upside to $0.0339-$0.0434. GRT's baseline projection indicates a price range of $0.0300-$0.0578 by 2031, with optimistic scenarios estimating $0.0578-$0.0653. These forecasts suggest GRT may maintain relatively higher price levels compared to SYS throughout the projection period, though both estimates reflect modest appreciation from current levels and remain subject to significant uncertainty given cryptocurrency market volatility.
Q5: What allocation strategy might conservative investors consider between SYS and GRT?
Conservative investors may consider a diversified approach with a potential allocation framework of 40% SYS and 60% GRT, reflecting GRT's relatively higher trading volume, established protocol functionality, and comparatively better liquidity metrics. This allocation acknowledges GRT's more mature market positioning while maintaining exposure to SYS's cross-sector infrastructure potential. Risk management should include maintaining stablecoin reserves, implementing position sizing discipline, and regular portfolio rebalancing to manage volatility exposure inherent in both assets.
Q6: What are the primary technical risks associated with each token?
SYS faces technical considerations related to scalability requirements and network stability as it supports infrastructure across multiple industry verticals including healthcare, finance, and supply chain logistics. GRT's technical risks center on protocol dependency on Ethereum network performance, multi-chain integration complexity, and the reliability of its decentralized indexer network for maintaining consistent query performance. Both platforms require ongoing technical development to address evolving scalability demands and maintain competitive positioning within their respective market segments.
Q7: How does current market sentiment affect investment considerations for SYS vs GRT?
The current Fear & Greed Index reading of 24 (Extreme Fear) as of January 24, 2026, indicates prevailing negative market sentiment across the cryptocurrency sector. This environment typically presents both risk and opportunity: potential for continued price pressure in the near term, but historically, extreme fear readings have occasionally preceded medium-term market reversals. Investors considering positions in either SYS or GRT during extreme fear conditions should employ disciplined risk management, staged entry strategies, and maintain realistic expectations about recovery timelines given the uncertain macroeconomic environment.
Q8: What regulatory considerations should investors evaluate when comparing SYS and GRT?
Regulatory risk profiles differ based on each token's distinct use cases. SYS's positioning across financial transactions and business infrastructure may encounter varying compliance requirements related to payment processing, cross-border transactions, and financial services regulations across different jurisdictions. GRT's data indexing protocol function may face regulatory frameworks pertaining to data services, Web3 infrastructure, and blockchain analytics. Evolving digital asset regulations in major markets including the United States, European Union, and Asia-Pacific regions could materially impact adoption trajectories, institutional participation, and operational compliance costs for both projects.
* The information is not intended to be and does not constitute financial advice or any other recommendation of any sort offered or endorsed by Gate.


