This comprehensive article compares TRAC and NEAR, two distinct blockchain projects with different market positioning and investment profiles. TRAC, focused on verifiable AI infrastructure and supply chain applications, traded at $0.4137 with $20.88 million daily volume as of January 2026, while NEAR, an established Layer 1 protocol, traded at $1.7209 with substantially higher $6.31 billion volume. The article analyzes historical price trends, institutional adoption patterns, technical ecosystems, and projected price ranges through 2031, providing investment strategy recommendations for conservative, aggressive, and institutional investors. Key factors examined include tokenomics mechanisms, market liquidity differences, regulatory considerations, and risk assessment for both assets. The comparison addresses which asset offers better investment value based on different investor profiles and conviction levels regarding AI infrastructure versus established Layer 1 blockchain protocols.
Introduction: Investment Comparison Between TRAC and NEAR
In the cryptocurrency market, the comparison between TRAC and NEAR has consistently been a topic that investors cannot overlook. Both demonstrate notable differences in market cap ranking, application scenarios, and price performance, representing distinct positioning within the crypto asset landscape.
OriginTrail (TRAC): Since its launch in 2018, it has gained market recognition through its focus on building a Verifiable Internet for AI and establishing trusted knowledge networks across supply chains and real-world asset sectors.
Near Protocol (NEAR): Launched in 2020, it has been positioned as a highly scalable blockchain protocol designed to support decentralized applications on mobile devices, providing developers with essential infrastructure for building blockchain-based solutions.
This article will provide a comprehensive analysis of the investment value comparison between TRAC and NEAR, examining historical price trends, supply mechanisms, institutional adoption, technological ecosystems, and future projections, while attempting to address the question that concerns investors most:
"Which is the better buy right now?"
I. Historical Price Comparison and Current Market Status
TRAC (OriginTrail) and NEAR (Near Protocol) Historical Price Trends
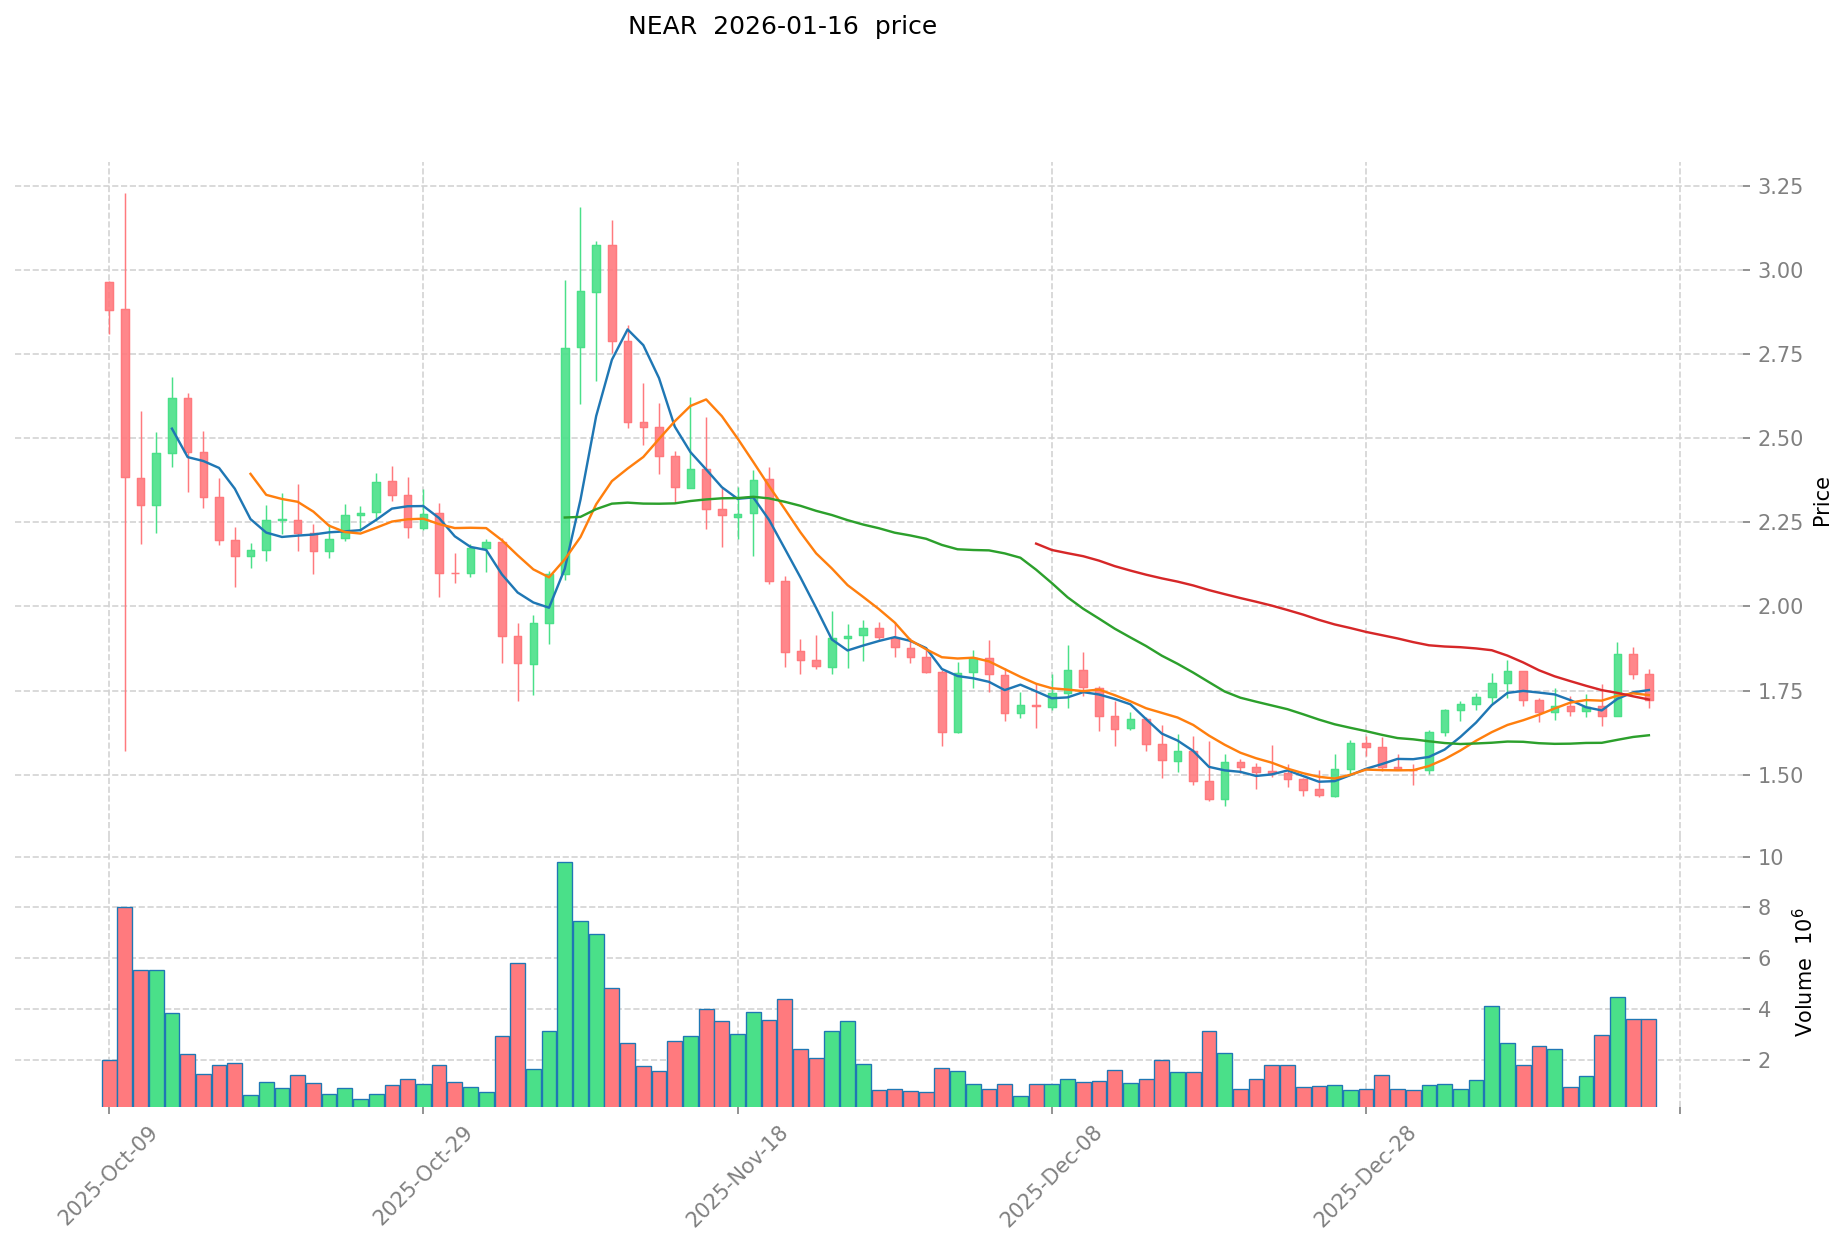
- 2022: TRAC experienced significant volatility during market corrections, while NEAR reached its all-time high of $20.44 on January 17, 2022, driven by strong ecosystem adoption and developer activity.
- 2025: TRAC recorded its historical high of $0.54 on December 10, 2025, reflecting renewed interest in verifiable AI infrastructure. NEAR's price declined substantially from its peak, facing challenges in a competitive Layer 1 landscape.
- Comparative Analysis: Throughout the market cycle, TRAC moved from its December 2025 high of $0.54 to a low of $0.372 on December 23, 2025, representing approximately 31% decline. In contrast, NEAR has experienced a more pronounced correction from its historical high of $20.44 to current levels, indicating approximately 91% decline from peak values.
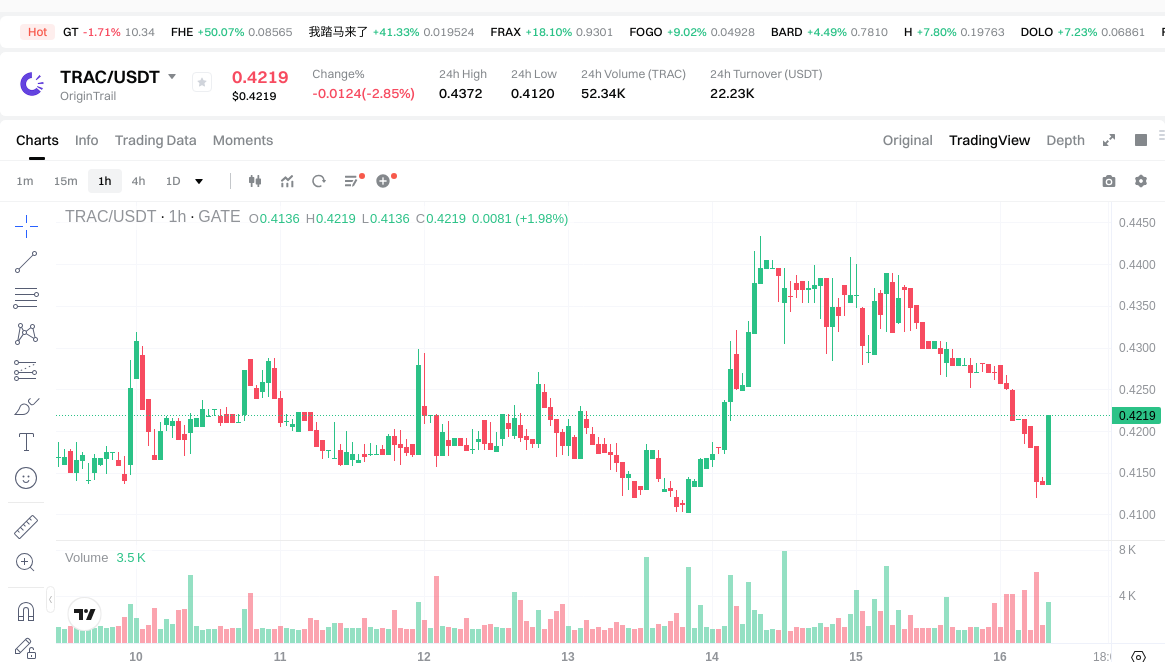
Current Market Situation (January 16, 2026)
- TRAC Current Price: $0.4137
- NEAR Current Price: $1.7209
- 24-Hour Trading Volume: TRAC recorded $20.88 million compared to NEAR's $6.31 billion, demonstrating substantially different liquidity profiles
- Market Sentiment Index (Fear & Greed Index): 61 (Greed)
View real-time prices:
II. Core Factors Influencing TRAC vs NEAR Investment Value
Supply Mechanism Comparison (Tokenomics)
- TRAC: The materials do not provide specific information about TRAC's supply mechanism or tokenomics model.
- NEAR: The materials do not provide specific information about NEAR's supply mechanism or tokenomics model.
- 📌 Historical Pattern: Supply mechanisms can influence price cycles through controlled release schedules and scarcity dynamics, though specific impacts vary by project implementation.
Institutional Adoption and Market Applications
- Institutional Holdings: The materials do not contain comparative data on institutional preference between TRAC and NEAR.
- Enterprise Adoption: The materials do not provide information about enterprise-level adoption of TRAC or NEAR in cross-border payments, settlements, or investment portfolios.
- National Policies: The materials do not discuss regulatory attitudes toward either TRAC or NEAR in different jurisdictions.
Technical Development and Ecosystem Building
- TRAC Technical Upgrades: The materials mention TRAC is associated with OriginTrail but do not detail specific technical upgrades or their potential impacts.
- NEAR Technical Development: The materials do not contain information about NEAR's technical development roadmap.
- Ecosystem Comparison: The materials do not provide comparative analysis of DeFi, NFT, payment systems, or smart contract implementations for either project.
Macroeconomic Factors and Market Cycles
- Performance in Inflationary Environments: The materials note that crypto market investments face risks from market volatility and policy changes, but do not specifically compare TRAC and NEAR's inflation-hedging properties.
- Macroeconomic Monetary Policy: The materials reference that long-term trends may be influenced by global economic factors, including monetary policy impacts, though specific effects on TRAC or NEAR are not detailed.
- Geopolitical Factors: The materials mention geopolitical events can trigger short-term market impacts, with reference to tariff policies affecting crypto markets broadly, but do not provide TRAC or NEAR specific analysis.
III. 2026-2031 Price Prediction: TRAC vs NEAR
Short-term Forecast (2026)
- TRAC: Conservative $0.27-$0.42 | Optimistic $0.42-$0.61
- NEAR: Conservative $1.46-$1.72 | Optimistic $1.72-$2.53
Mid-term Forecast (2028-2029)
- TRAC may enter a consolidation phase with estimated prices ranging from $0.36 to $0.87
- NEAR may enter a growth phase with estimated prices ranging from $1.55 to $3.54
- Key drivers: institutional capital inflows, ETF developments, ecosystem expansion
Long-term Forecast (2030-2031)
- TRAC: Baseline scenario $0.40-$0.74 | Optimistic scenario $0.74-$1.14
- NEAR: Baseline scenario $2.47-$3.43 | Optimistic scenario $3.43-$4.02
View detailed price predictions for TRAC and NEAR
Disclaimer
TRAC:
| Year |
Predicted High Price |
Predicted Average Price |
Predicted Low Price |
Price Change |
| 2026 |
0.607536 |
0.4219 |
0.265797 |
1 |
| 2027 |
0.54560108 |
0.514718 |
0.35515542 |
24 |
| 2028 |
0.715715379 |
0.53015954 |
0.3552068918 |
28 |
| 2029 |
0.865883068705 |
0.6229374595 |
0.47343246922 |
50 |
| 2030 |
0.93795693276915 |
0.7444102641025 |
0.40198154261535 |
79 |
| 2031 |
1.135597857888363 |
0.841183598435825 |
0.664535042764301 |
103 |
NEAR:
| Year |
Predicted High Price |
Predicted Average Price |
Predicted Low Price |
Price Change |
| 2026 |
2.52987 |
1.721 |
1.46285 |
0 |
| 2027 |
2.2954698 |
2.125435 |
1.7428567 |
23 |
| 2028 |
2.54202026 |
2.2104524 |
1.54731668 |
28 |
| 2029 |
3.5405921317 |
2.37623633 |
2.0673256071 |
38 |
| 2030 |
3.905106784722 |
2.95841423085 |
2.5146520962225 |
71 |
| 2031 |
4.01515979410962 |
3.431760507786 |
2.47086756560592 |
99 |
IV. Investment Strategy Comparison: TRAC vs NEAR
Long-term vs Short-term Investment Strategies
- TRAC: May appeal to investors focused on emerging verifiable AI infrastructure and knowledge network applications, with potential for gradual ecosystem development through 2031
- NEAR: May suit investors seeking exposure to established Layer 1 blockchain infrastructure with developed developer ecosystems and decentralized application frameworks
Risk Management and Asset Allocation
- Conservative Investors: TRAC 30% vs NEAR 70% - allocation favoring established protocol with larger market capitalization and liquidity
- Aggressive Investors: TRAC 50% vs NEAR 50% - balanced exposure to both verifiable AI infrastructure and Layer 1 protocol segments
- Hedging Tools: stablecoin allocation, options strategies, cross-asset portfolio diversification
V. Potential Risk Comparison
Market Risks
- TRAC: Lower liquidity profile with 24-hour trading volume of $20.88 million may result in increased price volatility during market stress periods
- NEAR: Substantial decline from historical peak of $20.44 to current levels reflects competitive pressures in Layer 1 blockchain space
Technical Risks
- TRAC: scalability considerations, network stability in emerging verifiable AI infrastructure applications
- NEAR: competitive dynamics in Layer 1 ecosystem, technical implementation challenges
Regulatory Risks
- Global regulatory frameworks may affect both assets differently based on their respective use cases, with evolving policies around blockchain infrastructure and AI-related applications potentially creating varying compliance requirements
VI. Conclusion: Which Is the Better Buy?
📌 Investment Value Summary:
- TRAC Advantages: positioning in verifiable AI infrastructure segment, recorded price high in December 2025 indicating recent market interest
- NEAR Advantages: established Layer 1 protocol with substantial trading volume ($6.31 billion), developed ecosystem for decentralized applications
✅ Investment Recommendations:
- New Investors: consider NEAR for exposure to established blockchain infrastructure with higher liquidity, enabling easier position management
- Experienced Investors: evaluate portfolio allocation based on conviction in verifiable AI infrastructure (TRAC) versus Layer 1 protocol growth (NEAR), with appropriate risk management
- Institutional Investors: assess both assets within broader blockchain infrastructure allocation strategy, considering liquidity requirements and investment horizon
⚠️ Risk Warning: Cryptocurrency markets exhibit extreme volatility. This article does not constitute investment advice.
VII. FAQ
Q1: What is the primary difference between TRAC and NEAR's market positioning?
TRAC focuses on verifiable AI infrastructure and knowledge networks, while NEAR is an established Layer 1 blockchain protocol for decentralized applications. TRAC targets supply chain verification and real-world asset sectors through its OriginTrail network launched in 2018, whereas NEAR emphasizes scalability and mobile-friendly dApp development since 2020, representing fundamentally different approaches to blockchain utility.
Q2: How do the liquidity profiles of TRAC and NEAR compare?
NEAR demonstrates significantly higher liquidity with $6.31 billion in 24-hour trading volume compared to TRAC's $20.88 million. This substantial difference means NEAR offers approximately 300x greater trading volume, which translates to easier position entry and exit for investors, tighter bid-ask spreads, and lower slippage during large transactions. TRAC's lower liquidity may result in increased price volatility during market stress periods.
Q3: Which asset has shown stronger recent price performance?
TRAC recorded its all-time high of $0.54 in December 2025, representing relatively recent market recognition, with a current decline of approximately 31% from that peak. NEAR reached its historical high of $20.44 in January 2022 but has since declined approximately 91% to current levels around $1.72. TRAC's more recent peak suggests renewed market interest, while NEAR faces challenges in the competitive Layer 1 landscape.
Q4: What are the projected price ranges for TRAC and NEAR through 2031?
According to conservative estimates, TRAC may range from $0.27 to $1.14 between 2026-2031, with an optimistic 2031 projection reaching $1.14. NEAR's projections range from $1.46 to $4.02 across the same period, with optimistic 2031 scenarios targeting $4.02. These forecasts suggest NEAR maintains higher absolute price levels, though both assets show potential for growth over the medium to long term.
Q5: Which allocation strategy is recommended for different investor profiles?
Conservative investors may consider a 30% TRAC / 70% NEAR allocation, favoring NEAR's established infrastructure and higher liquidity. Aggressive investors might adopt a balanced 50% / 50% split to gain exposure to both verifiable AI infrastructure and Layer 1 protocol segments. New investors should prioritize NEAR for easier position management, while experienced investors should assess allocations based on conviction in each project's specific use case and risk tolerance.
Q6: What are the key risk factors specific to each asset?
TRAC faces risks related to lower liquidity ($20.88 million daily volume), scalability considerations in emerging verifiable AI applications, and network stability as the infrastructure develops. NEAR confronts competitive pressures in the crowded Layer 1 space, having declined 91% from its peak, plus technical implementation challenges amid evolving dApp requirements. Both assets face regulatory uncertainty regarding blockchain infrastructure and AI-related applications.
* The information is not intended to be and does not constitute financial advice or any other recommendation of any sort offered or endorsed by Gate.