深入解析加密货币交易中的核心K线形态
如何解读主流K线形态
K线是什么?
K线是一种源自18世纪日本的图表工具,用于直观展现金融资产的价格变动。这一分析方法流传至今,帮助交易者识别各种价格行为模式。如今,K线分析已广泛应用于数字资产和加密货币等市场,成为观察历史行情和预测未来走势的重要手段。
K线分析核心在于,连续排列的多根K线往往构成特定形态。这些形态能指示市场方向,揭示价格可能上涨、下跌或横盘。掌握七种主要K线形态及其变体,有助于交易者深入理解市场情绪,抓住潜在交易机会。
K线图的工作原理
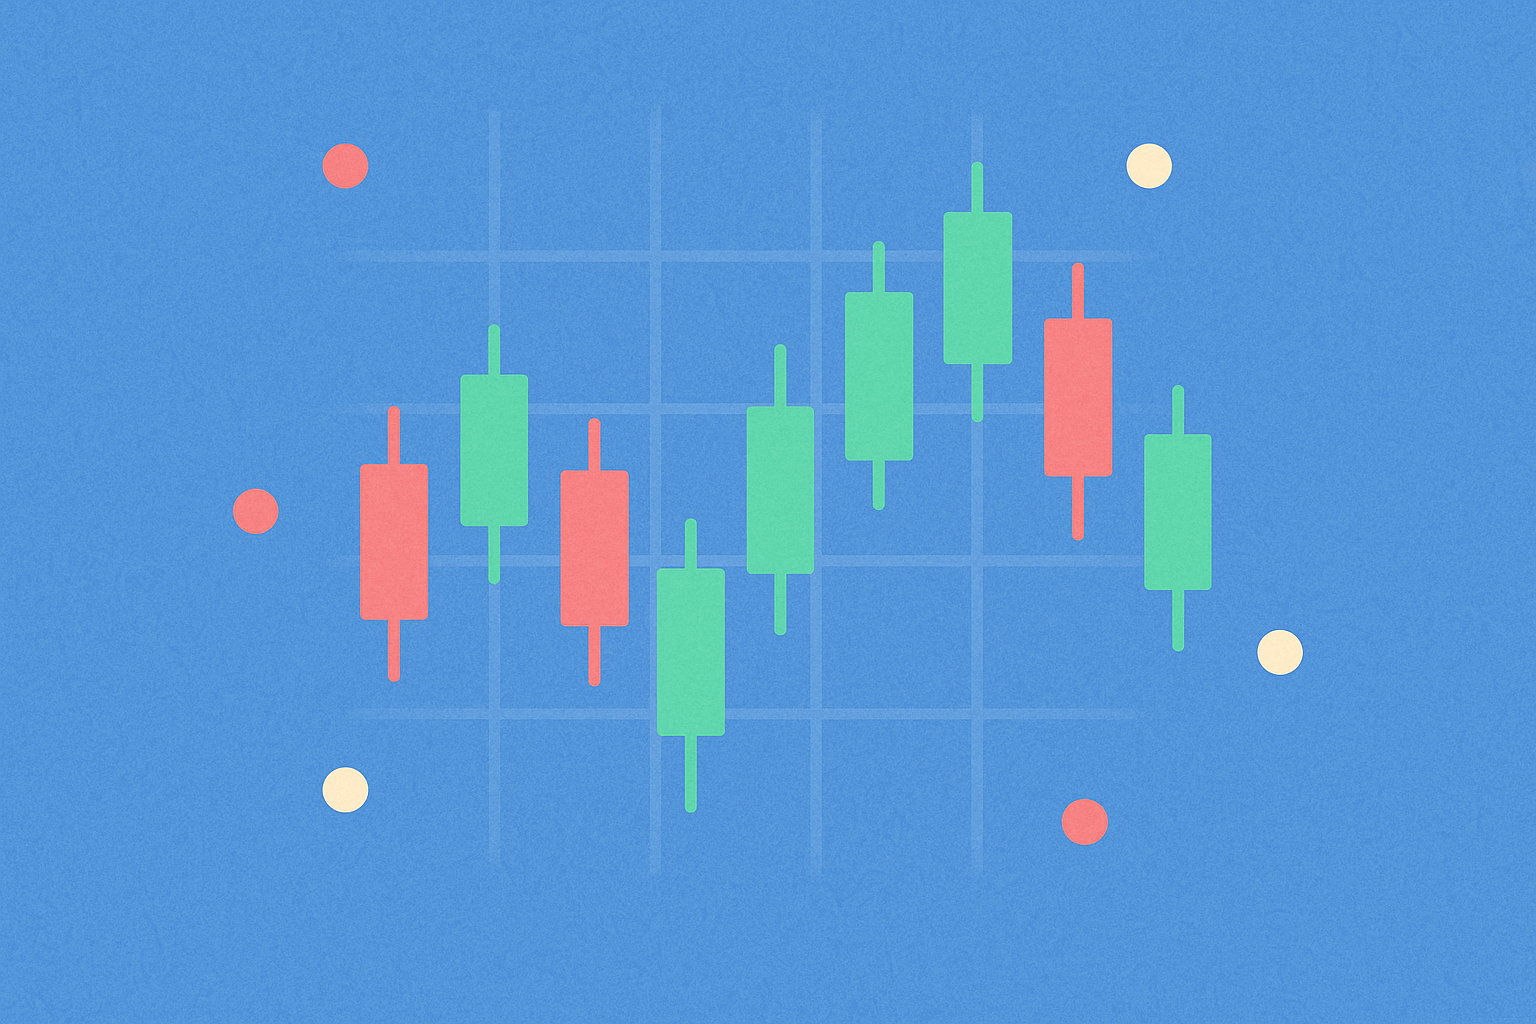
K线图以特定时间周期(如周、日、小时或分钟)展示价格变动,每根K线包含实体和上下影线两部分。
实体代表该周期内的开盘价与收盘价区间,上下影线则显示同期最高和最低价。实体颜色意义重大:绿色或白色代表上涨(多头),红色或黑色则表示下跌(空头)。
这种图形方式使交易者能迅速把握价格波动,识别市场趋势的转折或延续信号。
K线形态的解读方法
K线形态由多根K线按特定顺序组成,每种形态含义不同。有的反映买卖力量平衡,有的提示反转、趋势延续或市场犹豫。
需要强调,K线形态本身不是直接的买卖信号,而是分析价格行为和市场趋势的一套工具框架。有效交易需将形态置于更广泛市场环境中综合分析。
为降低交易风险,许多专业人士会将K线形态与Wyckoff Method、Elliott Wave Theory、Dow Theory等分析方法结合使用,同时配合趋势线、RSI、Stochastic RSI、Ichimoku Clouds、Parabolic SAR等技术指标,以及支撑位与阻力位等关键价格点共同分析。
多头K线形态
多头K线形态多见于下跌趋势底部或盘整阶段,通常预示价格有上行可能。
锤子线(Hammer):出现在跌势底部,特征是长下影线至少为实体两倍,显示尽管卖压沉重,买方仍能拉回价格接近开盘。绿色锤子线多头信号更强。
倒锤子线(Inverted Hammer):与锤子线相似但方向相反,长上影线出现在下跌尾端,暗示反转潜力。上影线说明跌势被遏制,买方力量逐渐增强。
三连阳(Three White Soldiers):连续三根绿色K线,每根开盘价在前一根实体内,收盘价高于前一根最高价,下影线极短或无,显示买盘强劲。实体越大,买方动能越旺。
多头孕线(Bullish Harami):一根长红K线后接一根完全包裹在前实体内的小绿K线,表明卖压减弱,有望反转上涨。
空头K线形态
空头K线形态多见于上涨趋势顶部或盘整期,通常预示价格可能下行。
上吊线(Hanging Man):与锤子线相对应,出现在涨势末端,实体小、长下影线,显示卖压增强但买方暂时拉回价格,暗示反转风险。
流星线(Shooting Star):长上影线、小实体位于底部,下影线极短或无,出现在涨势尾端,表明市场上攻后卖方主导,价格转跌,是下跌启动信号。
三连阴(Three Black Crows):三根连续红色K线,每根开盘价在前一根实体内,收盘价低于前一根最低价,无长上影线,显示卖压持续,形态及影线结构可判断跌势延续概率。
空头孕线(Bearish Harami):一根长绿K线后接一根完全包裹在前实体内的小红K线,常在涨势尾端出现,表明买盘转弱,卖方开始占优。
乌云盖顶(Dark Cloud Cover):红K线高开于前绿K线收盘价,但收盘低于前实体中点,若成交量大更具参考性,暗示多头转弱,部分交易者会等待下一根红K线确认。
趋势延续K线形态
趋势延续形态暗示现有趋势将继续发展。
上涨三法(Rising Three Methods):涨势中出现三根小红K线,随后一根大绿K线确认趋势延续,红K线未跌破前低,说明回调未破坏上升结构。
下跌三法(Falling Three Methods):与上涨三法相反,跌势中三根小绿K线后接一根大红K线,确认下跌持续。
十字星形态(Doji Candlestick Pattern):开盘和收盘价几乎相同或完全一致,虽有波动但最终收于开盘附近,显示多空力量均衡,具体解读需结合市场环境。
十字星变体包括墓碑十字星(长上影、开收盘价接近最低)、长腿十字星(上下影长、开收盘接近中点)、蜻蜓十字星(长下影、开收盘接近最高)。在数字资产市场,标准十字星较少,纺锤星(开收盘极为接近但不完全一致)常与十字星概念互换使用。
K线形态在加密货币交易中的应用
在数字资产和加密货币交易中有效利用K线形态需遵循如下原则:
夯实基础:交易者应先掌握K线图阅读方法、七种主要形态及各自意义,基础薄弱的交易风险极高。
多项指标联用:K线形态虽有参考价值,但不可单独使用,应结合均线、RSI、MACD等技术指标,提升分析准确性。
多周期分析:综合不同周期K线形态(如日线、小时线、15分钟线)有助于全面把握市场情绪与行情演变。
严格风险管理:任何交易均有风险,交易者需设置止损、控制仓位,避免过度交易,只布局风险收益合理的机会。
总结
K线形态是技术分析的基础工具,无论是否作为核心交易策略,理解它们都能带来收益。包括本文所述七大类型在内的K线形态,清晰反映市场心理和价格驱动力。值得注意的是,K线形态并非万能指标,必须与其他技术分析工具和风险管理配合使用。结合K线、技术指标、多周期分析和严格风险控制,交易者可构建更完善的策略,应对市场复杂性,降低潜在损失。
分享


2025年如何从加密货币交易所提取资金:初学者指南

2025年免费获取比特币的5种方法:新手指南

TOAD币是什么,其代币经济模型是如何运作的?

Treasure NFT市场:Web3玩家和投资者2025年指南

加密货币初学者教程:如何购买、存储和交易您的第一种加密货币
NEXPACE (NXPC)是什么,2025年它是如何工作的?

Gate Ventures 每周加密市场回顾(2026年3月23日)


Gate Ventures 每周加密市场回顾(2026年3月2日)
Gate Ventures 每周加密货币市场回顾(2026年2月23日)

Gate Ventures 本周加密货币回顾(2026年2月9日)
