ChiefOfStaffOfCrypto
現在、コンテンツはありません
ChiefOfStaffOfCrypto
📣3/20イーサリアムのトレンド詳細分析と堅実な運用アドバイスの共有:
昨日の空売りポジションが再び利益確定で決済されました!これまで何度も強調してきましたが、現在のイーサリアムのトレンドは依然として弱気です!4時間足は陰線で、終値は最安値付近、上ヒゲが長く、上値圧力が重いことを示しています。これまで連続して小さな実体のロウソク足が出現し、市場は揉み合いの弱い状態にあり、効果的な反発ができていません。日足チャートでは、出来高増加の大陰線(3月18日と3月19日)が強い下落トレンドを確認させています。最新の日足(3月20日)は十字星の形態で、取引量の縮小を伴い、短期的な下落エネルギーがやや緩和され、市場は調整または迷いの段階に入っていますが、全体的なトレンドは依然として弱気です。
4時間足のテクニカル指標から:MACDのDIF線とDEA線はともにゼロ軸下で推移し、DIF線は継続してDEA線の下に位置し、MACDのヒストグラムは負の値を示し、拡大し続けており、市場は明らかに空売りの勢いが強い下落トレンドにあります。RSIは39.84で、50以下にあり、市場は弱気のゾーンにあります。RSIは以前に短時間で過剰売り状態(35.03)に触れ、その後反発しましたが、持続せず、現在も過剰売り状態には入っていないため、下落余地はまだ残っている可能性があります。短期EMA7(2153.40)
ETH0.44%


- 報酬
- 2
- コメント
- リポスト
- 共有
📣3/19 Ethereum Trend Detailed Analysis and Sound Trading Recommendations:
From the four-hour price trend analysis: The K-line pattern on the 4H chart shows large bearish candles with massive volume appearing on March 18 at 20:00 and March 19 at 12:00, forming a sharp decline and confirming a reversal of the short-term trend. The current price is consolidating in a low area following the recent sharp decline, showing that short-term selling pressure has eased somewhat but overall weakness remains. The daily chart shows that after a sharp rally on March 16, a large bearish candle with massive
From the four-hour price trend analysis: The K-line pattern on the 4H chart shows large bearish candles with massive volume appearing on March 18 at 20:00 and March 19 at 12:00, forming a sharp decline and confirming a reversal of the short-term trend. The current price is consolidating in a low area following the recent sharp decline, showing that short-term selling pressure has eased somewhat but overall weakness remains. The daily chart shows that after a sharp rally on March 16, a large bearish candle with massive
ETH0.44%


- 報酬
- 1
- コメント
- リポスト
- 共有
📣通知:昨日と今日のイーサリアム空売りのお友達は全員利確で退場しました!
イーサリアムは連日の空売りで利益を確定し、退場しています。現在のトレンドを見ると、空頭トレンドはまだ継続中です...空売りで損失を抱えている方も心配しなくて大丈夫です。どうやって損益を解消すればいいかわからない方は、いつでも私にご相談ください!
現在価格:2240.20 USDT、日内下落87.28(-3.75%)、短期的には空頭優勢です。高値・安値:日内最高2356.66、最安2221.23、価格は最近の横ばいレンジの下限を割り込み、調整幅がかなり大きくなっています。
4時間足のイーサリアム指標分析から:ボリンジャーバンド(BOLL)中軌:2264.73、現在の価格は中軌の下に位置し、短期トレンドの弱まりを示しています。上軌:2421.09、下軌:2108.36、価格は上軌付近の高値から急速に下落し、ボリンジャーバンドの開きが下方向に拡大しており、空売りの勢いが放出されつつあります。MACD DIF:46.17、DEA:57.13、MACDヒストグラム:-21.91、DIFがDEAを下抜きデッドクロスを形成し、緑柱が継続的に拡大していることから、多頭の勢いが衰え、空頭トレンドが確定しています。短期的には下落圧力が依然として存在します。KDJ:K値27.50、D値43.56、J値-4.63、J値はすでに売ら
ETH0.44%
- 報酬
- 1
- コメント
- リポスト
- 共有
📣3/18 イーサリアムのトレンド詳細分析と堅実なレイアウト戦略の共有:
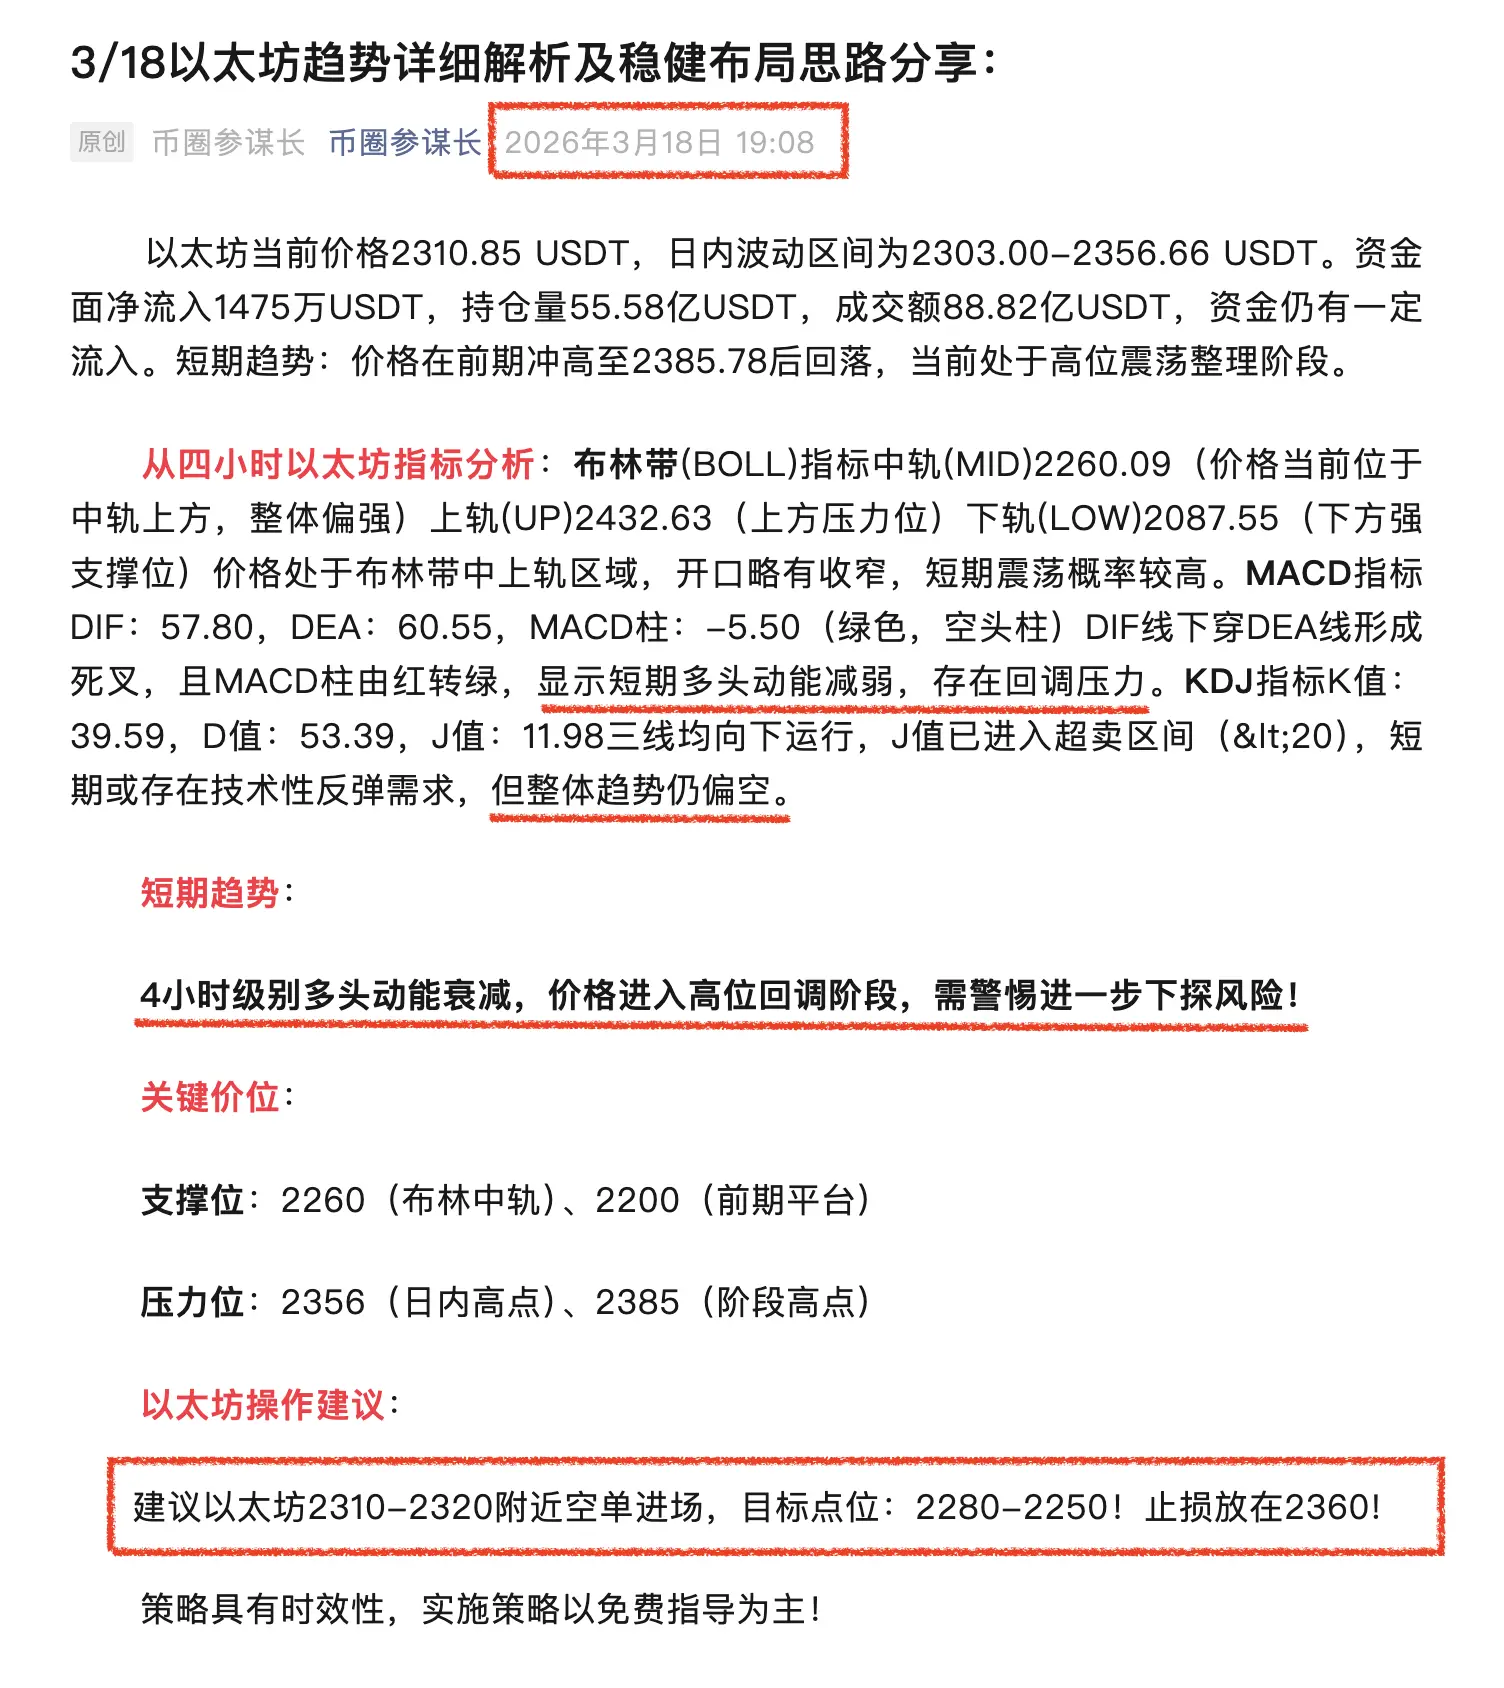
現在のイーサリアムの価格は2310.85 USDTで、日内の変動範囲は2303.00-2356.66 USDTです。資金の純流入は1475万USDT、ポジション数は55.58億USDT、取引高は88.82億USDTで、資金は引き続き流入しています。短期的なトレンド:価格は以前の高値2385.78に達した後に調整局面に入り、現在は高値圏での震荡整理段階にあります。
4時間足のイーサリアム指標分析:ボリンジャーバンド(BOLL)の中軌線(MID)は2260.09(現在の価格は中軌線より上に位置し、全体的に強気)上軌線(UP)は2432.63(上値抵抗ライン)下軌線(LOW)は2087.55(強力な下支えライン)で、価格はボリンジャーバンドの中上軌線付近にあり、開口部はやや狭まりつつあり、短期的な震荡の可能性が高いです。MACD指標:DIFは57.80、DEAは60.55、MACDヒストグラムは-5.50(緑色、弱気のヒストグラム)。DIF線がDEA線を下抜けてデスクロスを形成し、MACDヒストグラムも赤から緑に変わり、短期的な買い圧力の弱まりと調整圧力を示しています。KDJ指標:K値39.59、D値53.39、J値11.98の三線はすべて下向きに推移しており、J値はすでに売り過ぎゾーン(<20)に入りつつありま
ETH0.44%

- 報酬
- いいね
- コメント
- リポスト
- 共有
📣3/17イーサリアムリアルタイムトレンド詳細分析および堅実なトレード推奨事項の共有:
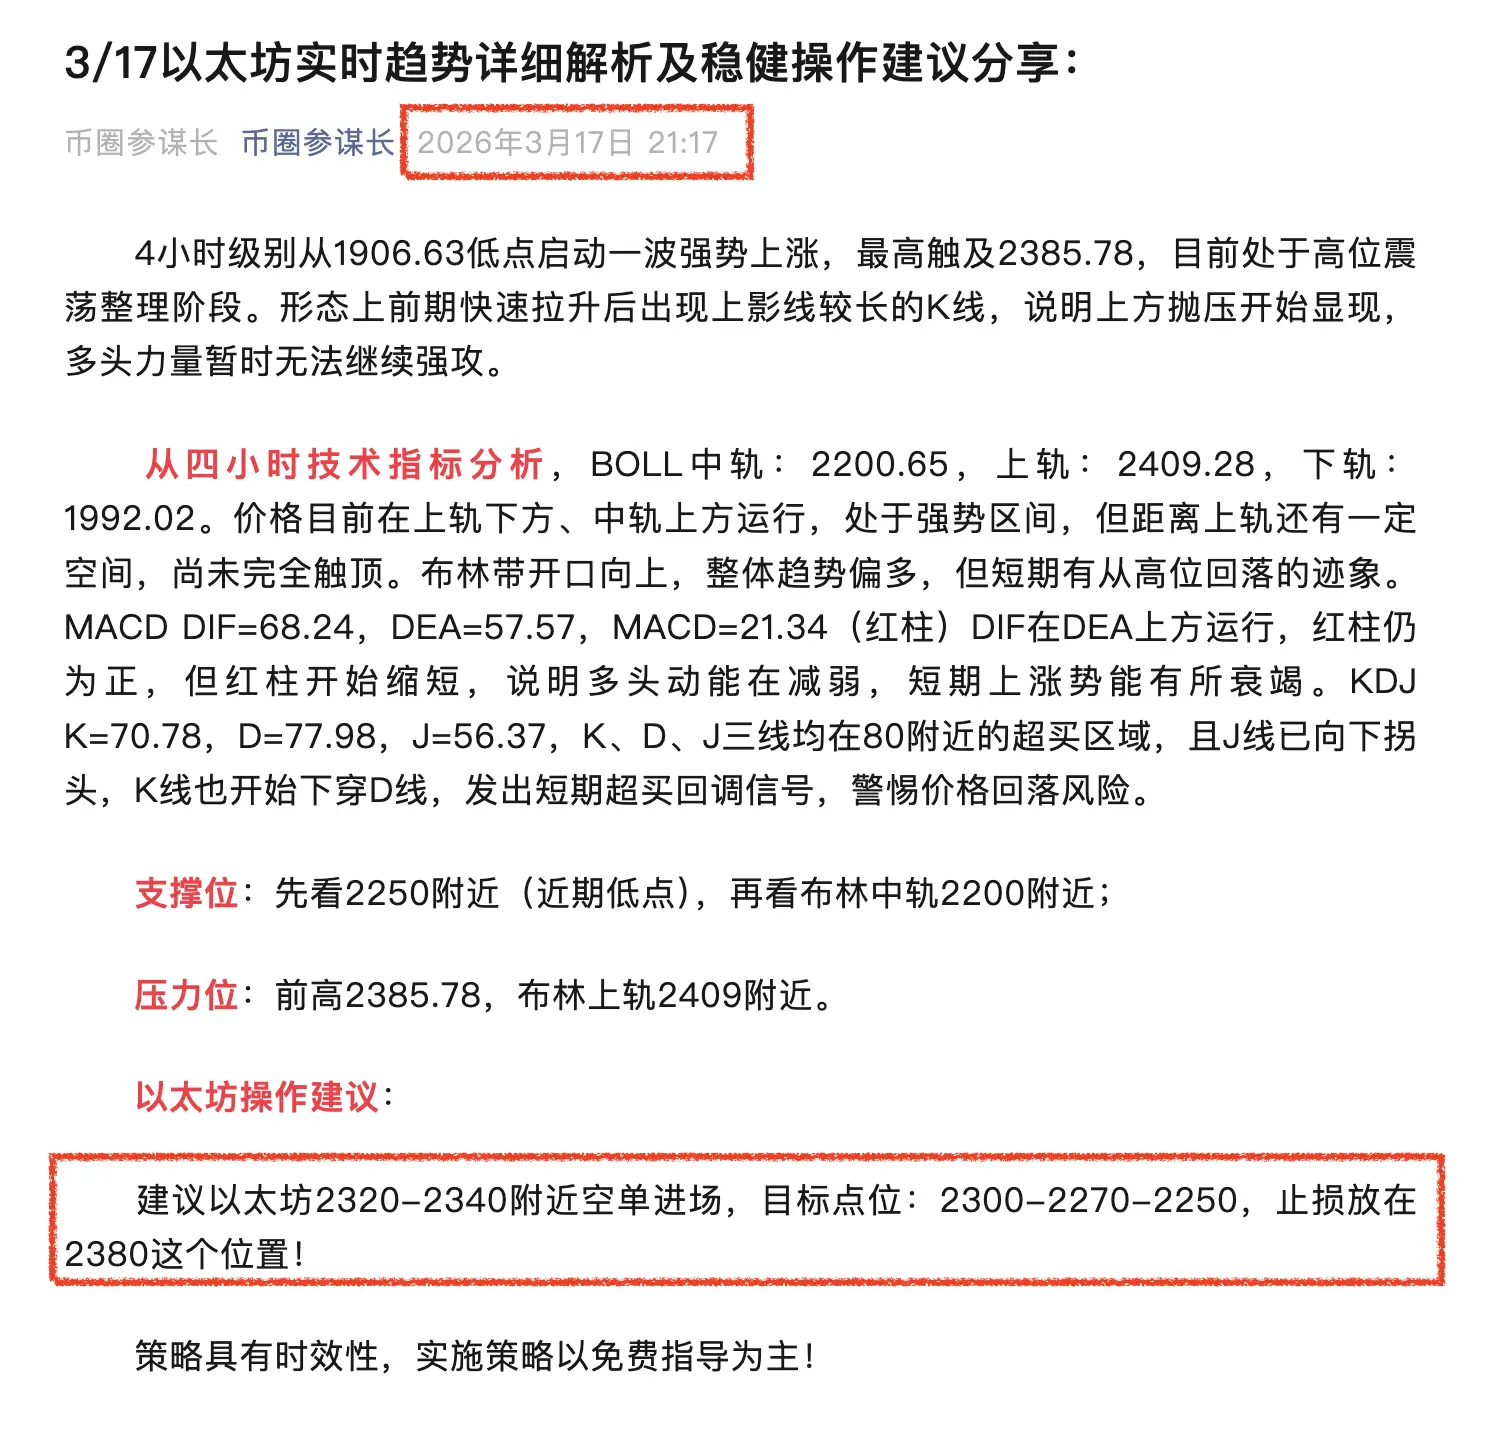
4時間足は1906.63の安値から力強い上昇波動を開始し、最高値2385.78に到達しており、現在は高値圏での揉み合い整理段階にあります。形態上、前回の急騰後に長い上ヒゲを持つローソク足が現れ、上値の売り圧力が顕在化し始めており、買い勢力は一時的に攻勢を続けることが難しい状況を示しています。
4時間足のテクニカル指標分析から、ボリンジャーバンドの中値は2200.65、上値は2409.28、下値は1992.02です。現在の価格は上値の少し下、かつ中値の少し上で推移しており、強気の範囲内にありますが、上値までにはまだ余裕があり、完全に天井に達しているわけではありません。ボリンジャーバンドは上向きに開いており、全体的なトレンドは強気寄りですが、短期的には高値からの下落兆候も見られます。MACDのDIFは68.24、DEAは57.57、MACDヒストグラムは21.34(赤色柱)で、DIFはDEAの上に位置し、赤柱は依然正の状態を保っていますが、短縮し始めており、買い勢力の勢いが弱まりつつあることを示しています。短期的な上昇エネルギーは衰えつつあります。KDJのKは70.78、Dは77.98、Jは56.37で、三本線とも80付近の過熱域にあり、J線はすでに下向きに折れ、K線もD線を下抜きし始めて
ETH0.44%


- 報酬
- 1
- コメント
- リポスト
- 共有
📣3/17 イーサリアムのトレンド深度分析と今後のリスク提言の共有:
チャートから見ると、イーサリアムは最近の安値から上昇を開始し、その後一方通行のショートスクイーズの動きを示しており、4時間足では連続陽線で上昇し、価格はすべての移動平均線の上に位置し、メインチャートの平均線は標準的な強気の並びを示しています。現状、全体のトレンドは崩れていませんが、短期的には上昇幅が大きいため、テクニカル的な調整の必要性があります。以下は詳細な動きの分析と操作のアドバイスです。
テクニカル指標の詳細分析
ボリンジャーバンド(BOLL)
現状:価格(2329.76)はボリンジャーバンドの上限(UP:2379.81)に密着して推移し、上限のバンドは上向きに乖離しています。
解釈:これは典型的な強気の一方通行相場の特徴です。価格が上限に沿って動いていることは、買い手の勢力が非常に強いことを示していますが、同時に買われ過ぎの領域にあることも意味します。
リスク:現在の価格は上限よりやや下に位置し、小幅な調整や下ヒゲの出現も見られるため、2380-2390のゾーンには強い売り圧力が存在し、短期的には直線的な上昇は難しく、むしろ中値(MID:2177.56)付近まで押し戻されて再度蓄積される可能性が高いです。
MACD(移動平均収束拡散法)
現状:DIF(69.06)とDEA
ETH0.44%


- 報酬
- いいね
- コメント
- リポスト
- 共有
📣3/16イーサリアムのトレンド詳細分析と堅実な操作アドバイスの共有:
4時間足のイーサリアム価格トレンド分析:ローソク足の形状:4時間足の価格は連続して陽線を形成し、実体が充実しており、買い手の勢いが優勢であることを示しています。市場は強い上昇局面にあります。最新のローソク足の終値は高値に近づき、買い意欲が強い状態です。日足は連続して3本の大陽線を形成し、力強い上昇トレンドを示し、最近のすべての高値を突破しています。これにより、日足レベルでの買いトレンドが加速していることがわかります。
4時間足のテクニカル指標から:MACD:DIF線とDEA線はともにゼロラインの上で持続的に上方に拡散し、MACDのヒストグラムは正の値を示し、拡大し続けています。これは買い勢力が十分にあり、上昇トレンドが明確であることを示しています。RSI:RSI値(77.68)はすでに買われすぎの領域に入り、複数のローソク足を維持しています。取引ロジックによると、これは市場が強気のトレンドにあることを示し、すぐに反転するシグナルではありません。EMA7(2198.31)、EMA30(2114.34)、EMA120(2056.31)は完璧な買いの順番に並び、移動平均線のグループは上方に拡散しており、価格に堅実なサポートを提供しています。トレンドは非常に健全です。4時間足のチャート:価格の上昇初期には出来
原文表示4時間足のイーサリアム価格トレンド分析:ローソク足の形状:4時間足の価格は連続して陽線を形成し、実体が充実しており、買い手の勢いが優勢であることを示しています。市場は強い上昇局面にあります。最新のローソク足の終値は高値に近づき、買い意欲が強い状態です。日足は連続して3本の大陽線を形成し、力強い上昇トレンドを示し、最近のすべての高値を突破しています。これにより、日足レベルでの買いトレンドが加速していることがわかります。
4時間足のテクニカル指標から:MACD:DIF線とDEA線はともにゼロラインの上で持続的に上方に拡散し、MACDのヒストグラムは正の値を示し、拡大し続けています。これは買い勢力が十分にあり、上昇トレンドが明確であることを示しています。RSI:RSI値(77.68)はすでに買われすぎの領域に入り、複数のローソク足を維持しています。取引ロジックによると、これは市場が強気のトレンドにあることを示し、すぐに反転するシグナルではありません。EMA7(2198.31)、EMA30(2114.34)、EMA120(2056.31)は完璧な買いの順番に並び、移動平均線のグループは上方に拡散しており、価格に堅実なサポートを提供しています。トレンドは非常に健全です。4時間足のチャート:価格の上昇初期には出来


- 報酬
- 1
- コメント
- リポスト
- 共有
📣3/16早朝のイーサリアムのトレンド詳細分析と堅実な操作アドバイスの共有:
4時間足のイーサリアム価格動向分析:4時間足のローソク足チャートと日足チャートの両方において、強い上昇トレンドの陽線パターンが示されている。最近の4時間足と日足のローソク足はともに大陽線で、終値が高値付近に位置し、買い手の勢力が優勢であることを示している。価格は最近の複数の高値を突破しており、上昇トレンドの継続性を示唆している。
4時間足のテクニカル指標:MACD:4時間足のMACD指標では、DIF線がDEA線の上に位置し、MACDヒストグラムは正の値を維持し拡大し続けていることから、現在の買い圧力は強く、トレンドは加速していることを示している。RSI:4時間足のRSI値は70.1で、買われ過ぎゾーンに入ったばかりである。これは短期的に調整リスクが存在する可能性を示唆するが、RSIが引き続き買われ過ぎゾーンにとどまる場合、強い上昇トレンドが継続していることを意味する。EMA:価格はすべての短期、中期、長期EMA(EMA7、EMA30、EMA120)を大きく上回っており、EMAは多頭排列(強気の並び)を示しているため、現在の強い上昇トレンドを明確に示している。EMA7(2123.8)とEMA30(2084.6)は潜在的なサポートラインとなる。
イーサリアムの取引操作アドバイス:
イーサリア
原文表示4時間足のイーサリアム価格動向分析:4時間足のローソク足チャートと日足チャートの両方において、強い上昇トレンドの陽線パターンが示されている。最近の4時間足と日足のローソク足はともに大陽線で、終値が高値付近に位置し、買い手の勢力が優勢であることを示している。価格は最近の複数の高値を突破しており、上昇トレンドの継続性を示唆している。
4時間足のテクニカル指標:MACD:4時間足のMACD指標では、DIF線がDEA線の上に位置し、MACDヒストグラムは正の値を維持し拡大し続けていることから、現在の買い圧力は強く、トレンドは加速していることを示している。RSI:4時間足のRSI値は70.1で、買われ過ぎゾーンに入ったばかりである。これは短期的に調整リスクが存在する可能性を示唆するが、RSIが引き続き買われ過ぎゾーンにとどまる場合、強い上昇トレンドが継続していることを意味する。EMA:価格はすべての短期、中期、長期EMA(EMA7、EMA30、EMA120)を大きく上回っており、EMAは多頭排列(強気の並び)を示しているため、現在の強い上昇トレンドを明確に示している。EMA7(2123.8)とEMA30(2084.6)は潜在的なサポートラインとなる。
イーサリアムの取引操作アドバイス:
イーサリア


- 報酬
- いいね
- 1
- リポスト
- 共有
ChiefOfStaffOfCrypto:
根单 威信恭中号
币圈参谋长
📣3/13イーサリアムのトレンド詳細分析と堅実な運用アドバイスの共有:
4時間足のイーサリアム価格トレンド分析:4時間足のローソク足チャートでは、最新のローソク足は長い上ヒゲを持つ陽線であり、最高値は2148.8に達し、終値は2103.22で引けていることから、買い手の勢いは強いものの、上値には売り圧力が存在していることを示しています。日足チャートは連日陽線を続けており、明確な上昇トレンドを形成し、市場全体の強気ムードを示しています。
4時間足のテクニカル指標:MACDの4時間足チャートにおいて、DIF線とDEA線はともにゼロラインより上に位置し、DIF線がDEA線を上抜き、上方に持続的に拡散している状態です。MACDヒストグラムは正の値を示し、増加傾向にあります。これにより、買い勢力のモメンタムが強く、トレンドは上昇方向にあります。RSI4時間足のRSI値は62.97で、強気ゾーンにありますが、まだ買われ過ぎの領域には達していません。したがって、市場にはまだ上昇余地がありつつも、今後のモメンタムの変化には注意が必要です。EMAについては、4時間足のEMA7(2071.47)はEMA30(2038.89)およびEMA120(2028.55)の上に位置し、多頭の並びを形成しています。価格はすべての移動平均線よりも上にあり、トレンドは明確に上向きです。EMA7は短期的なサポー
ETH0.44%


- 報酬
- 1
- 4
- リポスト
- 共有
ElementInvestigation:
みんな全然話さないね。こんなに閲覧数が多いのに、参謀兄貴はなぜ投稿しないの?私も参謀兄貴のペースに合わせてるよ😁もっと見る
📣3/12早朝のイーサリアムのトレンド詳細分析と堅実な操作提案の共有:
四時間足のイーサリアム価格動向分析:ローソク足の形態:4時間足チャートは、出来高増加後の最新のローソク足が長い影線を持つ十字線(スピンドル)であることを示しており、買い手と売り手の間に意見の相違が存在し、短期的な調整局面に入っていることを示唆している。前のローソク足は長い下影線を持つ陰線であり、下値に一定の支持があることを示している。日足チャートは連続した陽線を示し、強い上昇トレンドを示唆しているが、今日のローソク足は小さな陰線であり、短期的な調整を示す可能性がある。
四時間足のテクニカル指標から:MACD(4時間足)DIF線はDEA線の上に位置し、MACDヒストグラムは正の値を示しており、買い圧力の継続を示している。しかし、DIFとMACDヒストグラムの値はやや収束しており、上昇エネルギーはやや弱まっている。RSI(4時間足)は過買いゾーン(60.59)から中立ゾーン(54.60)に下落しており、「RSIの値がちょうど過買い・過売りゾーンに入り、調整が発生する可能性がある」という論理に符合し、短期的な調整を示唆している。EMA(4時間足)の価格はEMA7(2045.98)、EMA30(2024.06)、EMA120(2024.51)の上に位置し、すべての移動平均線は買い圧力を示す多頭排列(多頭配列)
ETH0.44%


- 報酬
- 3
- 2
- リポスト
- 共有
ElementInvestigation:
快上車!🚗もっと見る
📣通知:イーサリアムは2080に到達しました。夜間のロングポジションの皆さんは全て利確して退出してください!
夜間はイーサリアムのトレンドチャートと各種指標、そして夜間のCPIデータを詳細に解析し、2000-2010付近でロングエントリーを推奨します。目標価格は2040、2060、2080です。目標の2080には見事に到達し、すべてのポジションを利確して退出しました!
現時点のトレンドから見ると、イーサリアムの短期的な抵抗ラインは2100付近(これもイーサリアムの強気転換点)です。2100で安定した後は、引き続きロングを試みても良いでしょう!
戦略には時効性があるため、無料ガイダンスを中心に実施します!#伊朗在霍尔木兹海峡布设水雷 #原油价格回落 #高盛成XRP现货ETF最大持有机构 #微策略再砸12.8亿美元增持BTC
原文表示夜間はイーサリアムのトレンドチャートと各種指標、そして夜間のCPIデータを詳細に解析し、2000-2010付近でロングエントリーを推奨します。目標価格は2040、2060、2080です。目標の2080には見事に到達し、すべてのポジションを利確して退出しました!
現時点のトレンドから見ると、イーサリアムの短期的な抵抗ラインは2100付近(これもイーサリアムの強気転換点)です。2100で安定した後は、引き続きロングを試みても良いでしょう!
戦略には時効性があるため、無料ガイダンスを中心に実施します!#伊朗在霍尔木兹海峡布设水雷 #原油价格回落 #高盛成XRP现货ETF最大持有机构 #微策略再砸12.8亿美元增持BTC

- 報酬
- 1
- コメント
- リポスト
- 共有
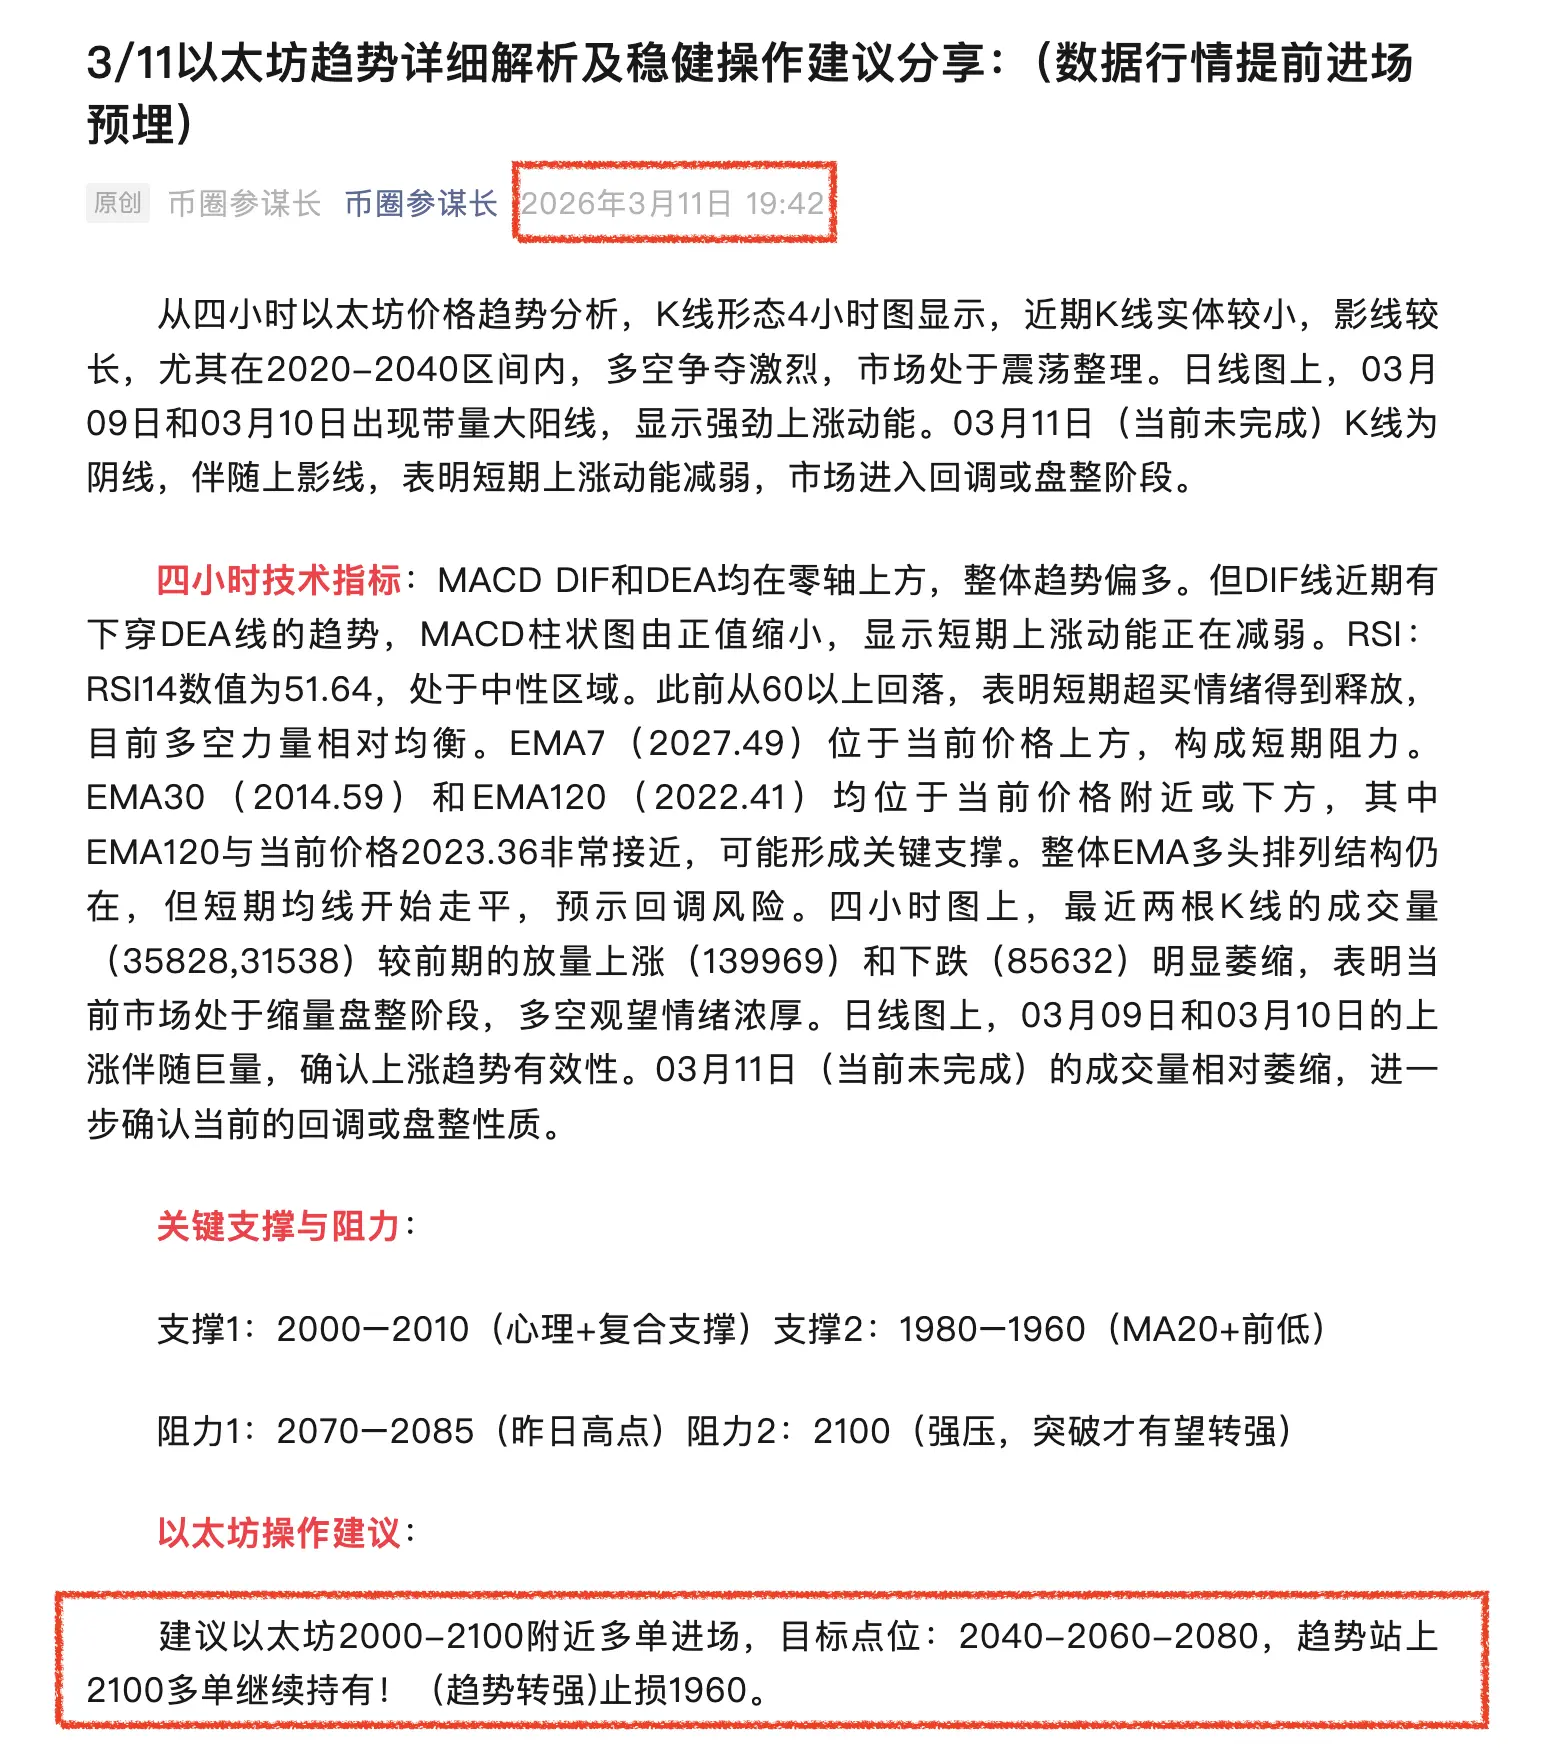
📣3/11のイーサリアムのトレンド詳細分析と堅実な操作アドバイスの共有:(データ相場は事前にエントリーし埋め込み済み)
4時間足のイーサリアム価格トレンド分析によると、4時間足チャートのK線の形態は、最近のK線は実体が小さく、影線が長い。特に2020-2040の範囲内では、多空の争いが激しく、市場は震荡整理局面にある。日足チャートでは、3月9日と3月10日に大陽線を伴う出来高増加が見られ、強い上昇エネルギーを示している。3月11日(未完成)は陰線で、上影線を伴い、短期的な上昇エネルギーの弱まりを示し、市場は調整またはレンジ相場に入っている。
4時間足のテクニカル指標:MACDのDIFとDEAはともにゼロ軸の上に位置し、全体的なトレンドは強気だ。ただし、DIF線は最近DEA線を下抜ける傾向にあり、MACDのヒストグラムは正の値から縮小しており、短期的な上昇エネルギーが弱まっていることを示す。RSI:RSI14の値は51.64で、中立域にある。以前は60以上から下落しており、短期的な買われ過ぎの状態が解消されつつあることを示す。現在は買いと売りの力が相対的に均衡している。EMA7(2027.49)は現在の価格より上に位置し、短期的な抵抗となる。EMA30(2014.59)とEMA120(2022.41)はともに現在の価格付近または下に位置し、特にEMA120の2023.36は
ETH0.44%


- 報酬
- いいね
- コメント
- リポスト
- 共有
イーサリアムの強気トレンドはまだ継続中であり、現在のトレンドは上昇中の調整と底固めの段階です!
|
昨日、イーサリアムのロングポジションは再び利確して退出しましたが、イーサリアムの強気トレンドは依然として続いています!4時間足のテクニカル指標を見ると、ボリンジャーバンド(4時間)価格はミドルライン(1991)より上で推移し、上バンド2075、下バンド1908のバンド幅は縮小しています:ボラティリティが低下しており、方向性を選択しようとしています。移動平均線システム(EMA)は短期EMA(7/14)が上方に拡散し、価格はEMAの上に位置し、強気の構造は崩れておらず、中期EMA(30)は横ばいで、明らかなレンジ相場の特徴を示しています。重要なポイント:2000を守れば強気優勢;1970を割ると弱気に転じます。MACD(4時間)DIFはDEAの上にあり、ゴールデンクロス状態ですが、ヒストグラムの赤柱は縮小しています。シグナル:上昇エネルギーは弱まり、レンジ調整に入り、非トレンドの下落です。RSIと出来高RSIは約55–60で、中立範囲、買われ過ぎや売られ過ぎはありません。出来高:縮小しながらの調整で、上昇途中の健全な押し目です。
コアレンジ範囲:1970–2080 USDT
短期サポート:2000、1970、1950、1908
短期レジスタンス:2065–2080、2100、2140
4
原文表示|
昨日、イーサリアムのロングポジションは再び利確して退出しましたが、イーサリアムの強気トレンドは依然として続いています!4時間足のテクニカル指標を見ると、ボリンジャーバンド(4時間)価格はミドルライン(1991)より上で推移し、上バンド2075、下バンド1908のバンド幅は縮小しています:ボラティリティが低下しており、方向性を選択しようとしています。移動平均線システム(EMA)は短期EMA(7/14)が上方に拡散し、価格はEMAの上に位置し、強気の構造は崩れておらず、中期EMA(30)は横ばいで、明らかなレンジ相場の特徴を示しています。重要なポイント:2000を守れば強気優勢;1970を割ると弱気に転じます。MACD(4時間)DIFはDEAの上にあり、ゴールデンクロス状態ですが、ヒストグラムの赤柱は縮小しています。シグナル:上昇エネルギーは弱まり、レンジ調整に入り、非トレンドの下落です。RSIと出来高RSIは約55–60で、中立範囲、買われ過ぎや売られ過ぎはありません。出来高:縮小しながらの調整で、上昇途中の健全な押し目です。
コアレンジ範囲:1970–2080 USDT
短期サポート:2000、1970、1950、1908
短期レジスタンス:2065–2080、2100、2140
4

- 報酬
- 2
- コメント
- リポスト
- 共有
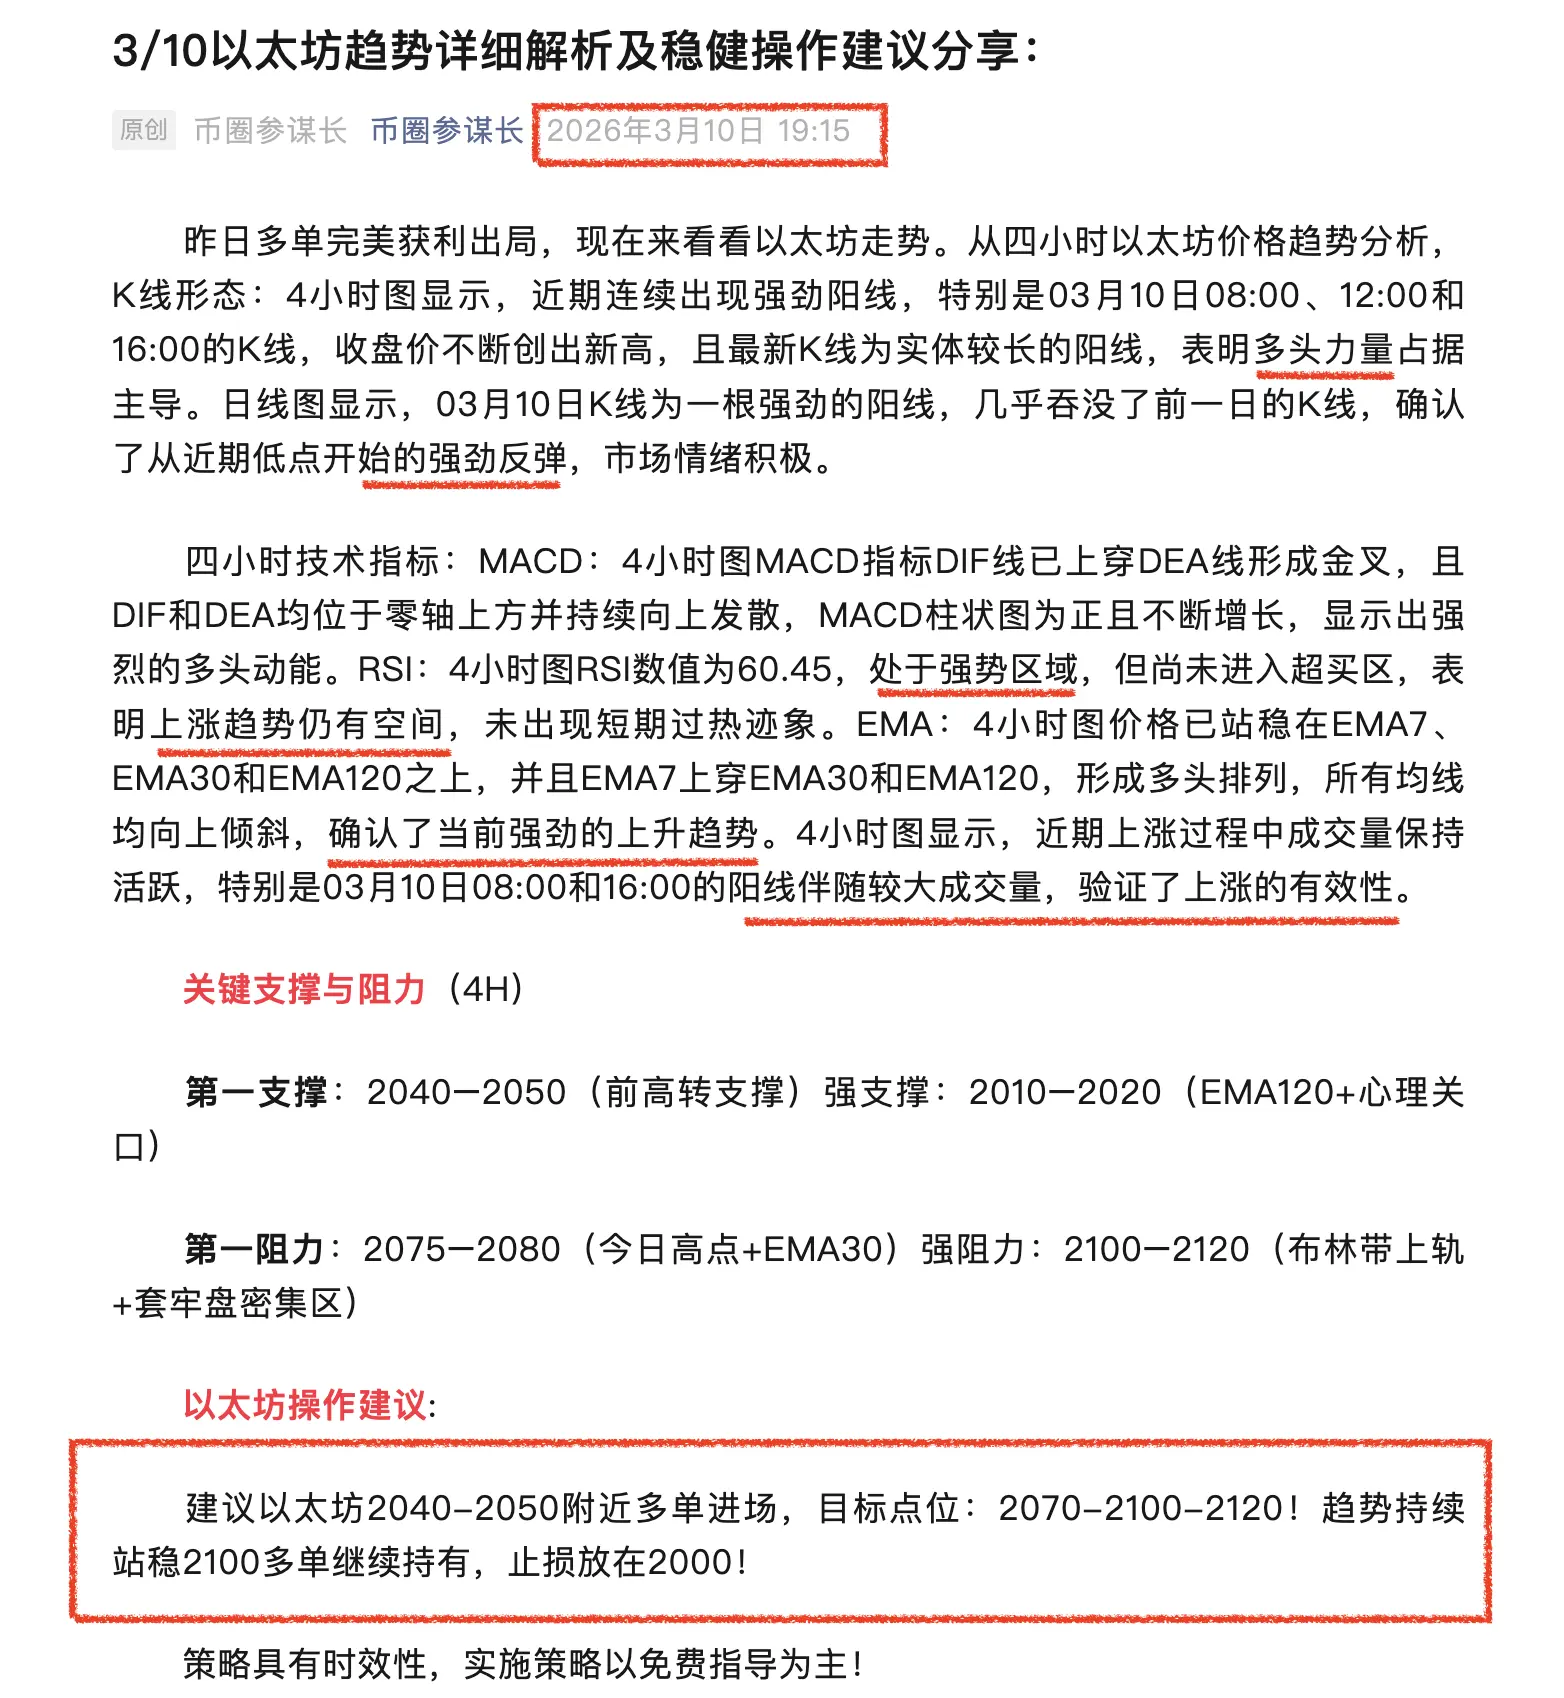
📣3/10イーサリアムのトレンド詳細分析と堅実な操作アドバイスの共有:
昨日のロングポジションは完璧に利益確定できました。次にイーサリアムの動きを見てみましょう。4時間足の価格動向分析によると、K線の形態は次の通りです:4時間足チャートでは、最近連続して強い陽線が出現しています。特に3月10日08:00、12:00、16:00のK線は、終値が次々と新高値を更新し、最新のK線は実体の長い陽線となっており、買い手の勢いが優勢であることを示しています。日足チャートでは、3月10日のK線は強い陽線で、ほぼ前日のK線を飲み込み、最近の安値からの強い反発を確認し、市場のセンチメントは積極的です。
4時間足のテクニカル指標:MACD:4時間足のMACD指標では、DIF線がDEA線を上抜きゴールデンクロスを形成しています。また、DIFとDEAはともにゼロラインの上に位置し、上昇を続けています。MACDのヒストグラムは正の値を示し、増加傾向にあります。RSI:4時間足のRSI値は60.45で、強気ゾーンにありますが、買われ過ぎには達していません。これは上昇トレンドにまだ余地があり、短期的な過熱感は見られないことを示しています。EMA:4時間足の価格はEMA7、EMA30、EMA120の上にしっかりと位置しており、EMA7がEMA30とEMA120を上抜き、多頭の並びを形成しています。すべての移動平
ETH0.44%

- 報酬
- 1
- コメント
- リポスト
- 共有
📣3/9以太坊のトレンド詳細分析と堅実な操作アドバイスの共有!
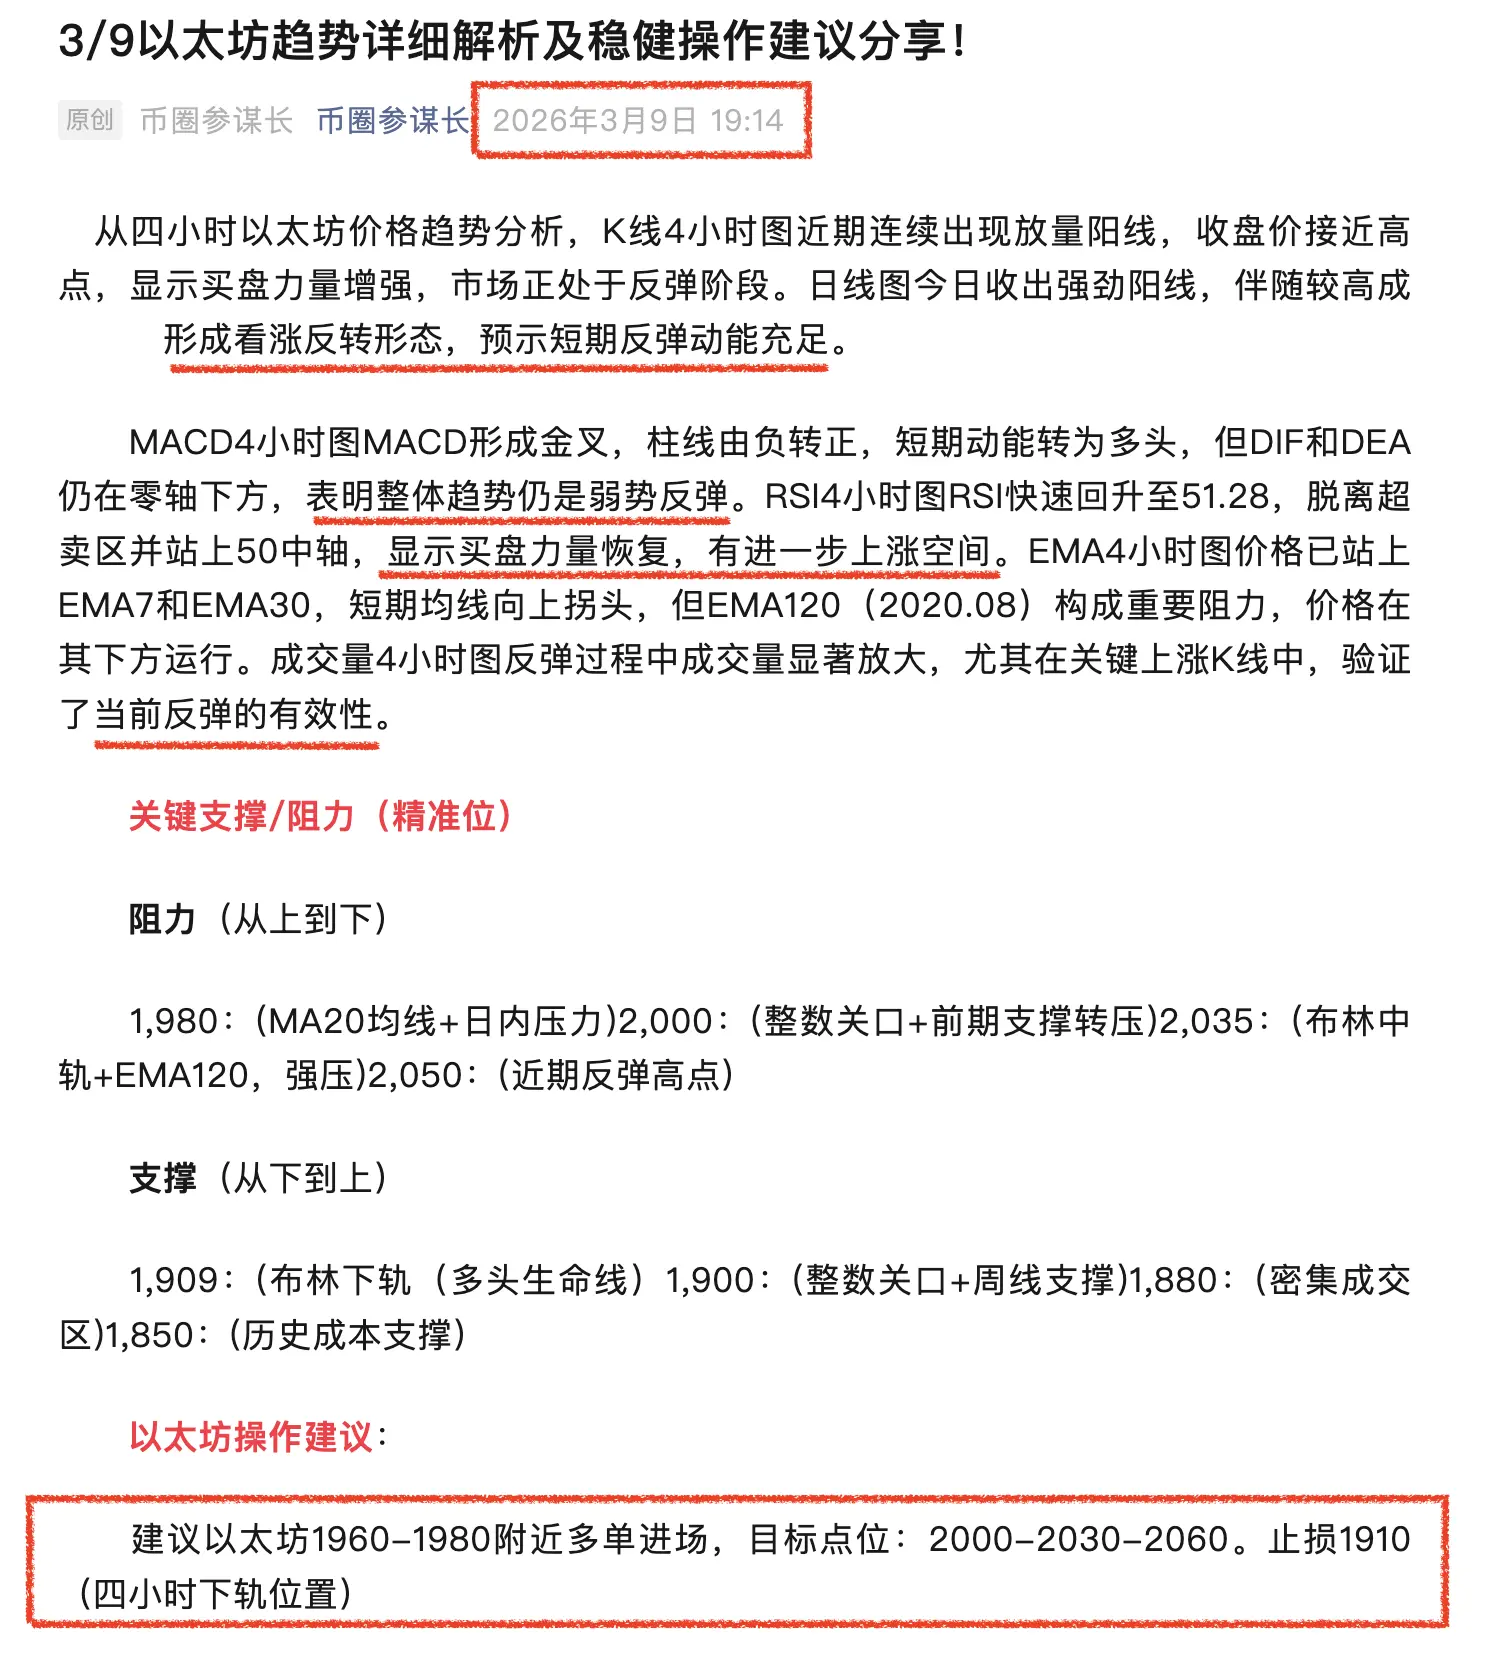
四時間足のイーサリアム価格動向分析によると、4時間チャートのK線では最近連続して陽線が放量で出現し、終値は高値に近づいています。これは買い圧力の強化を示し、市場は反発段階にあります。日足チャートでは本日強い陽線を形成し、比較的高い取引量を伴い、強気の反転パターンを形成しており、短期的な反発エネルギーは十分です。
MACD4時間足ではMACDがゴールデンクロスを形成し、ヒストグラムは負から正に転じており、短期的な勢いは買い側に傾いていますが、DIFとDEAは依然としてゼロライン下にあり、全体的なトレンドは弱気の反発と示唆しています。RSI4時間足ではRSIが急速に51.28まで回復し、売られ過ぎゾーンから抜け出し、50の中軸を超えています。これにより買い圧力の回復を示し、さらなる上昇余地があります。EMA4時間足では価格はすでにEMA7とEMA30を超えており、短期移動平均線は上向きに折れ曲がっていますが、EMA120(2020.08)は重要な抵抗線となっており、価格はその下で推移しています。4時間足の出来高は反発過程で著しく拡大し、特に重要な上昇K線では反発の有効性を裏付けています。
重要なサポート/レジスタンス(正確な位置)
レジスタンス(上から下へ)
1,980:(MA20移動平均線+日内圧力
2,000:)
ETH0.44%


- 報酬
- いいね
- コメント
- リポスト
- 共有
📣3/6 以太坊のトレンド詳細分析と堅実な操作提案の共有:
4時間足のイーサリアム価格トレンド分析によると、K線の形態は最近長い実体の陰線が連続して現れ、売り手の勢力が支配的であることを示しています。特に03月06日16:00のK線は、高値から大きく下落し、終値は最安値付近にあり、比較的大きな取引量を伴っており、弱気の形態を形成しています。現在のK線(03月06日20:00)は引き続き陰線を形成し、下落トレンドの継続を示しています。日足チャートには巨大な陽線が現れましたが、その後03月05日と03月06日に連続して大陰線が出現し、03月05日の大陰線はほぼ前日の上昇分を飲み込み、強い弱気の反転パターンを形成しています。これは、市場が急激な上昇を経験した後、強力な売り圧力に直面し、現在は調整段階にあることを示しています。
4時間足のテクニカル指標MACDでは、DIF線がDEA線を下抜けてデッドクロスを形成し、MACDのヒストグラムはゼロ軸下で拡大し続けており、弱気の勢いが強く、トレンドは下向きです。RSI値は買われ過ぎゾーン(71.09)から急速に48.84に下落し、現在は中立からやや弱気の領域にあり、売られ過ぎには至っていません。これは依然として下落余地があることを示唆しています。EMA価格はEMA7とEMA30を下回り、EMA120(2036.85)のサポートをテスト中
原文表示4時間足のイーサリアム価格トレンド分析によると、K線の形態は最近長い実体の陰線が連続して現れ、売り手の勢力が支配的であることを示しています。特に03月06日16:00のK線は、高値から大きく下落し、終値は最安値付近にあり、比較的大きな取引量を伴っており、弱気の形態を形成しています。現在のK線(03月06日20:00)は引き続き陰線を形成し、下落トレンドの継続を示しています。日足チャートには巨大な陽線が現れましたが、その後03月05日と03月06日に連続して大陰線が出現し、03月05日の大陰線はほぼ前日の上昇分を飲み込み、強い弱気の反転パターンを形成しています。これは、市場が急激な上昇を経験した後、強力な売り圧力に直面し、現在は調整段階にあることを示しています。
4時間足のテクニカル指標MACDでは、DIF線がDEA線を下抜けてデッドクロスを形成し、MACDのヒストグラムはゼロ軸下で拡大し続けており、弱気の勢いが強く、トレンドは下向きです。RSI値は買われ過ぎゾーン(71.09)から急速に48.84に下落し、現在は中立からやや弱気の領域にあり、売られ過ぎには至っていません。これは依然として下落余地があることを示唆しています。EMA価格はEMA7とEMA30を下回り、EMA120(2036.85)のサポートをテスト中


- 報酬
- 3
- コメント
- リポスト
- 共有
📣3/3 以太坊のトレンド詳細分析と堅実な操作提案の共有:
以太坊の価格動向分析によると、4時間足のローソク足チャートは、価格が高値2089付近から急落し、複数の大陰線が連続して出現していることを示しています。特に3月3日16:00と20:00のローソク足は、売り圧力が支配的で、市場は短期的な下落トレンドにあります。日足チャートでは、3月3日に大陰線が形成され、その終値は始値を大きく下回り、3月2日の上昇の大部分を飲み込み、弱気の包み足または雲頂パターンを構成しています。これは短期的に市場が深い調整やトレンド反転の可能性を示唆しています。
4時間足のテクニカル指標:MACD4時間足のMACD指標は、DIF線がDEA線を下抜けてデッドクロスを形成し、MACDヒストグラムは負の値を示し、拡大し続けており、売り圧力が強まっていることを示しています。下落トレンドが確定しています。RSI4時間足は46.90で、中立からやや弱気の領域にあり、過売りにはまだ達していないため、価格にはさらなる下落余地があることを示唆しています。EMA4時間足の価格は、EMA7(1982.25)、EMA30(1973.78)、EMA120(2023.97)のすべてのEMAを下抜けています。EMA7とEMA30は下向きに拡散し始めており、1970-1980の範囲に短期的な抵抗線を形成しています。これにより、
ETH0.44%


- 報酬
- 1
- コメント
- リポスト
- 共有
📣3/2イーサリアムのトレンド詳細分析と堅実な操作提案の共有:
4時間足のイーサリアム価格動向分析によると、4時間チャートのK線は、最近の価格が1916から1988の範囲内で激しく変動していることを示しています。3月2日08:00に強い陽線が出現しましたが、その後12:00と16:00のK線は長い上影線を伴い、実体も小さく、価格が1980付近まで反発した後に明らかな売り圧力に直面し、買い勢力は弱まり、市場はレンジ相場に入っています。日足チャートでは、2月28日に長い下影線を持つハンマー線が出現し、下方の買い支えを示していますが、3月1日には長い上影線を伴う大陰線が出現し、一部の反発の成果を飲み込み、上方の売り圧力が重いことを示しています。今日の日足は小さな陽線ですが、影線が長く、多空の攻防が続いています。
指標面では、MACD4時間足のMACD指標のDIF線はすでにDEA線を下抜けてデッドクロスを形成しており、DIFとDEAはともにゼロラインの下に位置しています。MACDのヒストグラムは負の値で拡大傾向にあり、短期的な売り勢力が優勢で、市場は弱気の状態です。RSI4時間足は48.20付近で、中立ゾーンにあり、明確な買われ過ぎや売られ過ぎのシグナルは示していません。短期的には明確な一方向のトレンドに欠ける状態です。EMA4時間足の価格は現在、EMA7(1955.59)、EM
ETH0.44%


- 報酬
- 1
- コメント
- リポスト
- 共有
📣3/2のイーサリアムのトレンド詳細分析と今後の動向:
イーサリアムのショートポジションのターゲットポイントは1910に完璧に到達し、79-90ポイントの利益を獲得。現在、イーサリアムはBTCと連動して底打ちから反発し、4時間足では1835の安値からV字型反発を見せ、2054に一時到達後に反落。現在は1970–1990の範囲で狭く揉み合っている。4時間足のK線:長い下影線を伴う複数のローソク足が下支えを示し、サポートは有効。上ヒゲは頻繁に出現し、2000の抵抗圧力が明確。反発時の出来高縮小により、突破には出来高の伴う確認が必要。押し目では出来高縮小、サポートはやや強い。
4時間足のイーサリアムのトレンド分析では、短期EMA7/14が上向きに転じ、価格はEMA30(≈1954)を上回り、短期的には強気優勢。中期EMA120(≈2042)は依然下向きで、強い抵抗となり、弱気の構造を完全には覆していない。ボリンジャーバンドのミドルラインは≈1960で、価格はミドルラインの上で推移し、やや強気のレンジ。上バンドは≈2020、下バンドは≈1900。MACDはゼロライン下でゴールデンクロスを形成し、赤柱は徐々に拡大、弱気の勢いは減少し、反発の勢いは増している。RSIは約48で、売られ過ぎから回復し、中立よりやや強気、買われ過ぎには達しておらず、反発余地は依然としてある。
主要なサ
ETH0.44%

- 報酬
- 1
- コメント
- リポスト
- 共有
📣3/1のイーサリアムのトレンド詳細分析と堅実な操作提案の共有:
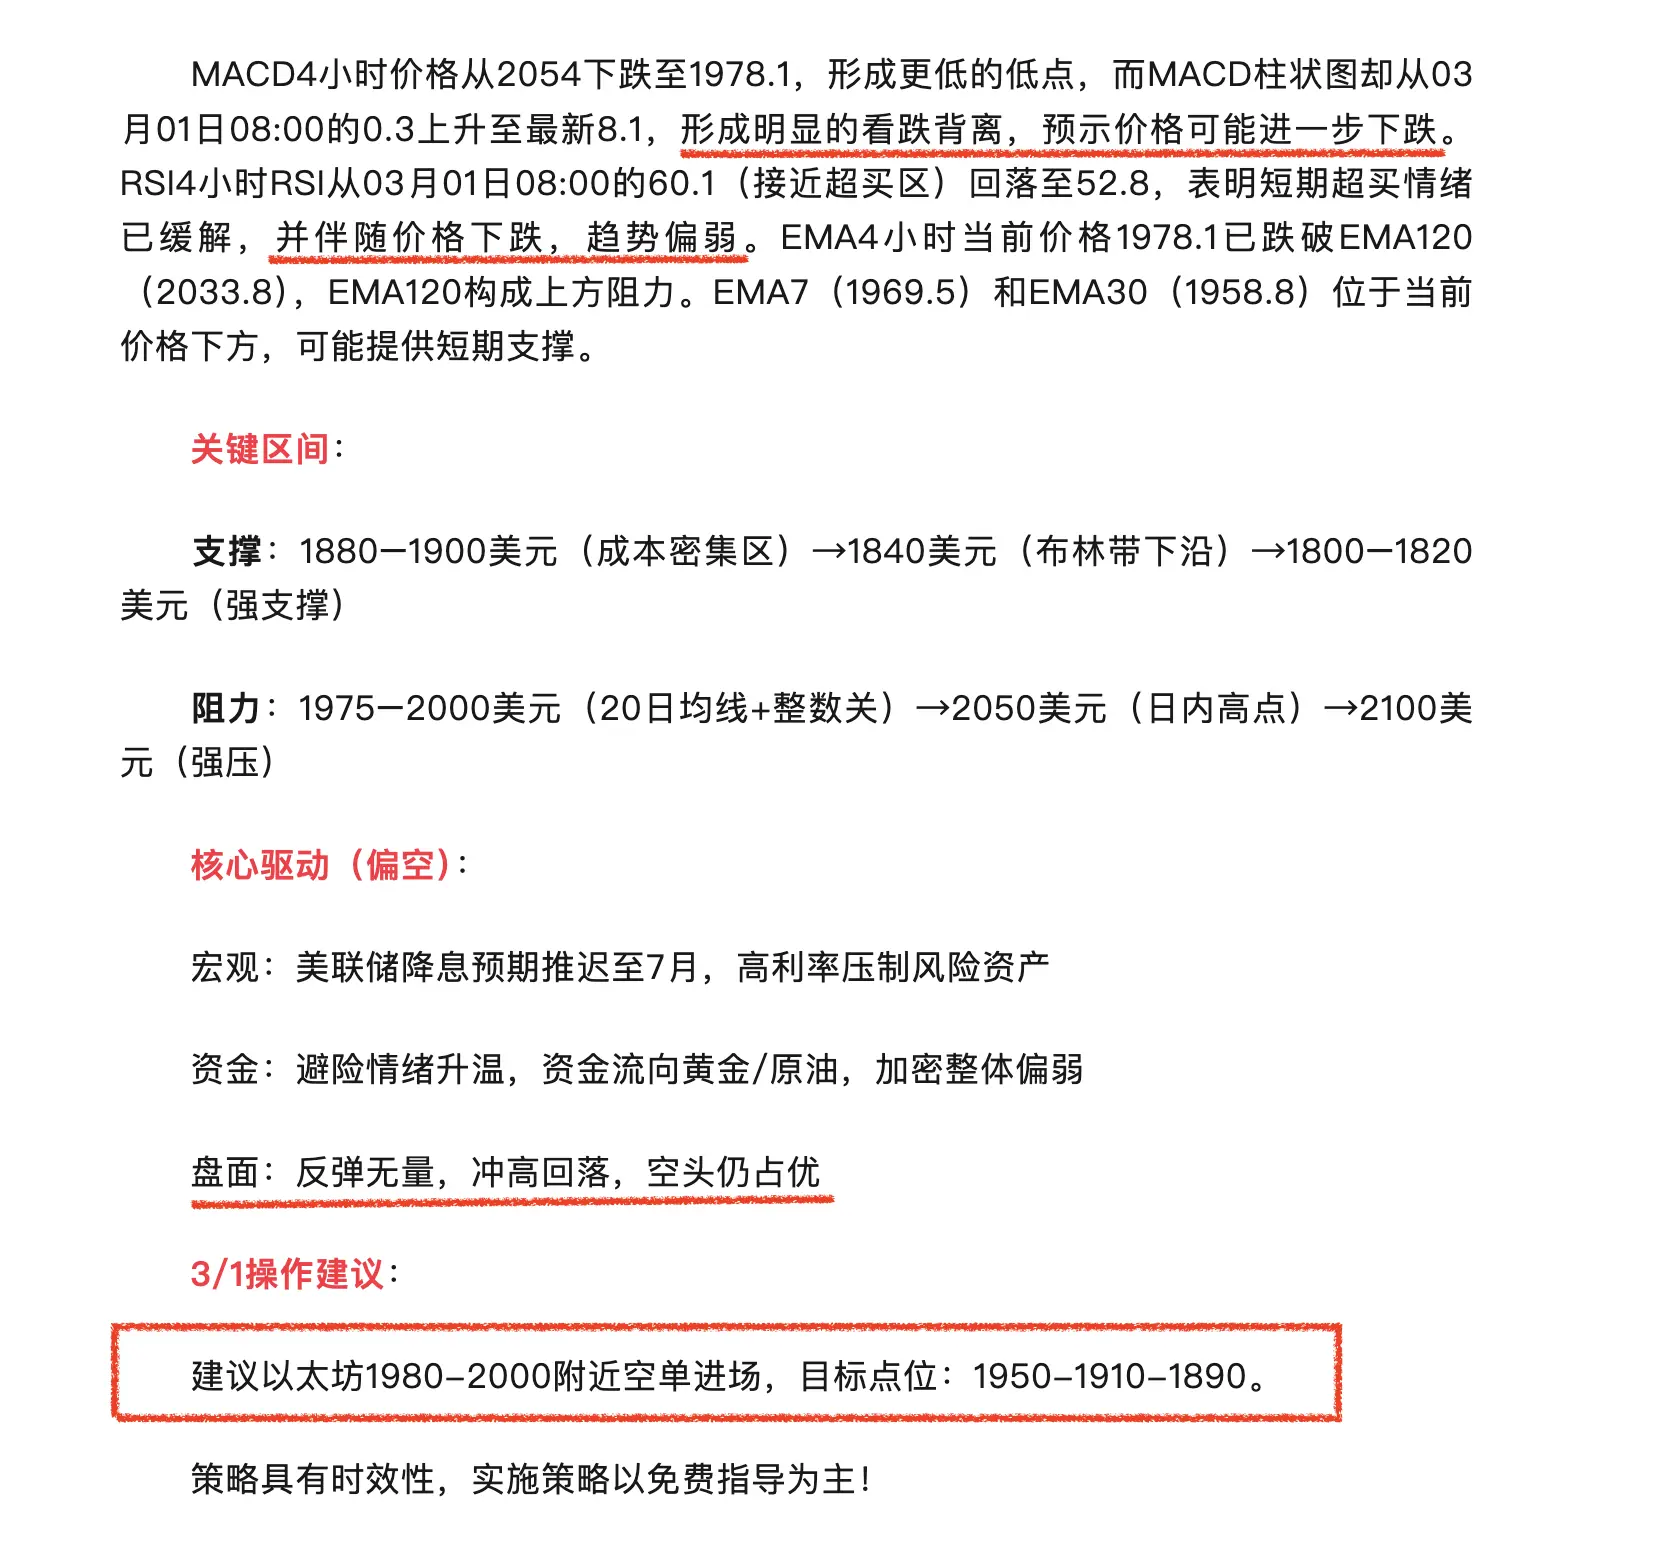
四時間足のイーサリアム価格動向分析によると、K線4時間チャートは、価格が2054の高値に達した後、連続して2本の陰線を形成し、最新の陰線は実体が大きく、終値は最低値の1978.1に近づいています。これは短期的な売り圧力が強いことを示しています。日足チャートでは、最新のK線は長い上影線を伴う陰線であり、2054付近で強い売り圧力に直面し、買い勢力の上昇が阻まれています。
MACDの4時間足では、価格が2054から1978.1に下落し、より低い安値を形成していますが、MACDヒストグラムは3月1日08:00の0.3から最新の8.1に上昇しており、明らかな弱気のダイバージェンスを示しています。これは価格がさらに下落する可能性を示唆しています。RSIの4時間足は、3月1日08:00の60.1(買われ過ぎ域に近い)から52.8に下落しており、短期的な買われ過ぎの状態が緩和され、価格の下落とともにトレンドは弱気に傾いています。EMAの4時間足の現在価格は1978.1で、EMA120(2033.8)を下回っており、EMA120が上方の抵抗線となっています。EMA7(1969.5)とEMA30(1958.8)は現在の価格の下に位置し、短期的なサポートを提供する可能性があります。
重要な区間:
サポート:1880–1900ド
原文表示四時間足のイーサリアム価格動向分析によると、K線4時間チャートは、価格が2054の高値に達した後、連続して2本の陰線を形成し、最新の陰線は実体が大きく、終値は最低値の1978.1に近づいています。これは短期的な売り圧力が強いことを示しています。日足チャートでは、最新のK線は長い上影線を伴う陰線であり、2054付近で強い売り圧力に直面し、買い勢力の上昇が阻まれています。
MACDの4時間足では、価格が2054から1978.1に下落し、より低い安値を形成していますが、MACDヒストグラムは3月1日08:00の0.3から最新の8.1に上昇しており、明らかな弱気のダイバージェンスを示しています。これは価格がさらに下落する可能性を示唆しています。RSIの4時間足は、3月1日08:00の60.1(買われ過ぎ域に近い)から52.8に下落しており、短期的な買われ過ぎの状態が緩和され、価格の下落とともにトレンドは弱気に傾いています。EMAの4時間足の現在価格は1978.1で、EMA120(2033.8)を下回っており、EMA120が上方の抵抗線となっています。EMA7(1969.5)とEMA30(1958.8)は現在の価格の下に位置し、短期的なサポートを提供する可能性があります。
重要な区間:
サポート:1880–1900ド

- 報酬
- 2
- コメント
- リポスト
- 共有