Technical Analysis for February 21: BTC, ETH, XRP, BNB, SOL, DOGE, BCH, ADA, HYPE, XMR
Bitcoin’s bulls have at times pushed the price above $68,300, but buying pressure still isn’t strong enough to sustain the high levels. If there isn’t a significant breakout in the next few days, BTC is likely to close this month with its fifth consecutive red candle. This scenario recalls the 2018–2019 period when Bitcoin plummeted for six months straight—the longest decline in history. However, there is a faint positive signal: after that decline, BTC rebounded by 131.6% in just five months, according to CoinGlass data.
Another technical indicator supporting a potential reversal is the Bollinger Bands. According to crypto analyst Dorkchicken, the monthly Bollinger Bands are currently in the tightest state ever recorded. Historically, similar tightening often precedes upward breakouts, except for the sharp decline from $20,000 to $16,000 in 2022.
Despite technical signals leaning toward a positive scenario, traders should closely monitor the inflows and outflows of Bitcoin ETF funds to assess institutional participation. Data from SoSoValue shows that US-based spot Bitcoin ETFs experienced a net outflow of $403.9 million this week. If Friday’s session doesn’t see a large capital inflow reversing the trend, this will be the fifth consecutive week of withdrawals—posing a significant obstacle to any sustainable recovery.
So, do the bulls have enough strength to push BTC and top altcoins through the resistance levels above? Let’s analyze the charts of the 10 largest cryptocurrencies to find out.
Technical Analysis of BTC
BTC bulls have held the support near $65,118, indicating buying interest at lower levels.
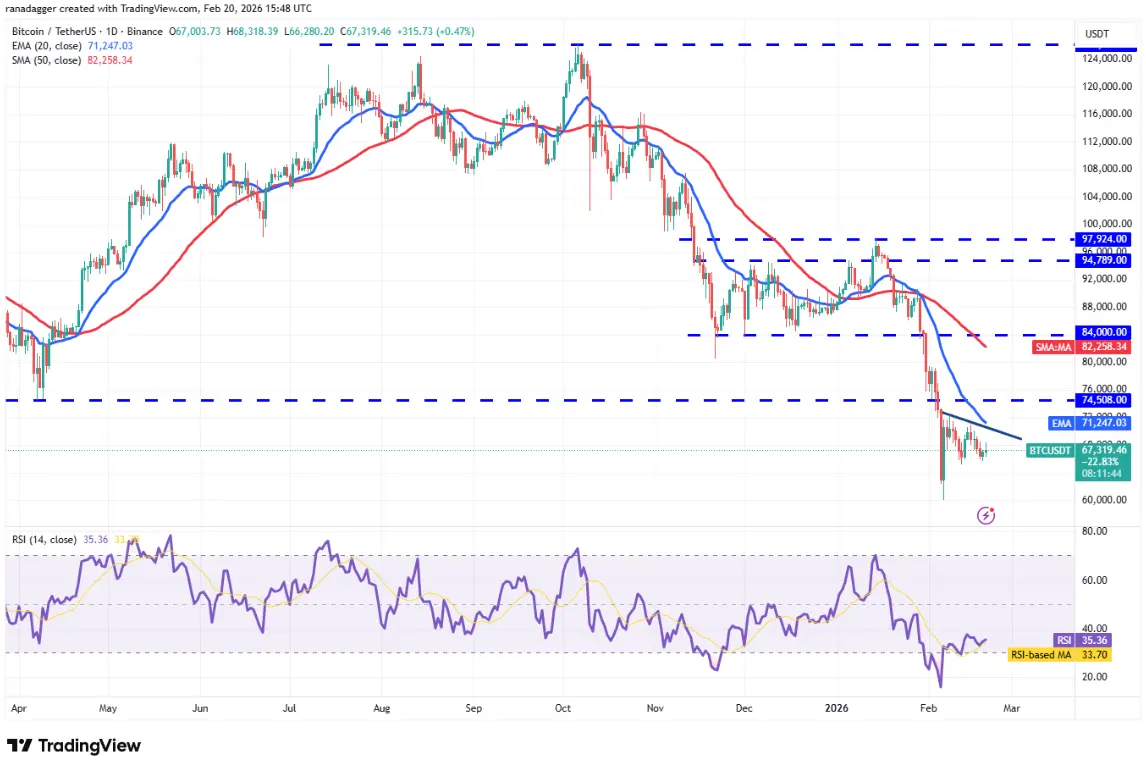 Daily BTC/USDT Chart | Source: TradingView Buyers need to push the price above the 20-day EMA at $71,247 to regain the advantage. If successful, the BTC/USDT pair could rise to the breakout level at $74,508. Bears are expected to defend this level aggressively, as a break above it could signal a short-term bottom formation. If that happens, the price could continue upward toward the 50-day SMA at $82,258.
On the other hand, sellers need to pull the price below $65,118 to demonstrate strength. That could lead the pair to retest the February 6 low at $60,000, where strong buying from bulls is anticipated.
Technical Analysis of ETH
Ether (ETH) is trading sideways between $1,750 and $2,111, indicating uncertainty about the next direction.
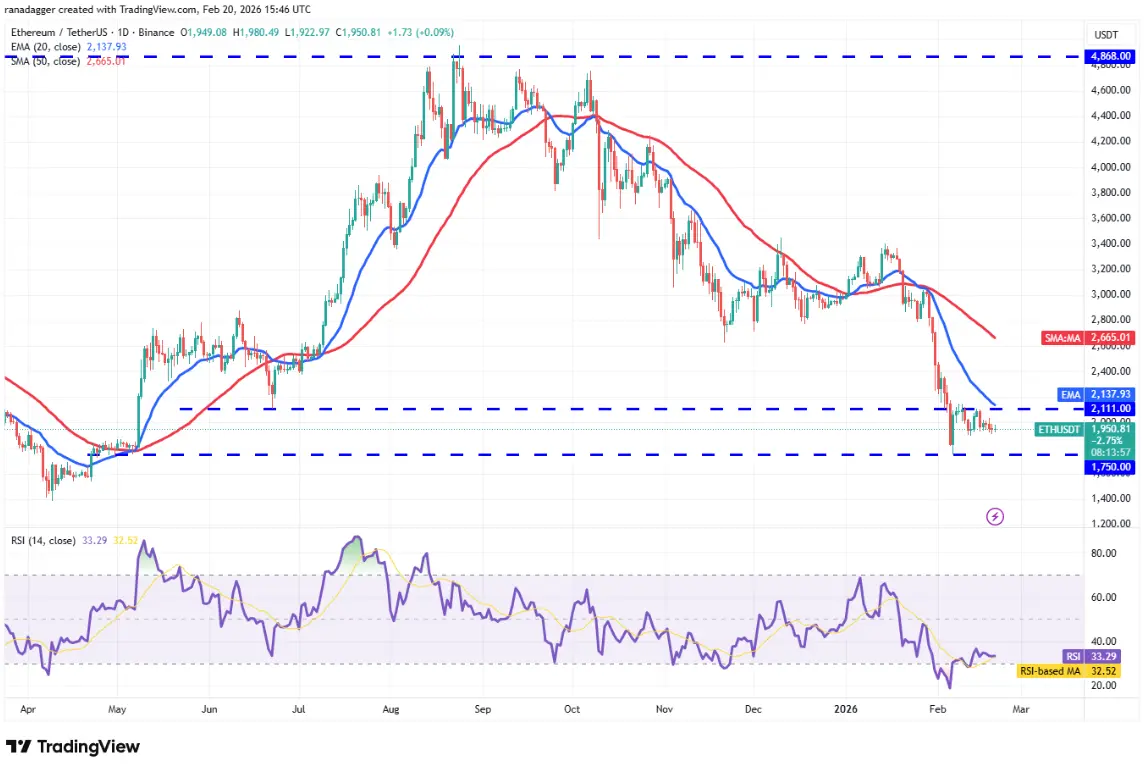 Daily ETH/USDT Chart | Source: TradingView There is minor support at $1,897, but if this level breaks, ETH/USDT could decline to the support zone at $1,750. Bulls are expected to defend this level strongly, as a close below it could send the price plunging to $1,537.
The bulls will regain control if the price closes above the resistance zone at $2,111. Success here could push ETH toward the 50-day SMA at $2,665. Sellers may attempt to halt the recovery at this level, but if bulls prevail, the pair could surge to $3,045.
Technical Analysis of XRP
The inability of bulls to push XRP above the 20-day EMA at $1.50 indicates weak demand at higher levels.
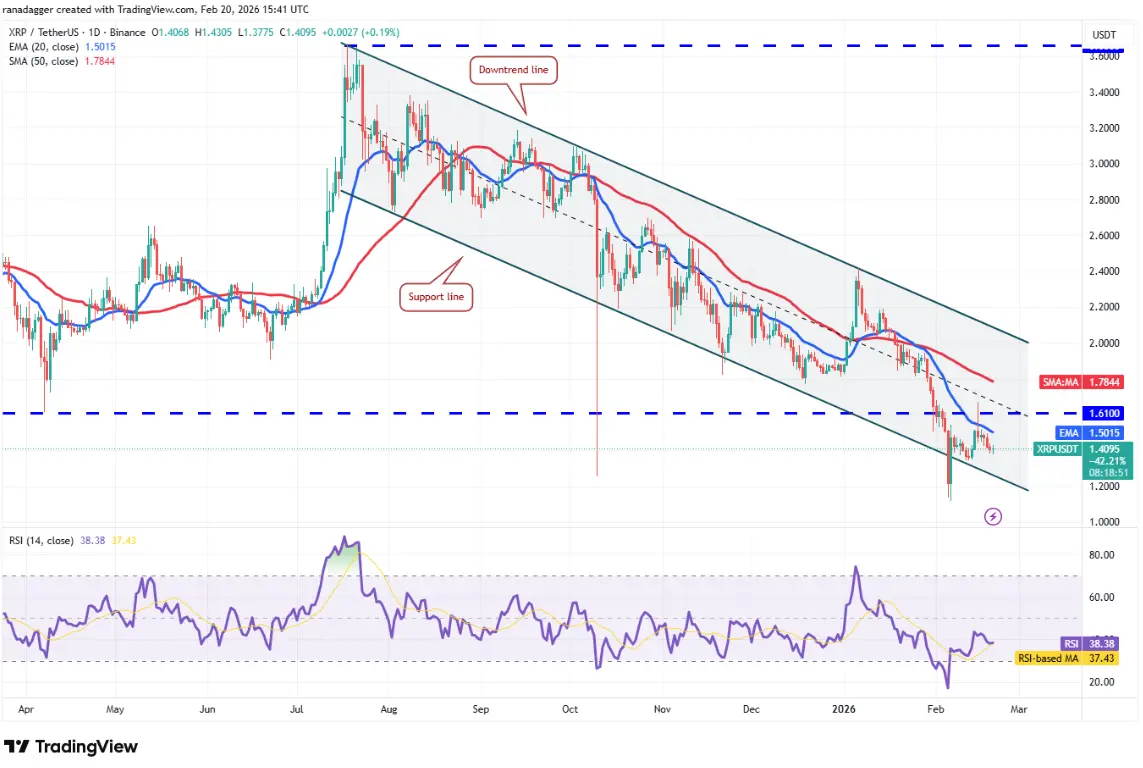 Daily XRP/USDT Chart | Source: TradingView The XRP/USDT pair could slip to the support line, which is a critical level to watch. If XRP rebounds strongly from this support and breaks above the 20-day EMA, it suggests the pair may continue to fluctuate within the downtrend channel for some more time. Buyers need to break the downtrend line to confirm a short-term trend reversal.
Conversely, a break and close below the support line would indicate bears are in control. The pair could then fall to $1.11, and eventually to $1.
Technical Analysis of BNB
BNB is gradually declining toward the support zone between $587 and $570, showing bears are gaining momentum.
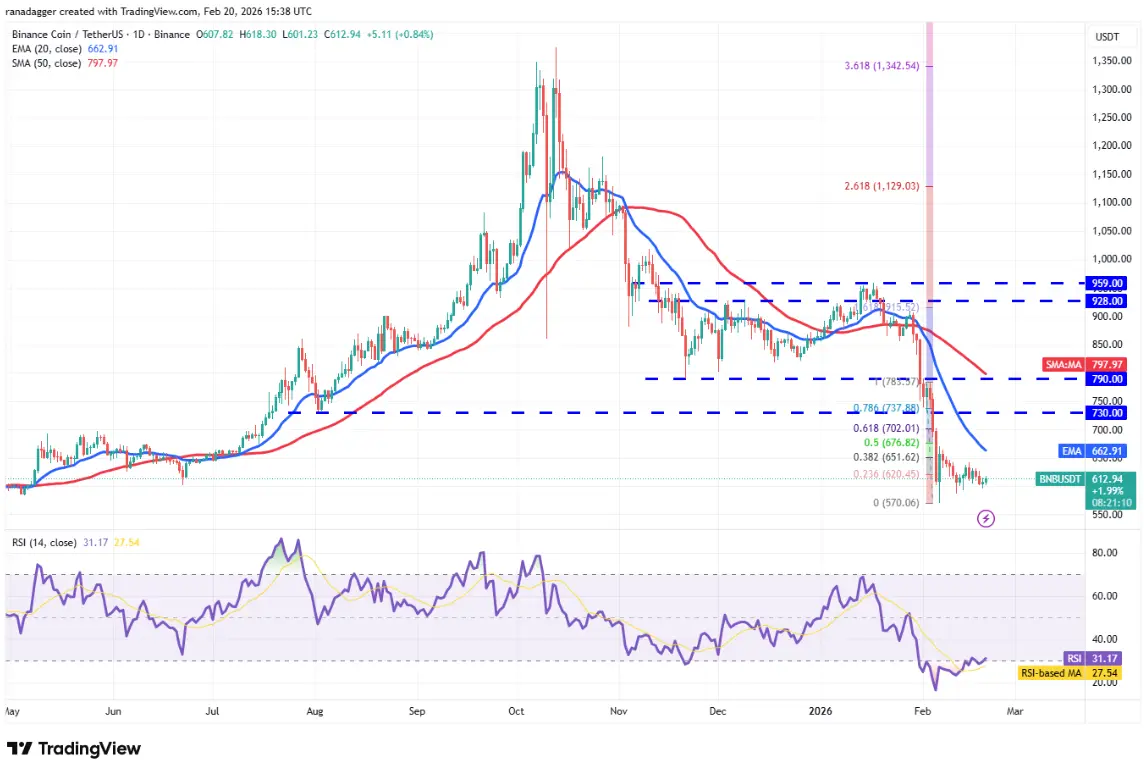 Daily BNB/USDT Chart | Source: TradingView If BNB’s price continues downward and breaks this support zone, the pair could enter the next leg of decline toward the psychological level of $500.
This negative outlook will be invalidated in the short term if bulls push the price above the resistance at $669. That could lead to a strong rally toward the breakout level at $730, followed by the 50-day SMA at $797. Such a move would suggest the pair has formed a short-term bottom.
Technical Analysis of SOL
Solana (SOL) bulls are trying to hold above the nearest support at $76, but the current recovery lacks strength.
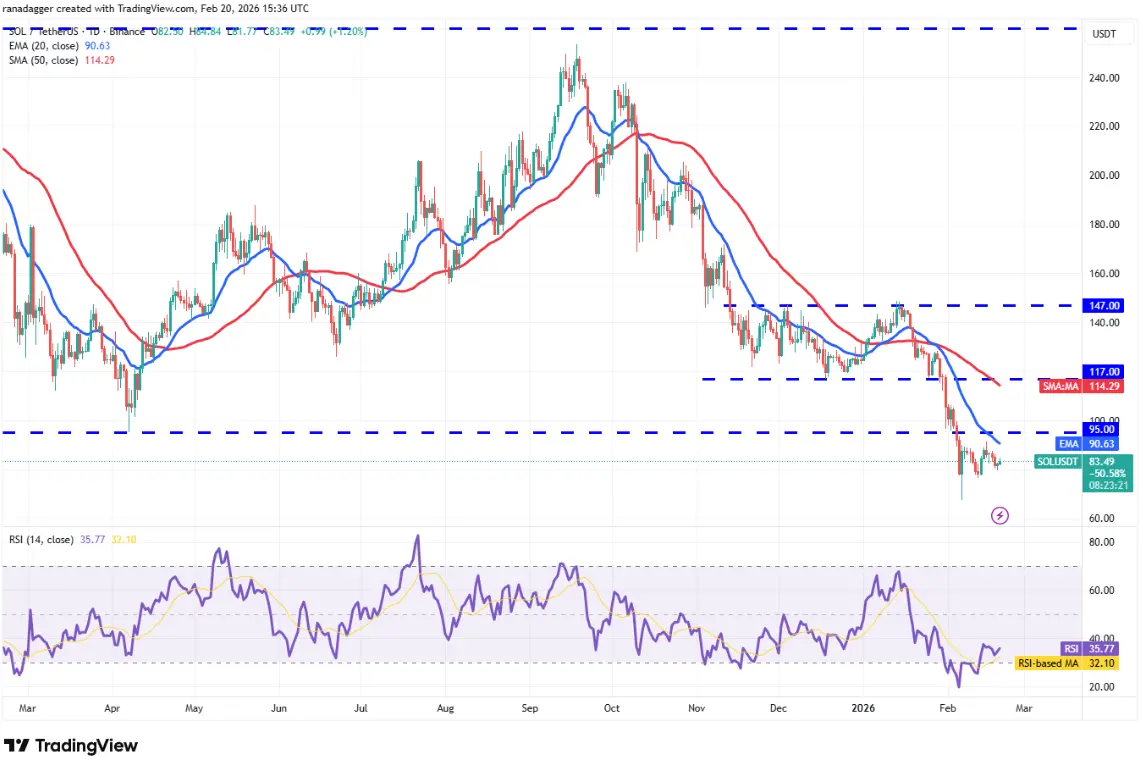 Daily SOL/USDT Chart | Source: TradingView This increases the risk of a breakdown below $76. If that occurs, SOL/USDT could plunge to the February 6 low at $67. Bulls are expected to defend this level strongly, as a close below it could lead to a deeper decline toward $50.
The first sign of renewed strength would be a breakout and close above the $95 breakout level. That would indicate bears are losing control. In that case, Solana could rise toward the 50-day SMA at $114.
Technical Analysis of DOGE
Buyers are attempting to push Dogecoin (DOGE) above the 20-day EMA at $0.10, but sellers are holding their ground.
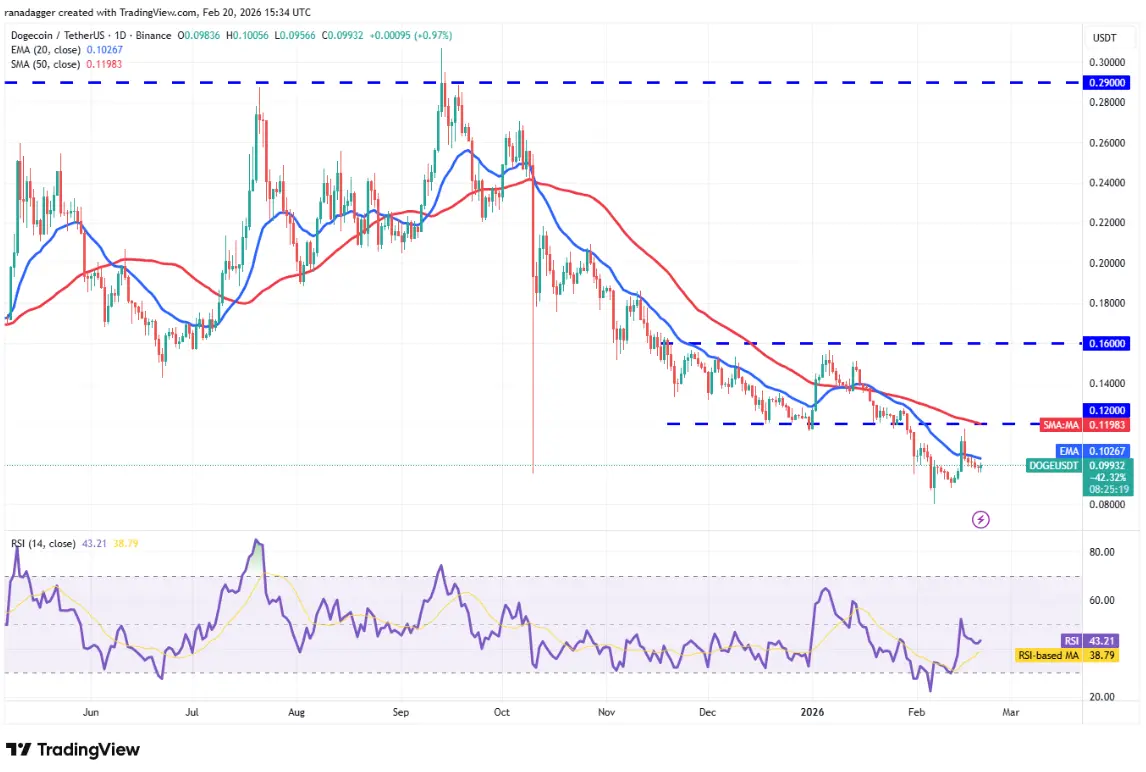 Daily DOGE/USDT Chart | Source: TradingView A small positive sign for bulls is that they haven’t lost too much ground to bears. This increases the likelihood of a breakout above the 20-day EMA. If that happens, DOGE/USDT could rise to the resistance at $0.12.
Conversely, if Dogecoin’s price reverses and breaks below $0.09, it indicates bulls have given up. The pair could then decline toward the key support zone at $0.08.
Technical Analysis of BCH
Bitcoin Cash (BCH) has fallen below the 20-day EMA at $548, indicating bears are trying to take control.
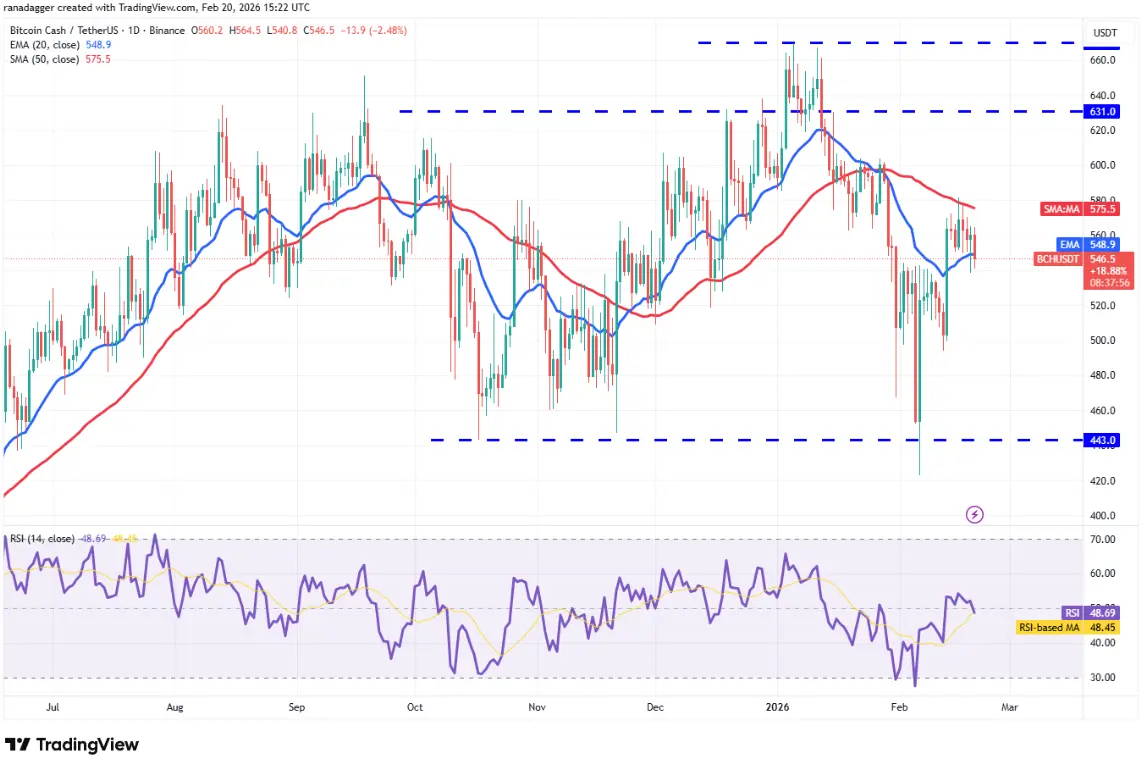 Daily BCH/USDT Chart | Source: TradingView If BCH remains below the 20-day EMA, the pair could drop toward the next important support at $500. Buyers are expected to defend this level strongly, as a close below it could open the door to a deeper decline toward the critical support at $443.
Bulls need to push and hold the price above the 50-day SMA at $575 to signal strength. That could lead to a rally toward $600 and then $631. However, strong selling pressure is likely in the zone between $631 and $670.
Technical Analysis of HYPE
Hyperliquid (HYPE) rebounded from the 50-day SMA at $27.89 on Thursday, indicating bulls are buying on dips.
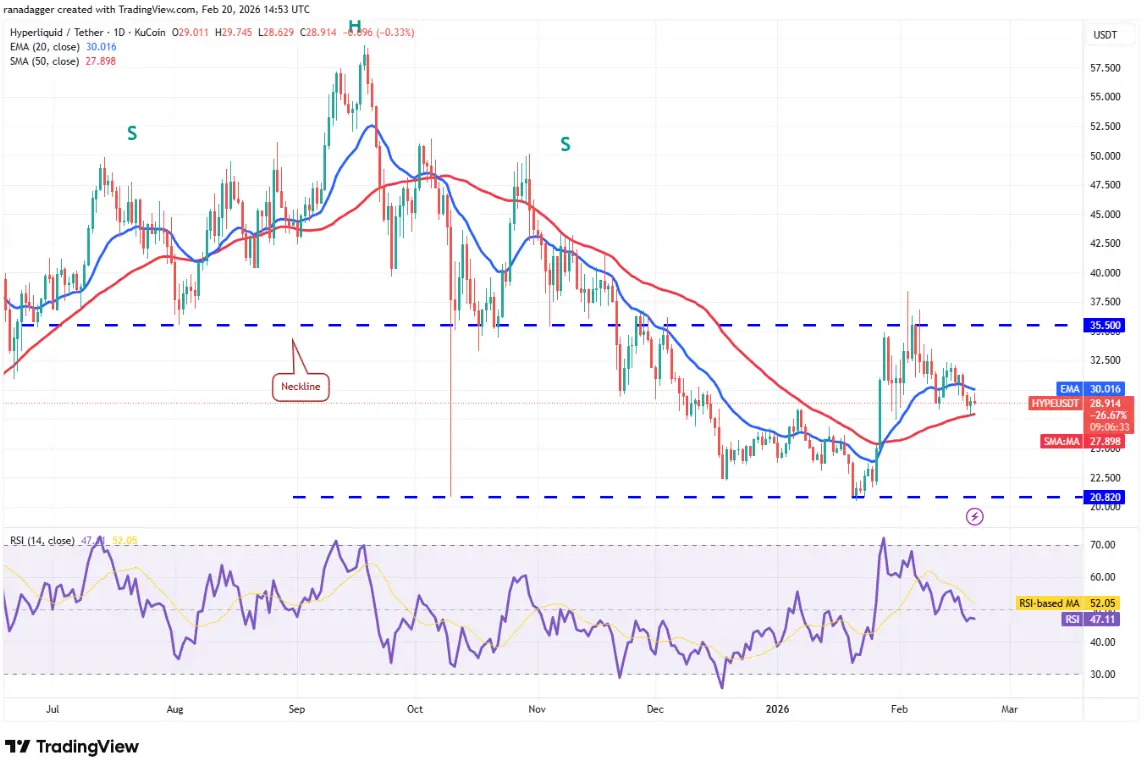 Daily HYPE/USDT Chart | Source: TradingView Buyers will need to push HYPE above $32.50 to take control. That could reignite momentum and send the price soaring toward the resistance zone between $35.50 and $38.42.
If the price reverses from the 20-day EMA at $30.01 and breaks below the 50-day SMA, it signals bears are regaining advantage. The pair could then fall sharply toward the support zone at $20.82, where buyers are expected to step back in.
Technical Analysis of ADA
Buyers are struggling to push Cardano (ADA) above the 20-day EMA at $0.28, but a small positive sign is that they haven’t surrendered much ground to bears.
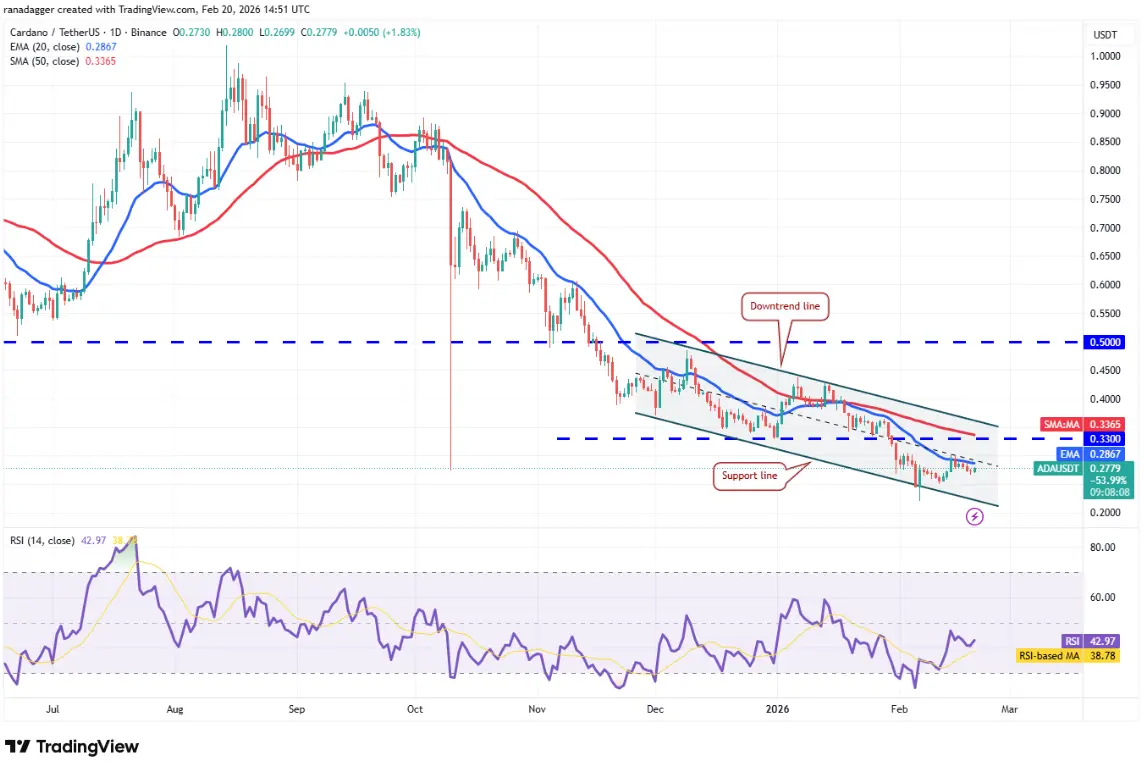 Daily ADA/USDT Chart | Source: TradingView Bulls will continue efforts to push ADA above the 20-day EMA. If successful, the pair could gradually move toward the strong resistance at the descending trendline. A close above this trendline would signal a potential short-term trend reversal.
Sellers will not give up easily. They will try to drag the price below the support zone, indicating the downtrend continues. The next target on the downside is likely at $0.15.
Technical Analysis of XMR
Monero (XMR) is moving sideways within a downtrend, showing bears are still exerting selling pressure.
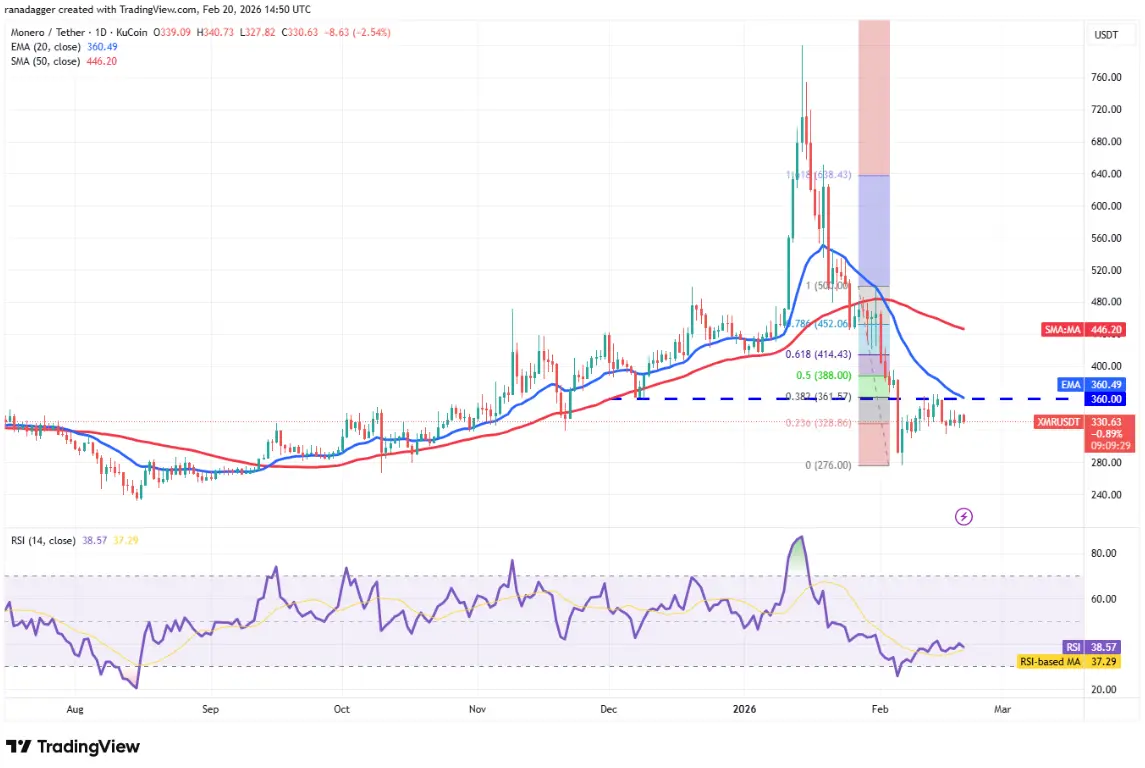 Daily XMR/USDT Chart | Source: TradingView Sellers will attempt to strengthen their position by pushing XMR below the $309 level. If successful, the pair could decline to $276. Buyers are expected to defend this level strongly, as a close below it could lead to a further slide toward $247.
On the upside, bulls need to push and hold above the 20-day EMA at $360 to signal strength. That could lift the pair to the 61.8% Fibonacci retracement level at $414.
Related Articles
Market Report: Top 5 cryptocurrencies by decline on February 24, 2026, with the largest drop in Bitcoin Cash
MicroStrategy's Bitcoin losses reach $7.9 billion; Saylor: as long as BTC doesn't go to zero, it will head toward a million!
"Bitcoin is dead" search volume hits a record high: Is this a sign of surrender or the true bottom?
Why did Bitcoin plummet today! Trump considers new tariffs, miners liquidate 2000 BTC