Abstract:
This report provides an in-depth analysis of the evolving liquidity dynamics in the crypto ETF market, its profound impact on the volatility of underlying assets, and the mechanisms and market applications of leveraged ETFs. It also offers a detailed comparison between leveraged ETFs in the crypto market and those in traditional financial markets. Based on real-time trading data from the Gate platform, the report constructs a set of practical, execution-oriented trading strategies. Centered on a “right-side entry” approach, the strategy incorporates volume-driven momentum breakout signals to capture excess returns. Through phased position building, momentum-based scaling, and a strict exit framework, it achieves a dynamic balance between risk and return while effectively mitigating volatility drag.
1. Introduction: As Crypto ETFs Rise, Who Is Actually Buying with Real Capital?
The early crypto market resembled a series of fragmented private trades, largely reliant on over-the-counter (OTC) transactions. Liquidity was highly dispersed, bid-ask spreads were wide, and even moderately sized orders could trigger significant price swings. As derivatives markets came into focus—particularly with the introduction of short-selling mechanisms and the widespread adoption of basis arbitrage strategies—price discovery in crypto became more efficient, and spreads narrowed substantially. In particular, perpetual futures on centralized exchanges drove a rapid expansion in trading volume.
What truly brought crypto into the mainstream, however, was the launch of spot crypto ETFs. ETFs introduced a key player—the Authorized Participant (AP). Acting as market stabilizers, APs arbitrage price discrepancies: when the ETF trades at a premium to its net asset value (NAV), they create shares and sell them in the market to compress the premium, and vice versa. This mechanism not only minimizes premiums and discounts but, more importantly, continuously injects institutional-grade liquidity into the market.
Taking BlackRock’s IBIT as an example, it surpassed $10 billion in assets under management in just 47 trading days after launch. By comparison, the gold ETF GLD—previously the fastest—took nearly three years to reach the same milestone. During the Treasury Strategy (DAT) boom in 2025, newly issued spot crypto ETFs and crypto treasury allocations together absorbed more than 12% of the circulating market supply. This share indicates that institutional holdings have evolved from marginal participation into a decisive force shaping market supply and demand.
As the dominant market participants shift from high-frequency traders and crypto-native users to institutions, the market’s rhythm has subtly changed. Traditional financial theory offers two competing hypotheses regarding the impact of ETFs: one suggests that the “arbitrage transmission mechanism” dampens volatility in the underlying assets, while the other warns that ETF scale expansion may amplify market co-movement and herd behavior through a “common ownership effect.”
However, empirical evidence from the crypto market reveals a more complex dynamic than either hypothesis alone. Taking Bitcoin as an example, its volatility history can be divided into three phases and evaluated using realized volatility (RV) as an objective metric.
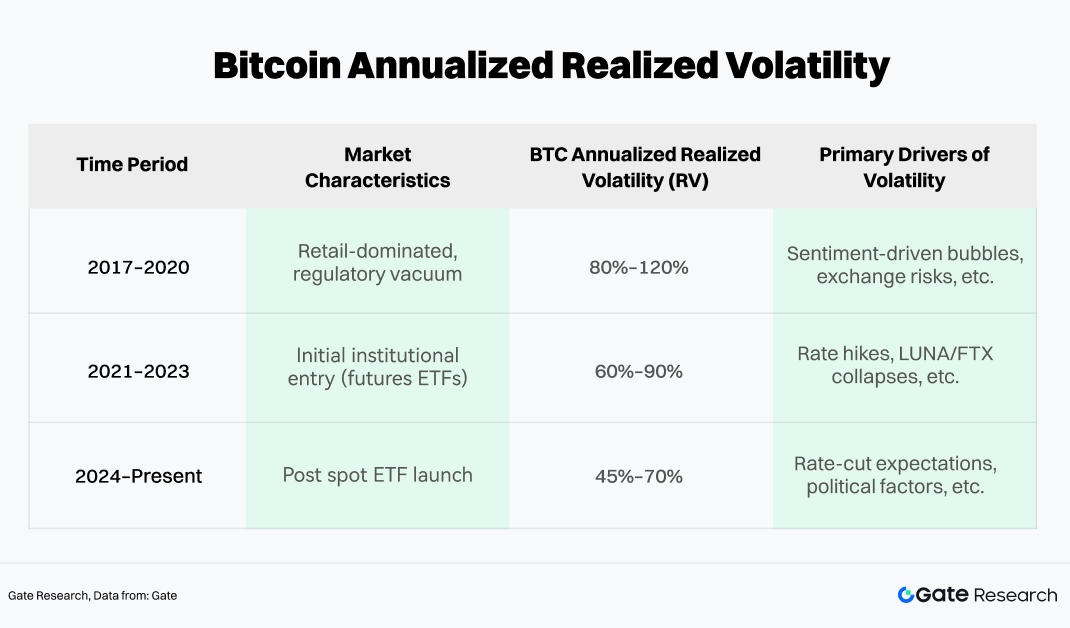
The data shows that since 2024, the center of Bitcoin’s annualized realized volatility has declined. Although its absolute level remains high relative to equities, volatility spikes have been noticeably suppressed. The underlying mechanism lies in the persistent presence of ETF arbitrage capital, which accelerates mean reversion during extreme price deviations, while periodic institutional inflows provide structural support to prices.
At the same time, spot Bitcoin ETFs have demonstrated a visible buffering effect on extreme market moves. Throughout the cycle from 2022 to early 2026, Bitcoin’s maximum drawdown from peak to trough has remained below 50%, a stark contrast to the 70%–80% declines seen in previous cycles. This volatility compression suggests that ETFs effectively anchor a pool of long-term, price-insensitive capital in the market. When retail sentiment deteriorates and sell-offs intensify, institutional ETF holdings act as a “liquidity backstop,” absorbing sell pressure and stabilizing the market.
2. Mechanisms and Characteristics of Leveraged ETFs in the Crypto Market
As arbitrage capital and institutional allocations become the dominant market forces, overall volatility has indeed moderated. Interestingly, this very stability has paved the way for more complex financial structures—especially as rising risk appetite drives investors to seek greater return convexity, making simple spot exposure insufficient. As a result, leveraged ETFs—designed to amplify both returns and volatility—have increasingly entered the field of vision for crypto investors.
Since the approval of the first Bitcoin leveraged ETF in 2023, the sector has accelerated rapidly. Broadly, leveraged products in today’s market fall into two main categories:
-
SEC-regulated compliant ETFs, issued by institutions such as ProShares and Volatility Shares.
-
Leveraged tokens issued by centralized exchanges (CEX), such as ETH5S and BTC3L.
Within the compliant ETF space, BITX (a 2x Bitcoin ETF issued by Volatility Shares) currently leads with assets under management approaching $969 million, though it carries a relatively high expense ratio of 2.38%. ProShares’ BITU (also a 2x Bitcoin ETF) has a lower fee of 0.98%, with AUM of approximately $422 million.
Notably, leveraged tokens issued by CEXs have also gained traction in recent years and are increasingly attracting market attention. Compared to traditional ETFs, they offer structural advantages such as no margin requirements, no liquidation risk, and direct spot trading accessibility. In addition, they better align with crypto-native user needs in terms of trading hours, listing speed, and strategy flexibility, making them an important bridge between high-frequency trading and hedging applications.
2.1 Core Differences Between Crypto Leveraged ETFs and Traditional Leveraged ETFs
Although their operational frameworks are similar, the unique nature of crypto assets leads to fundamentally different risk exposures compared to traditional leveraged ETFs.
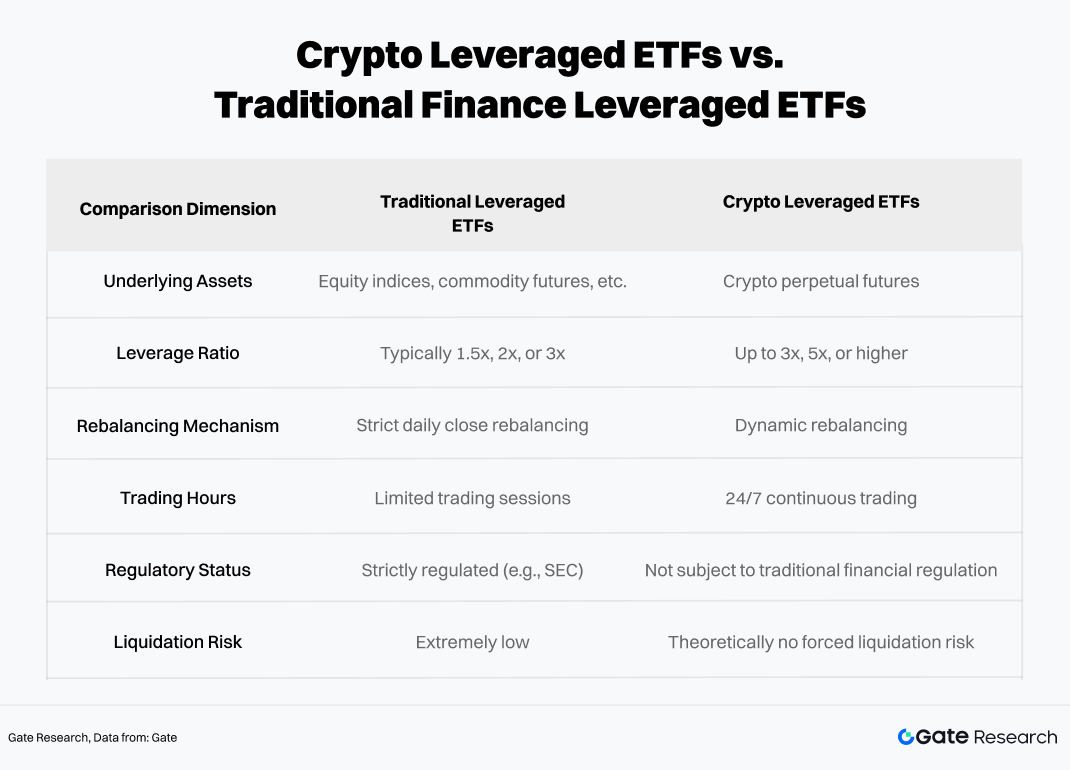
While both structures rely on rebalancing and derivatives exposure to achieve leverage, the 24/7 nature, higher volatility, and weaker regulatory environment of crypto markets introduce stronger nonlinear risks and amplified tail effects. At the same time, compared to traditional leveraged ETFs, crypto leveraged ETFs are more susceptible to net asset value erosion due to volatility decay, particularly in sustained trending or highly volatile environments—potentially even reaching near-zero NAV in extreme scenarios.
2.2 Daily Rebalancing Mechanism and “Volatility Decay”
The defining feature of leveraged ETFs is their “daily reset,” which distinguishes them from conventional leverage. To maintain a precise multiple of exposure at the start of each trading day, funds must rebalance their positions daily.
A common misconception among investors is that “if the underlying asset rises 10%, a 2x ETF will rise 20%.” While this holds true on a single-day basis, over multiple days the relationship becomes nonlinear due to the compounding effects of daily rebalancing.
Specifically, if Bitcoin rises on day T, the NAV of a 2x ETF also increases, reducing its effective leverage below 2x. To restore target exposure, the fund must “buy into strength” before the next trading day (T+1), increasing its swap or futures positions. Conversely, if prices fall, the fund must “sell into weakness” by reducing exposure. This mechanical “buy high, sell low” process is the fundamental source of NAV erosion in choppy markets.
For example, assume the underlying asset rises 10% on day one and falls 9.09% on day two (returning exactly to its starting point):
-
Underlying asset: $$100 × 1.10 × 0.9091 = 10$$ (0% return)
-
2x ETF: $$100 × 1.20 × 0.8182 = 98.1$$ (-1.82%)
-
3x ETF: $$100 × 1.30 × 0.7273 = 94.5$$ (-5.45%)
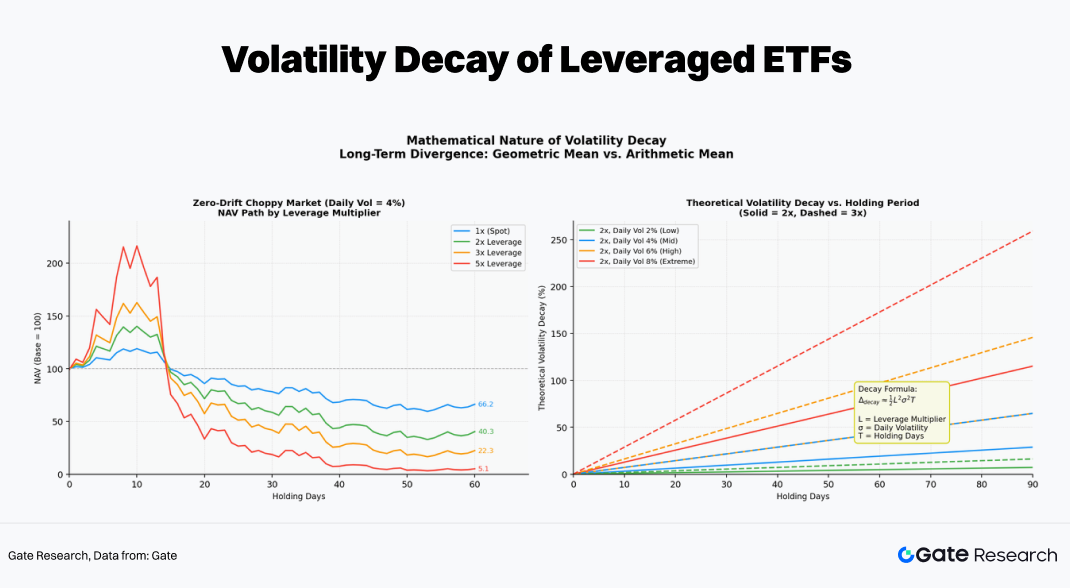
In a high-volatility, zero-drift environment (where prices ultimately return to the starting point), the higher the leverage, the more severe the long-term decay—growing exponentially over time. For instance, after 60 days, a 5x leveraged product could theoretically retain only about 5.1% of its initial value.
2.3 Suitable Market Conditions for Crypto Leveraged ETFs
To identify the market environments best suited for crypto leveraged ETFs, we employ a 60-day rolling Monte Carlo simulation to capture performance differences across various leverage levels under different market conditions.
In the simulation, we use the historical return and volatility of the underlying asset (ETH in this case) as input parameters. By randomly sampling and generating a large number of price paths, we compute the daily compounded NAV changes for leveraged ETFs (±1x, ±2x, ±3x, ±5x) along each path, while incorporating volatility decay effects. This approach produces return distributions under different market structures, allowing for an intuitive comparison of long-term performance across leverage levels within the same environment.
Empirically, different leverage levels exhibit significantly distinct outcomes across three typical market regimes:
-
Trending (One-Sided) Market: This is the only environment where leveraged ETFs can generate positive excess returns. Due to daily “buying into strength,” the base position continuously increases, creating a compounding effect. In such conditions, returns from 3x or 5x ETFs can significantly exceed those from manually leveraged positions (which lack compounding effects).
-
High-Volatility Range-Bound Market: This is effectively a “grinder” for leveraged ETFs. Even if the underlying asset’s price remains unchanged after 60 days, both 5x long and 5x short ETFs may decline by more than 90%. Volatility decay completely erodes capital, and the longer the holding period, the more certain the loss.
-
Low-Volatility Range-Bound Market: Losses still occur but are relatively manageable. In some cases, -1x or -2x products may even generate small positive returns due to minor trends or funding rate advantages, making them suitable for short-term, event-driven hedging strategies.
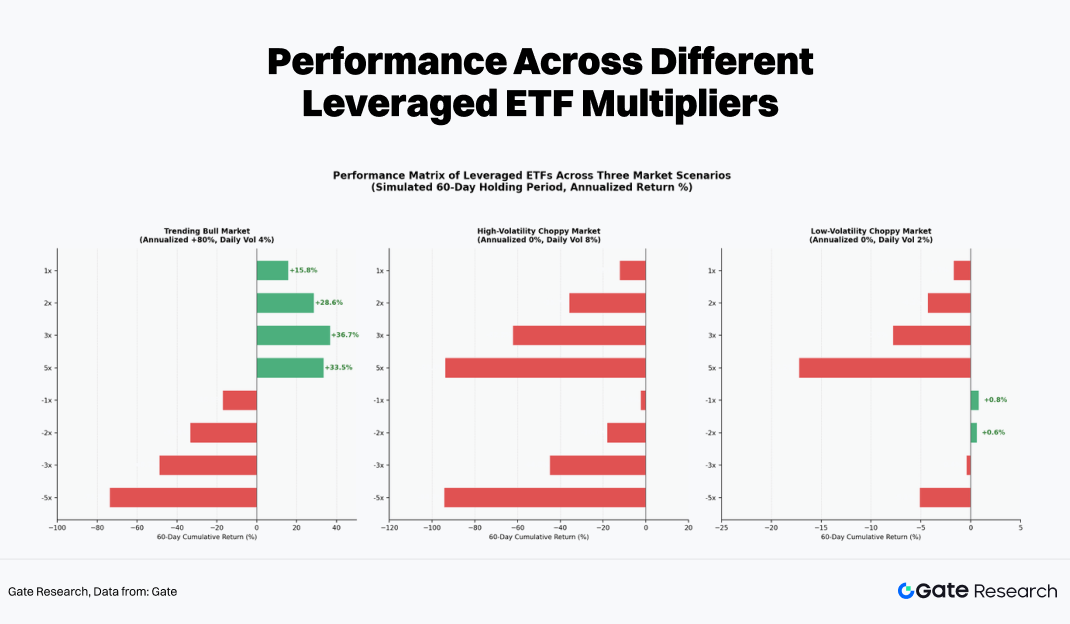
Therefore, the most favorable environment for crypto leveraged ETFs is a strong, one-directional trend. To avoid continuous NAV erosion in choppy markets, leveraged ETFs are better suited for short-term tactical allocation rather than long-term core holdings.
So, how long should one hold leveraged ETFs? The answer becomes clear when examining performance across different volatility levels and leverage ratios:
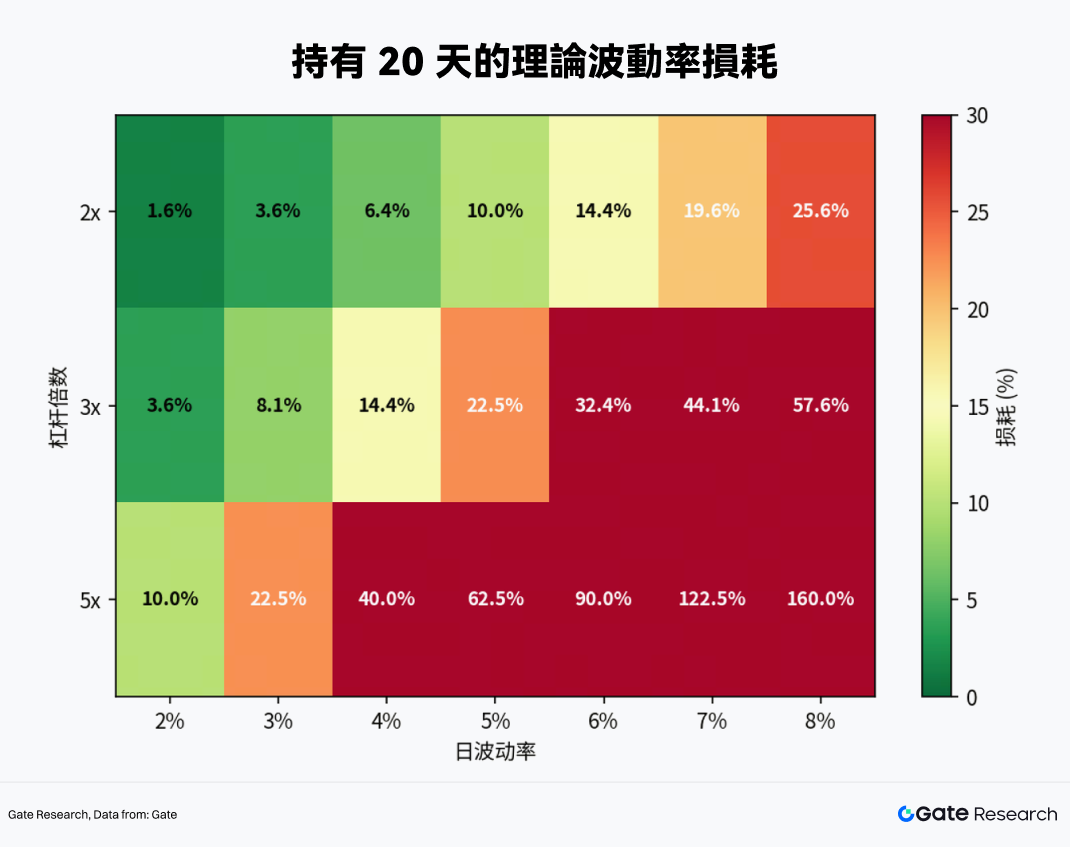
-
At a daily volatility of 4% (a typical level in crypto markets), the theoretical decay reaches 6.4% for 2x ETFs within 20 days, 14.4% for 3x ETFs, and as high as 40% for 5x ETFs.
-
30 days represents a critical threshold: unless the underlying asset exhibits a strong unidirectional uptrend, 2x and 3x ETFs are likely to start losing principal under normal volatility conditions.
Conclusion: The holding period for crypto leveraged ETFs should generally not exceed one month, with the optimal tactical window being 1–5 days.
3. Empirical Trading of Leveraged ETFs Based on Gate MCP
To translate theory into practice, we leveraged the Gate MCP interface to retrieve real-time data from the crypto market and conducted in-depth analysis.
3.1 Underlying Selection
Liquidity is the primary prerequisite for the feasibility of any leveraged ETF strategy. Products with low trading volume not only face significant slippage risk, but their prices are also more prone to deviating from NAV, leading to distorted trading signals. To address this, we extracted trading volume data for all leveraged ETF products from the beginning of 2026 through the end of March via the Gate MCP interface, using it as the first filter for underlying selection.
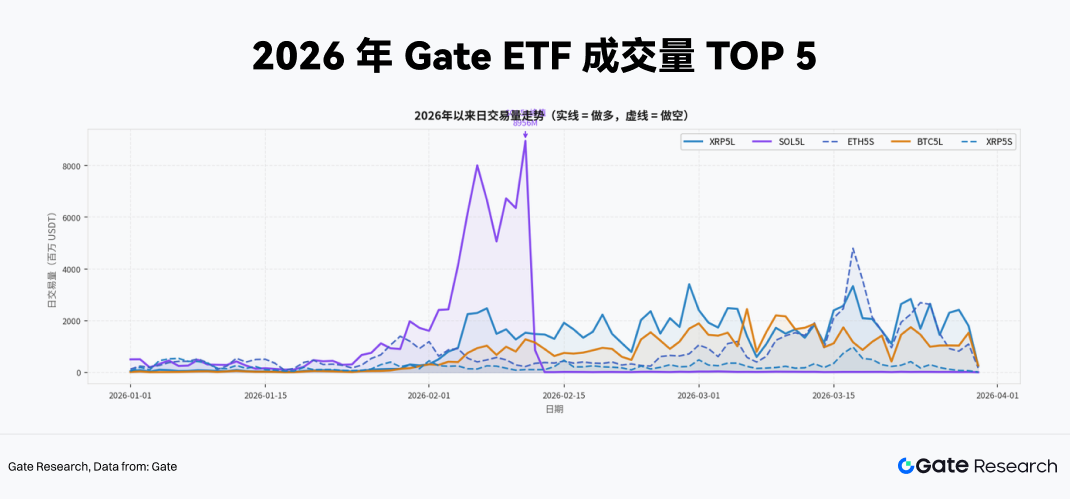
From the latest cumulative trading volume rankings, 5x leveraged products clearly dominate. The Top 5 products (XRP5L, SOL5L, ETH5S, BTC5L, XRP5S) are all 5x leveraged, indicating that capital participating in leveraged ETF trading currently exhibits extremely high risk appetite, with a preference for maximizing leverage to capture short-term volatility or execute high-intensity spot hedging.
In addition, daily volume trends show that SOL5L experienced an extreme single-day spike of nearly 9 billion USDT in early February. Such liquidity pulses are often closely tied to major fundamental events in the underlying asset and are typical of event-driven trading surges.
Overall, when constructing practical trading strategies, we focus on 5x leveraged products with average daily trading volumes in the hundreds of millions of USDT. Compared to lower-leverage or less active products, they offer superior market depth and exit efficiency, effectively absorbing the impact cost of large orders.
3.2 Dynamic Hedging and Momentum Breakout Strategy Design for High-Leverage ETFs
For investors holding spot crypto positions, the biggest challenge is how to protect downside exposure during macro shocks or technical breakdowns in a low-cost manner without liquidation risk. Traditional solutions typically include: opening equivalent short positions in perpetual futures, purchasing put options, or converting holdings into stablecoins.
However, each of these approaches has clear drawbacks. Perpetual futures require margin and carry liquidation risk during sharp price spikes; options can be prohibitively expensive in high implied volatility environments; and converting to stablecoins means fully giving up potential upside.
Leveraged ETFs such as XRP5L, SOL5L, and ETH5S offer a fourth solution with distinct structural advantages under certain conditions:
-
No Margin Requirement: Buying inverse ETFs is essentially a spot transaction, with maximum loss capped at the initial capital, fundamentally eliminating the risk of forced liquidation common in derivatives markets.
-
Superior Capital Efficiency: With 5x leverage, hedging the same notional exposure requires only 20% of the capital, leaving the remaining 80% available for yield-generating strategies or as liquidity reserves.
-
Hedging Precision: For example, ETH5S maintains a stable correlation of approximately -0.91 to -0.97 with ETH, providing highly reliable short-term hedging effectiveness (to be further validated below).
Based on the above analysis, we construct the following trading strategy framework targeting high-liquidity, high-leverage (5x) crypto ETFs such as XRP5L, SOL5L, and ETH5S.
3.2.1 Entry Signal Design
One of the core risks of leveraged ETFs is rapid NAV erosion caused by incorrect directional bets. Therefore, right-side positioning is the primary principle in strategy design. Before trading, specific entry signals can be defined—for example, ahead of macro events such as Fed decisions or nonfarm payroll releases, or when crypto spot prices break above/below key technical levels (e.g., the 20-day moving average) while volatility indicators (such as 7-day annualized volatility) begin to reverse.
Taking the use of a 5x inverse ETF for hedging or speculation as an example, the following three conditions must be met simultaneously:
-
Technical Breakdown: The underlying asset (e.g., ETH or SOL) closes below its 20-day simple moving average (SMA) on the daily chart, with a deviation exceeding 2%.
-
Volatility Shift: The 7-day annualized realized volatility of the underlying asset rises sharply compared to the previous week (e.g., an increase of more than 15%), indicating heightened market attention and emotional activity.
-
Funding Rate Signal: From a short perspective, perpetual futures funding rates remain positive for three consecutive days, meaning longs are still paying funding. This suggests that leverage has not been fully unwound, and short-side momentum may not yet be fully released—raising the likelihood of a long squeeze. (The logic reverses for long setups.)
In terms of position building, only 50% of the target position is established on the first day when signals trigger. If the downtrend is confirmed by the next day’s close, the position is increased to 100%, reducing the risk of false breakouts.
3.2.2 Momentum Breakout Detection
Beyond structural hedging, high-leverage ETFs are also powerful tools for capturing extreme one-sided market moves. As illustrated by the surge in SOL5L trading volume in early February, major market events can generate substantial excess returns for leveraged ETFs.
The core signal for momentum breakout strategies comes from abnormal surges in ETF trading volume, as capital inflows tend to lead price indicators during extreme market conditions:
-
Trigger Condition: A 5x ETF’s daily trading volume exceeds 3x its 20-day average, while its price simultaneously breaks out of a recent consolidation range or resistance level.
-
Position Management: Such speculative trades should be strictly limited to 15%–20% of total strategy capital.
-
Risk-Reward Setup: Due to high leverage, a hard stop-loss must be set immediately upon entry (e.g., -15% from entry NAV). In strong trends, 5x ETFs can achieve 30%–50% gains in a short period, creating an attractive asymmetric payoff profile.
3.2.3 Strict Exit Mechanism
For leveraged ETFs, exit strategy design is just as critical as entry signals. Due to volatility decay, time itself becomes a cost—each price oscillation (up then down, or vice versa) causes irreversible NAV erosion. Holding positions while waiting for unclear trends is therefore one of the most dangerous behaviors in leveraged ETF trading.
To address this, we implement a dual exit mechanism for the ETH5S strategy, covering both time-based and signal-based risk controls:
-
Time Stop-Loss: Each ETH5S position must not be held for more than 5 calendar days. Regardless of profit or loss, positions are forcibly closed once this limit is reached. The rationale is that if the market has not moved as expected within 5 days, the original entry logic is likely invalid. Moreover, if the market enters consolidation, volatility decay accelerates significantly from days 6–10. Time-based exits are also an effective way to counteract behavioral biases such as loss aversion.
-
Trailing Take-Profit: The purpose of profit-taking is to protect gains while allowing trend participation. In strong trends, ETH5S may deliver 50%–80% short-term returns. A trailing mechanism ensures partial profit realization while keeping some exposure for continued upside.
-
Specifically:
-
When profit reaches +20%, reduce the position by 50% and move the stop-loss to +10% on the remaining portion.
-
When profit reaches +40%, reduce another 25%, leaving 25% of the initial position, and move the stop-loss to +25%.
-
Additionally, if the price retraces more than 15% from the peak profit level, all remaining positions are closed.
3.3 Empirical Test of Event-Driven Asymmetric Hedging and Momentum Breakout Using ETH5S
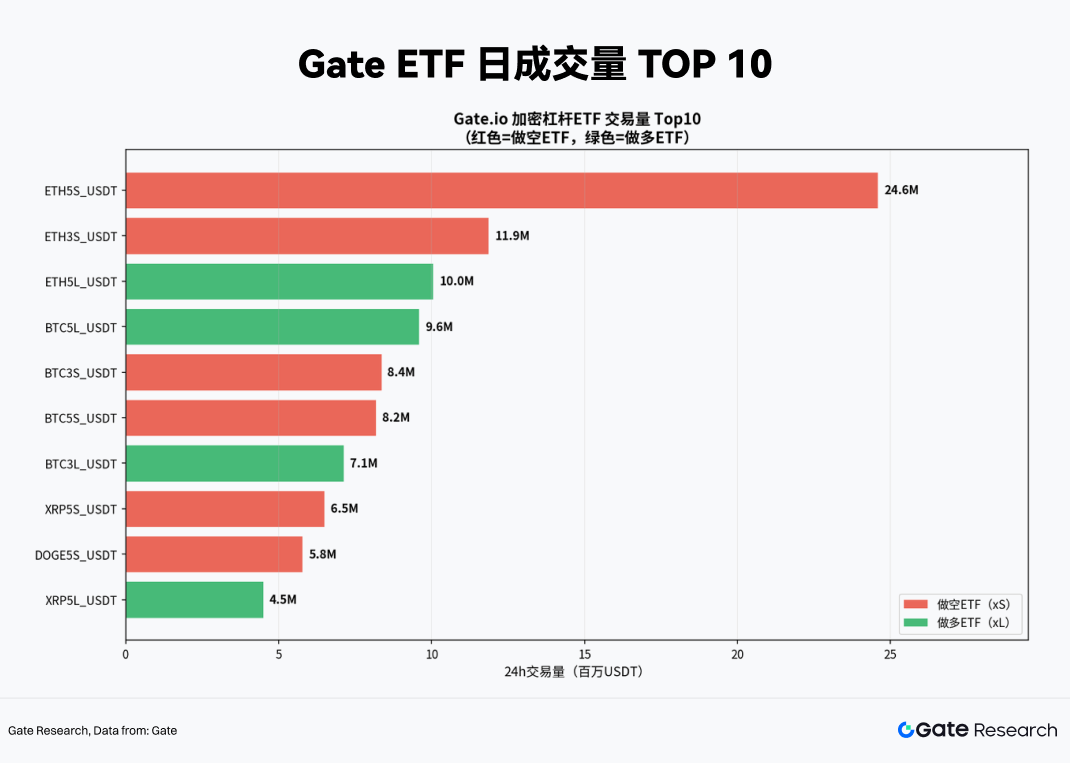
Based on the above strategy framework, we proceed to conduct an empirical test using a selected ETF. From the recent trading volume distribution (March 19, 2026), ETH5S demonstrates overwhelming liquidity dominance, ranking first with a daily trading volume of 24.6 million USDT, making it the primary battlefield for short-term capital. The significant liquidity gap between ETH5S and the second to tenth-ranked products implies superior entry depth and exit efficiency, allowing large orders to be executed with minimal market impact. Therefore, ETH5S is selected as the core strategy instrument.
3.3.1 Asymmetric Hedging with ETH5S
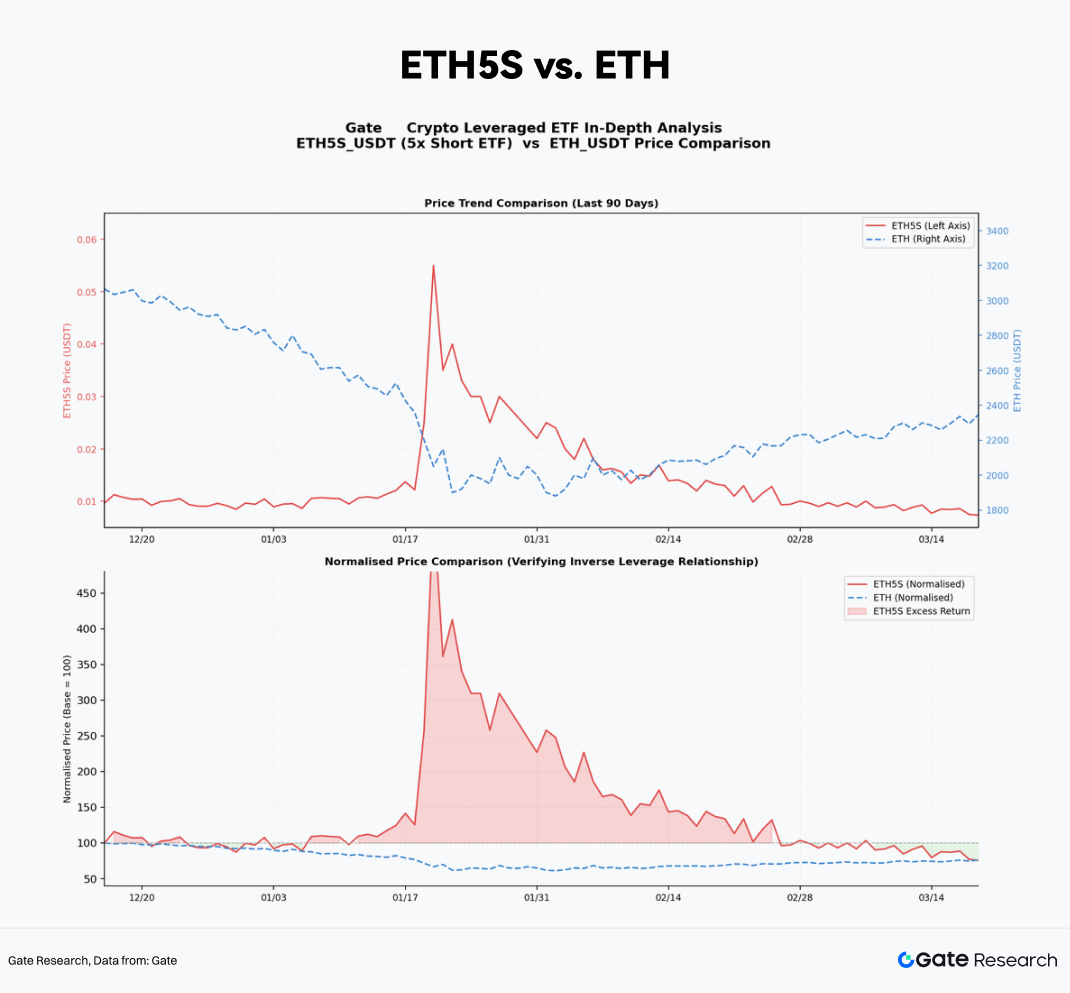
We first validate the product mechanics of ETH5S. Using the Gate MCP interface, we extract 90-day daily price data for ETH5S and ETH spot from December 2025 to March 2026.
By normalizing both price series to a base value of 100 at the start of the observation period, we can clearly observe a mirrored relationship in relative returns. During major ETH drawdown periods—such as mid-February 2026, when ETH declined 14% in a single week due to macro shocks—ETH5S delivered approximately a 65% NAV increase. This is slightly below the theoretical maximum of 5 × 14% = 70%, with the difference primarily attributable to volatility decay and management costs.
Overall, ETH5S proves to be a reliable hedging instrument at the structural level, with no significant tracking error that would compromise hedge effectiveness.
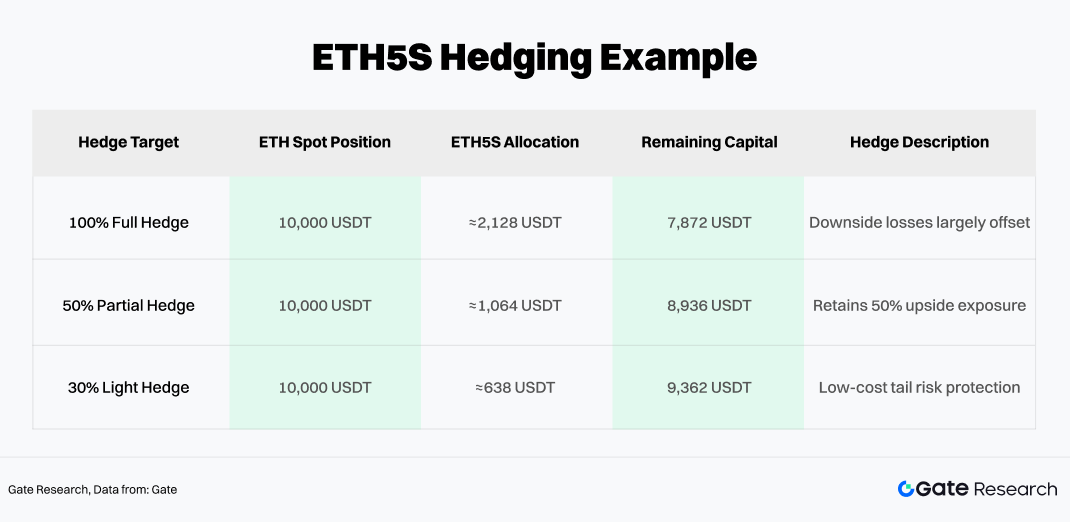
To determine the appropriate hedge ratio in practice, assume a spot ETH position valued at 10,000 USDT with a target hedge ratio of 100% (full downside protection). The required ETH5S allocation can be calculated as:
ETH5S Position Size = Spot ETH Value × Hedge Ratio ÷ Effective Leverage (β)
Here, the effective leverage β is slightly lower than the theoretical value due to decay and other factors. Based on recent averages, we set β ≈ -4.7. The resulting hedge allocations are as follows:
3.3.2 Backtest of ETH5S Momentum Breakout Strategy
Beyond structural hedging, capturing momentum breakouts during extreme market conditions can generate meaningful short-term alpha. The core signal for this approach is abnormal volume expansion in ETH5S, as volume tends to lead price confirmation during panic-driven sell-offs.
We define the entry signal as follows: When ETH5S daily trading volume exceeds 3× its 20-day average, and its price simultaneously breaks above a recent downward trendline (indicating accelerating short momentum), this is interpreted as a local peak in market panic. At this point, a short-term speculative position can be added on top of the existing hedge.
Historical backtesting of this signal (based on Gate MCP data from January 2024 to March 2026) shows:
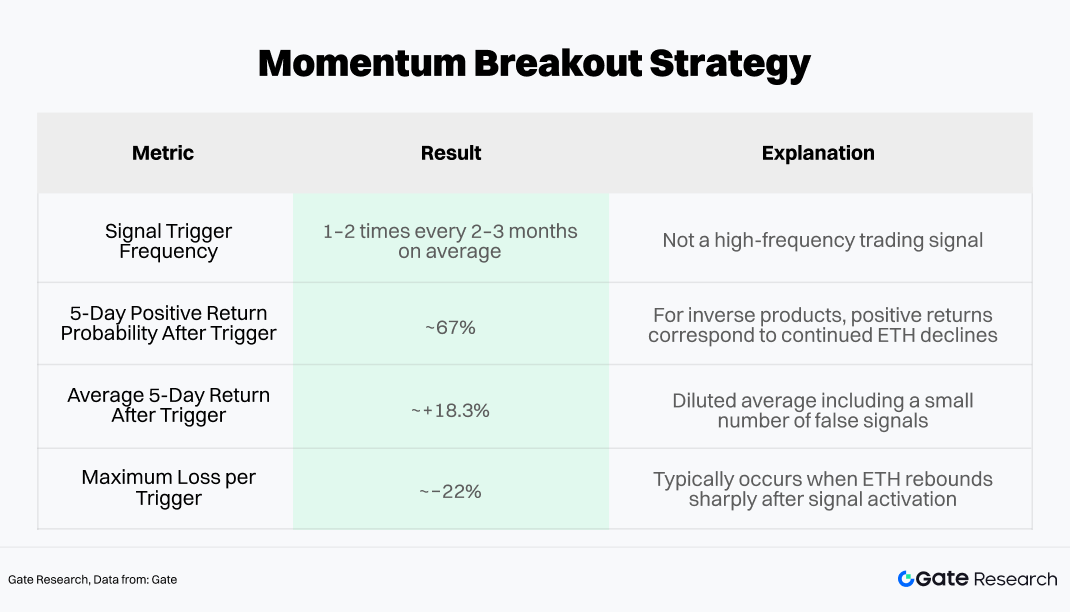
Based on these results, the momentum breakout module should be limited to 15%–20% of total strategy capital, with an immediate stop-loss set upon entry (recommended at -15% of entry NAV).
This creates an approximate risk-reward ratio of 1.2:1 (expected gain of +18% vs. maximum loss of -15%). When combined with a 67% win rate, the strategy yields a positive expected value in theory.
4. Conclusion
The rise of crypto ETFs has not only injected unprecedented liquidity into the market but has also fundamentally reshaped its structure and volatility dynamics. The accumulation of institutional capital has driven a long-term convergence in the volatility of major assets such as Bitcoin. In this context, leveraged ETFs offered by centralized exchanges—serving as high-leverage instruments without margin requirements—have demonstrated unique tactical value in both one-sided trends and tail-risk hedging.
However, crypto leveraged ETFs are not indiscriminate return amplifiers that can be passively held. Rather, they are precision instruments that require carefully calibrated conditions for use. Under the right market regime, they enable efficient and capital-light risk hedging; under flawed positioning logic, their NAV erosion can be both rapid and severe.
Based on data filtered through Gate MCP, we construct a trading strategy centered on right-side entry, leveraging volume-driven momentum breakout signals to capture excess returns. Execution is anchored in phased position building, momentum-based scaling, and strict exit mechanisms—achieving a dynamic balance between risk and return while mitigating volatility decay.
ETH5S, with its superior liquidity and stable negative correlation, has been validated as an efficient and reliable hedging instrument, capable of delivering precise asymmetric risk protection with relatively low capital usage. On top of the hedging layer, introducing momentum signals based on “volume expansion + trend breakout” enables the capture of short-term alpha during extreme downturns. Historical backtesting shows a ~67% win rate and positive expected returns. By capping momentum allocations at 15%–20% and enforcing strict stop-loss rules (e.g., -15%), the overall strategy balances downside protection with return enhancement while controlling drawdowns.
Looking ahead, the institutionalization of the crypto market is far from complete. As sovereign wealth funds, insurance capital, and pension systems increasingly incorporate crypto assets into their portfolios, the market structure will continue to evolve: volatility regimes may further compress, liquidity premiums may continue to decline, and macro-driven pricing dynamics will play an increasingly dominant role in short-term price behavior. The effective window for leveraged ETF strategies may narrow, and signal noise may become harder to filter—yet the reliability of these instruments is likely to improve alongside deeper market liquidity.
Strategies that remain competitive in this evolving landscape will not be static rule sets, but adaptive frameworks—those that internalize strict risk discipline, integrate real-time data analysis into decision-making, and maintain a consistent respect for market complexity. Markets will evolve, tools will iterate, but only a deep understanding of underlying mechanisms will enable investors to navigate each structural transition and uncover new opportunities.
References
Gate Research is a comprehensive blockchain and cryptocurrency research platform that provides deep content for readers, including technical analysis, market insights, industry research, trend forecasting, and macroeconomic policy analysis.
Disclaimer
Investing in cryptocurrency markets involves high risk. Users are advised to conduct their own research and fully understand the nature of the assets and products before making any investment decisions. Gate is not responsible for any losses or damages arising from such decisions.