Q3 Derivation Report: Anchors and Limits, Understanding the Structure of Funding Rate

Long story short:
With the explosive growth of decentralized derivatives platforms like Hyperliquid and the introduction of Pendle funding rate trading, the cryptocurrency funding rate market is continuously evolving. Specifically, two structural forces can be attributed to the dynamics of the funding rate market, thereby creating predictable trading opportunities:
- Anchor Point of the Formula (Lower Limit): The perpetual swap contract formula incorporates an interest rate component that forces the interest rates to cluster around 0.01% (positive bias). Data shows that over 92% of the funding rates will be positive in the third quarter of 2025.
- Trader Action: Do not bet on sustained negative interest rates. The formula is actively pushing interest rates up.
- Arbitrage Capital (Upper Limit): Includes billions of dollars in institutional capital from participants such as Ethena, which immediately shorts high premium contracts when interest rates surge.
- Trader Action: Do not expect high interest rates to last. The spike is temporary, as arbitrage activities will quickly push the premiums and interest rates back to the 0.01% baseline.
Compared to Binance and Hyperliquid, BitMEX has the most stable funding rates, reaching the 0.01% anchor point more frequently than other exchanges. In terms of volatility, ETH's Beta value is higher than that of BTC.
To succeed in funding rate trading, one must master market structure rather than market sentiment.
Introduction
Nine years ago, BitMEX invented perpetual contracts, fundamentally changing the way people trade cryptocurrencies. In our previous second quarter derivatives report, “The Evolution of Funding Rates: A Nine-Year Analysis of BitMEX XBTUSD Funding Rates,” we detailed its evolution from a highly volatile speculative tool to a mature and stable market. Now, we are witnessing the next stage of this evolution: the emergence of a dedicated funding rate trading market.
Funding rate trading allows traders to speculate on prices and trade the underlying mechanisms of the market itself. But what drives these mechanisms? In this report, we will delve into the dynamics of the perpetual contract market and the funding rate formula, providing important insights for cryptocurrency traders.
Our research findings point to two powerful factors influencing the funding rate: the pull of the 0.01%/8-hour funding rate formula anchor and the enormous power of institutional arbitrage capital enforcing that formula. This report will explore these findings based on data from the third quarter of 2025 and provide traders with some key insights based on this structural understanding.
Funding Rate Nine-Year Evolution Review
As we discussed in previous reports, the crypto funding rate market for major tokens like Bitcoin has matured. During the early bull market of perpetual contracts, the Bitcoin funding rate often exceeded 0.2%/8 hours, equivalent to an annualized rate of over 200%.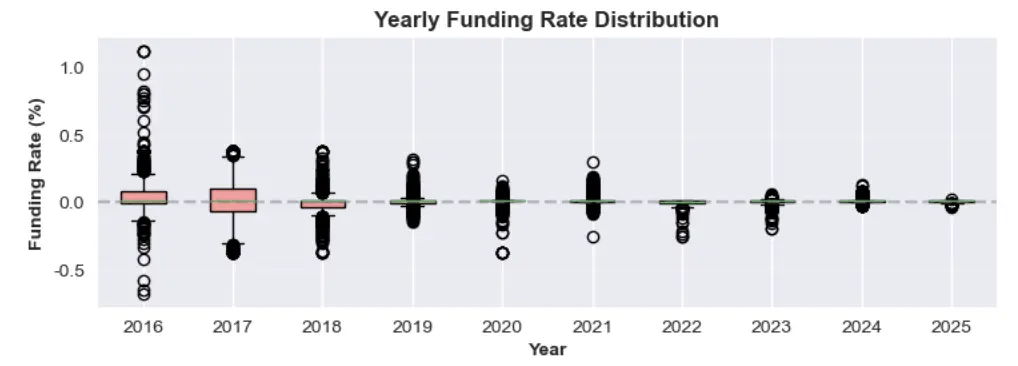
Figure 1: Annual Funding Rate Distribution from 2016 to 2025
Over the years, as the market deepens and more institutional capital flows in, this volatility has gradually weakened. The 2024-2025 cycle has established a new normal: the average funding rate is currently hovering around the baseline of 0.01%/8 hours. This situation occurs when the perpetual contract premium is extremely low, causing the rate to default to being linked to its interest rate component — a hallmark of systemic efficiency in financial markets.
Analysis of Funding Rate Structure
Why has there been such a drastic change in the funding rate market? This phenomenon can be explained by two key factors:
- The funding rate formula stipulates that when the price of the perpetual contract deviates little from the spot price, the rate defaults to the benchmark interest rate of 0.01%/8 hours.
- A large amount of capital is used for basis trading to obtain high funding rates.
Let's discuss these concepts in more detail.
Factor 1: The Anchor of the Formula (Hidden Positive Bias)
The funding rate for perpetual contracts is designed to keep the contract price in line with the spot price of the underlying asset. On BitMEX and some other exchanges, the funding rate is calculated every eight hours, and the calculation formula includes two main components: premium index and interest rate, balanced through a mechanism of restraint.
The common funding rate formula for exchanges like BitMEX, Binance, and Hyperliquid is:
F=P+clamp(I−P,−0.05%,0.05%)
The following is a detailed explanation of each part of the formula.
- Funding Rate (F): The amount periodically paid between long and short position holders of perpetual swap contracts.
- Average Premium Index (P): Measures market sentiment by tracking the difference between perpetual contract prices and spot prices. Calculated as the average over the funding rate period.
- If P is positive, it indicates that the contract is trading at a premium (above the spot price). The long position pays the short position.
- If P is negative, it indicates that the contract is trading at a discount (below the spot price). The short position pays the long position.
- Interest Rate (I): Fixed rate, usually set at 8 hours 0.01% (or an annual rate of 10.95%). 0.01%/ Initially set by BitMEX as an arbitrary number to incentivize arbitrage traders to provide liquidity.
- Clamp Function clamp(x, min, max): A buffering mechanism used to ensure that the difference between the interest rate and the premium index (I−P) does not become too large. The upper limit of the difference is +0.05%, and the lower limit is -0.05%, to prevent excessive fluctuations in the funding rate.
Scenario 1: Slight Premium/Discount, Funding Rate = 0.01%/8 Hours
A key feature of this formula is that it can stabilize the funding rate at the benchmark rate of (0.01%) when the market is relatively calm.
Golden Rule: As long as the average premium index (P) remains within the range of -0.04% to +0.06%, the funding rate (F) will be exactly 0.01%.
Within this range, the Clamp function can perfectly offset the premium or discount, causing the funding rate to revert to the interest rate by default.
Example A: Small Premium
Assume the average premium index (P) is +0.02%.
- Calculate the difference: I−P=0.01%−0.02%=−0.01%
- Apply Clamping Function: Since -0.01% is within the range of [-0.05%, +0.05%], the clamped value is -0.01%.
- Calculate the final interest rate: F = P + ( cap value ) = 0.02% + ( − 0.01% ) = 0.01%
Example B: Small Discount
Now, suppose the average premium index (P) is -0.03%.
- Calculate the difference: I−P=0.01%−(−0.03%)=0.04%
- Apply Clamping Function: Since 0.04% is within the range of [-0.05%, +0.05%], the clamping value is 0.04%.
- Calculate the final interest rate: F=P+( cap value )=−0.03%+0.04%=0.01%
Both examples indicate that regardless of whether the average premium index (P) is slightly higher or lower than the funding rate, the final interest rate remains at 0.01%.
Scenario 2: Positive Deviation (Funding Rate During Discount Period is Positive)
A key point in the design of many perpetual contracts is their inherent positive bias. This means that even if the contract trading price is slightly discounted, long positions usually still pay a small fee to short positions. This is because the fixed positive interest rate (I=0.01%) acts as a bottom limit.
This also explains why the funding rate is usually a small positive number (e.g., 0.005%) rather than a negative number.
Example: Discount on Perpetual Contracts with Positive Funding Rate
Assuming the market is bearish, the average premium index (P) has dropped to -0.045%.
- Calculate the difference: I−P=0.01%−(−0.045%)=0.055%
- Application of Clamping Function: The difference of 0.055% exceeds the upper limit of the clamping function. Therefore, the clamping function will forcibly reduce this value to the maximum value of 0.05%.
- Calculate the final fee rate: F=P+( constraint value )=−0.045%+0.05%=0.005%
In this example, although the trading price of the perpetual contract is lower than the spot price, the funding rate is still positive. Long positions are still paying short positions, which indicates that the structural preference favors short positions with a positive bias.
Scenario 3: When the funding rate becomes zero or negative
To make the funding rate neutral or negative, the market discount must be significant enough to overcome the positive bias brought by the interest rate.
- When the premium index (P) is exactly -0.05%, the funding rate becomes 0.00%.
- I−P=0.01%−(−0.05%)=0.06%
- The cap value is set to 0.05%
- F=P+( Constraint Value )=−0.05%+0.05%=0.00%
- When the average premium index (P) falls below -0.05%, the funding rate becomes negative. For example, if P = -0.10%, the funding rate will become negative, and shorts will begin to pay fees to longs to encourage buying, pushing the contract price back towards the spot price.
Factor 2: Massive Capital for Interest Rate Arbitrage
The funding rate formula defines the rules, while the arbitrage capital is responsible for executing the rules. Currently, the outstanding contract size of the major tokens (Bitcoin, Ethereum, Solana) on various cryptocurrency exchanges has reached hundreds of billions of dollars. From proprietary trading firms to DeFi protocols like Ethena, arbitrage participants have billions of dollars in funds that can be deployed immediately once the funding rate becomes attractive. When the perpetual contract prices show a high premium, these institutions will sell perpetual contracts and buy spot assets to collect high funding rates, thereby compressing the premium.
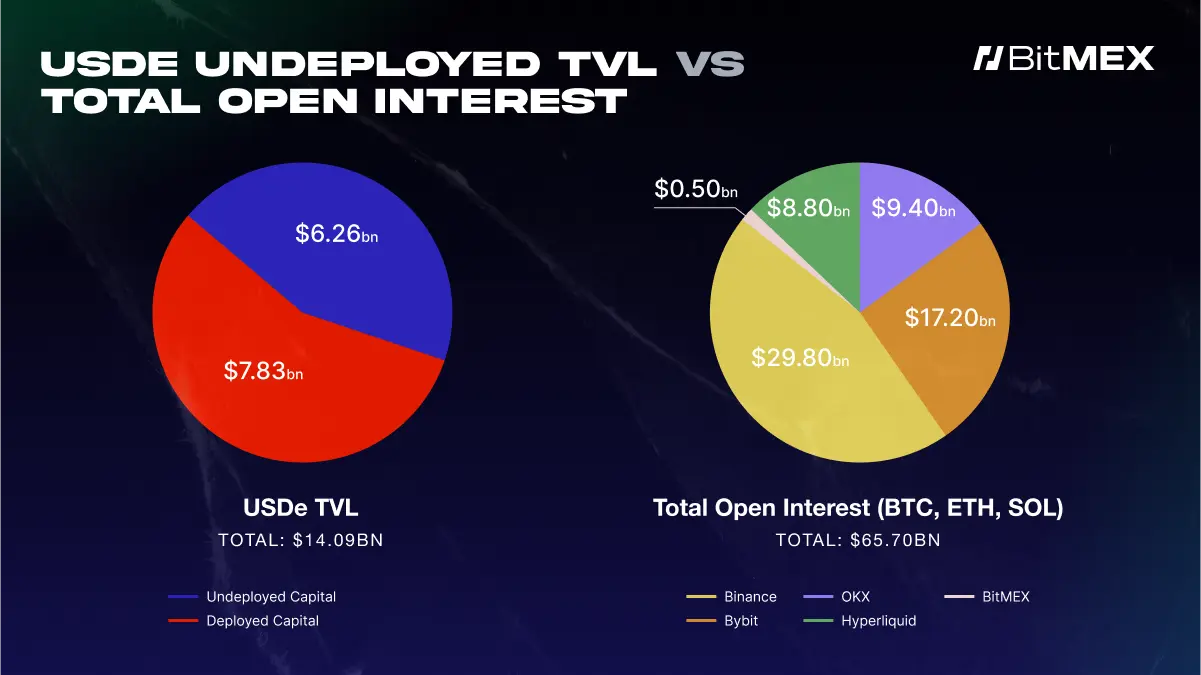
Figure 2: Total locked value of Ethena on September 25, 2025, (USDe) compared to the total open contract volume of major cryptocurrency exchanges BTC, ETH, and SOL.
Figure 2 clearly shows how Ethena's USDe (a major funding rate arbitrage platform) plays a significant role in explaining the transient high funding rates. The pie chart on the left shows that Ethena (USDe) has $7.83 billion in funds awaiting deployment. The pie chart on the right displays the total open contract volume across major exchanges (as of September 21, 2025), amounting to $65.7 billion. Comparing the two pie charts, it is evident that a single protocol like Ethena plays a huge role—with its undispersed funds amounting to 12% of the market's open contract volume.
Whenever the funding rate becomes attractive, institutions deploy their available capital to generate profits. This arbitrage strategy will lower high funding rates.
In short, a large amount of undeployed capital pools serve as a cap on the funding rate, preventing it from staying high for a long time.
Perspective Practice: Review of Funding Rates in Q3 2025
To analyze whether the above theories regarding the lower and upper limits of funding rates are valid, we examined the funding rate data for BitMEX, Binance, and Hyperliquid in the third quarter of 2025. This confirmed the two core theories discussed in the previous section:
- The funding rate remains positive for the vast majority of the time, driven by the structural positive bias in the calculation formula.
- The funding rate rarely stays significantly above the 0.01% baseline because a large amount of arbitrage capital from institutions like Ethena will intervene, compressing the high premium.
Figures 3 and 5 show the historical funding rates for BTC and ETH in Q3 2025, which confirms our two core findings. First, the funding rates for these three platforms remained positive for the vast majority of this quarter, which is a direct result of the structural positive bias of the formula. Second, it indicates that the funding rates for BitMEX and Binance have consistently been anchored close to the baseline of 0.01%, reflecting the strong effect of arbitrage capital.
A noteworthy exception is Hyperliquid, whose funding rates exhibit significant volatility and frequently spike to levels far above this baseline—we will analyze this phenomenon in the next section.
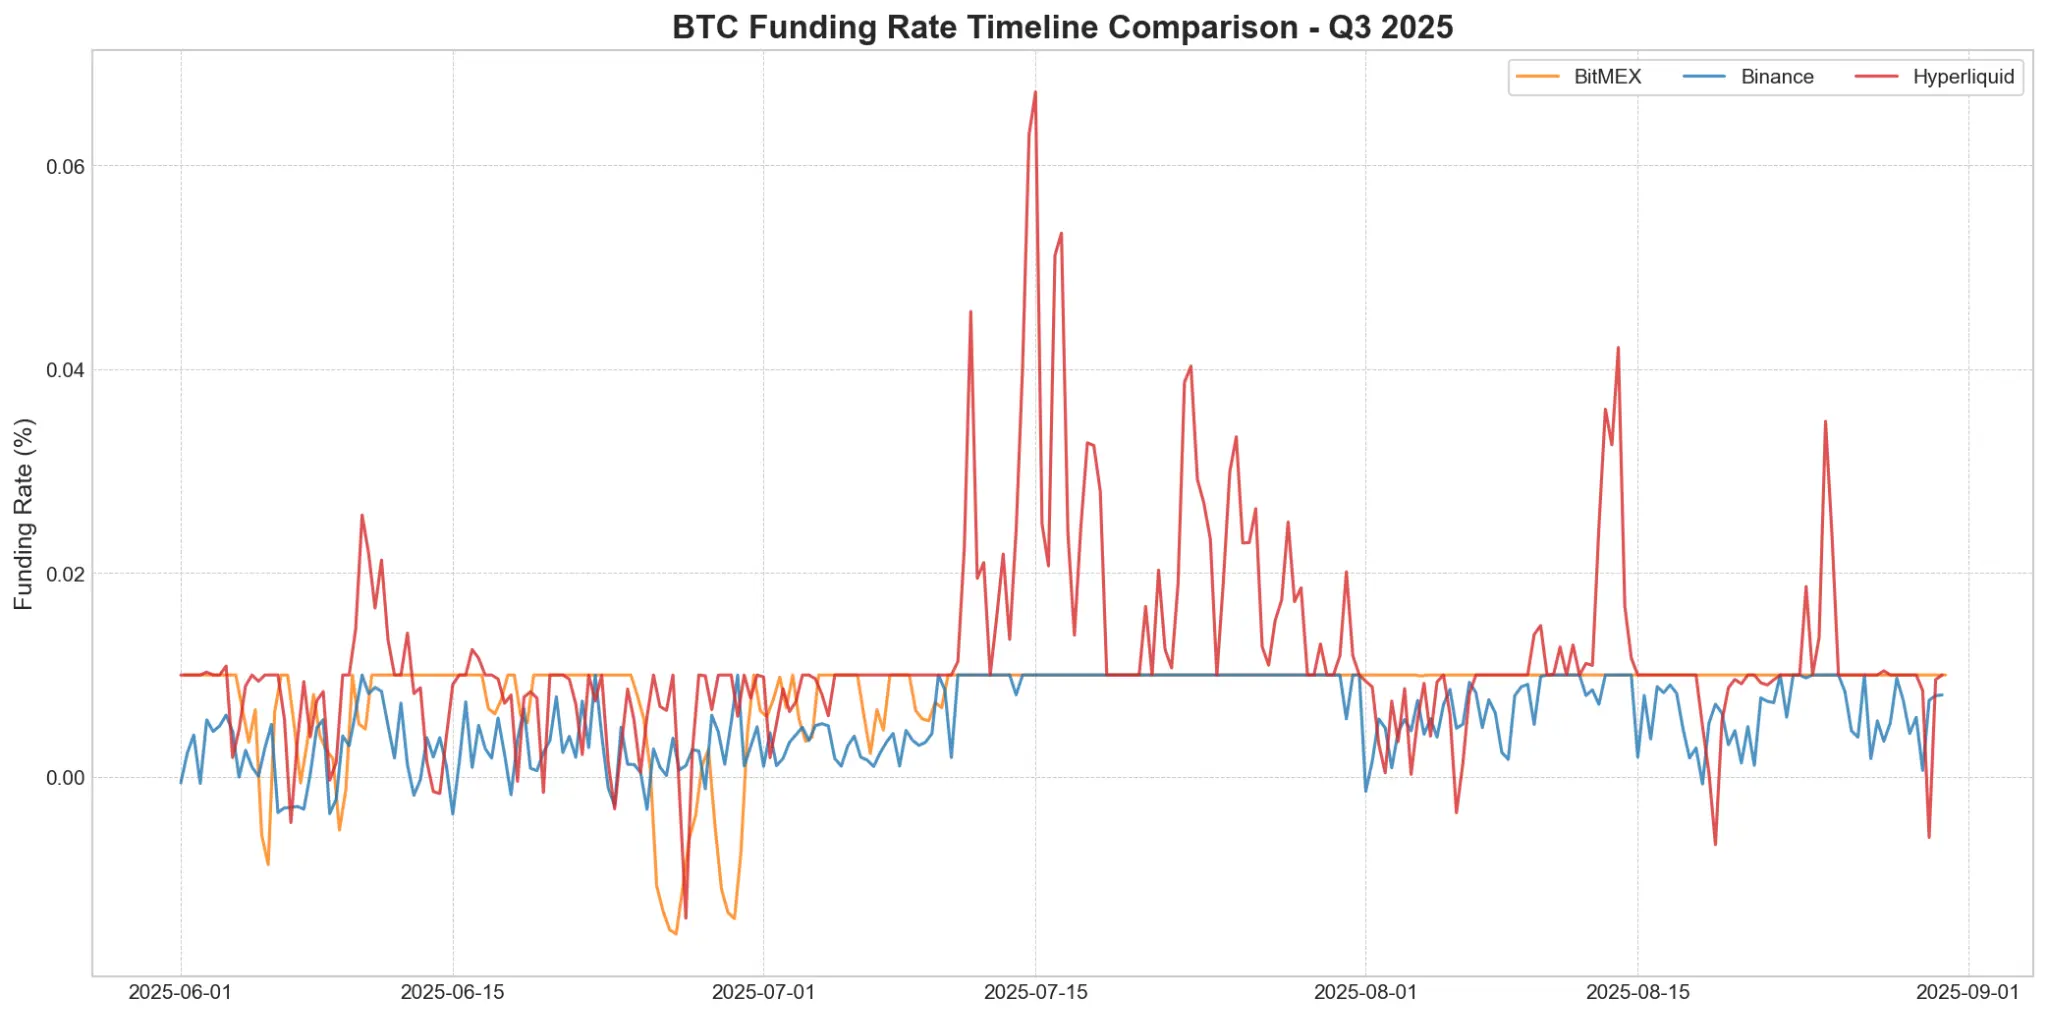
Figure 3: The varying trends of BTC funding rates across exchanges in Q3 2025. Hyperliquid (red) shows significant volatility, with sharp increases often exceeding the 0.01% cap. In contrast, BitMEX (orange) and Binance (blue) provide a more stable interest rate environment.
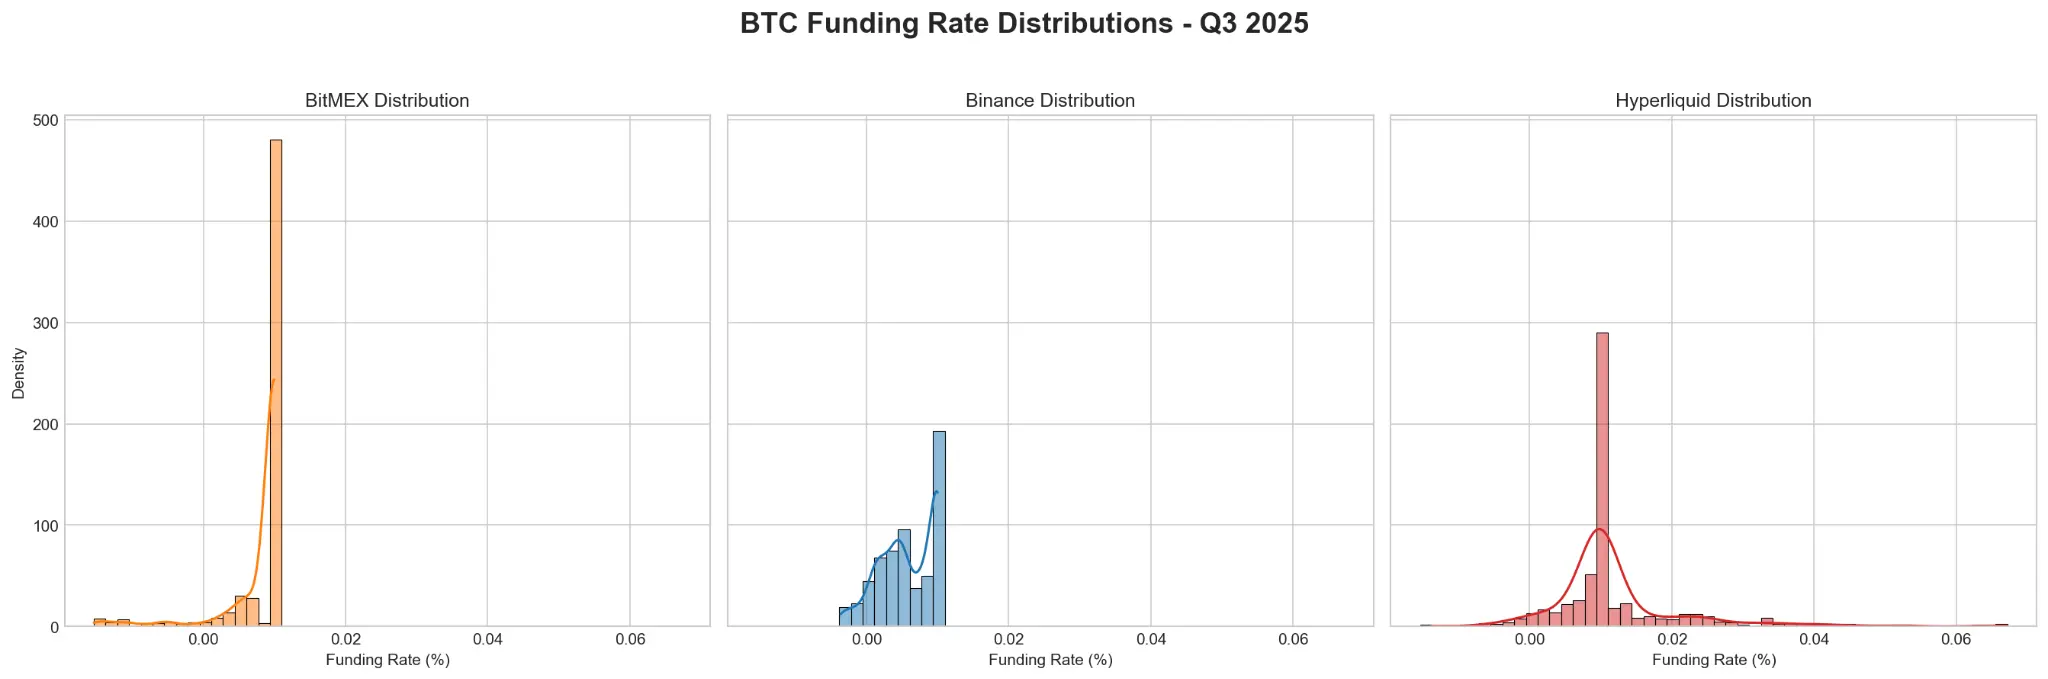
Figure 4: Distribution of BTC funding rates across exchanges in the third quarter of 2025.
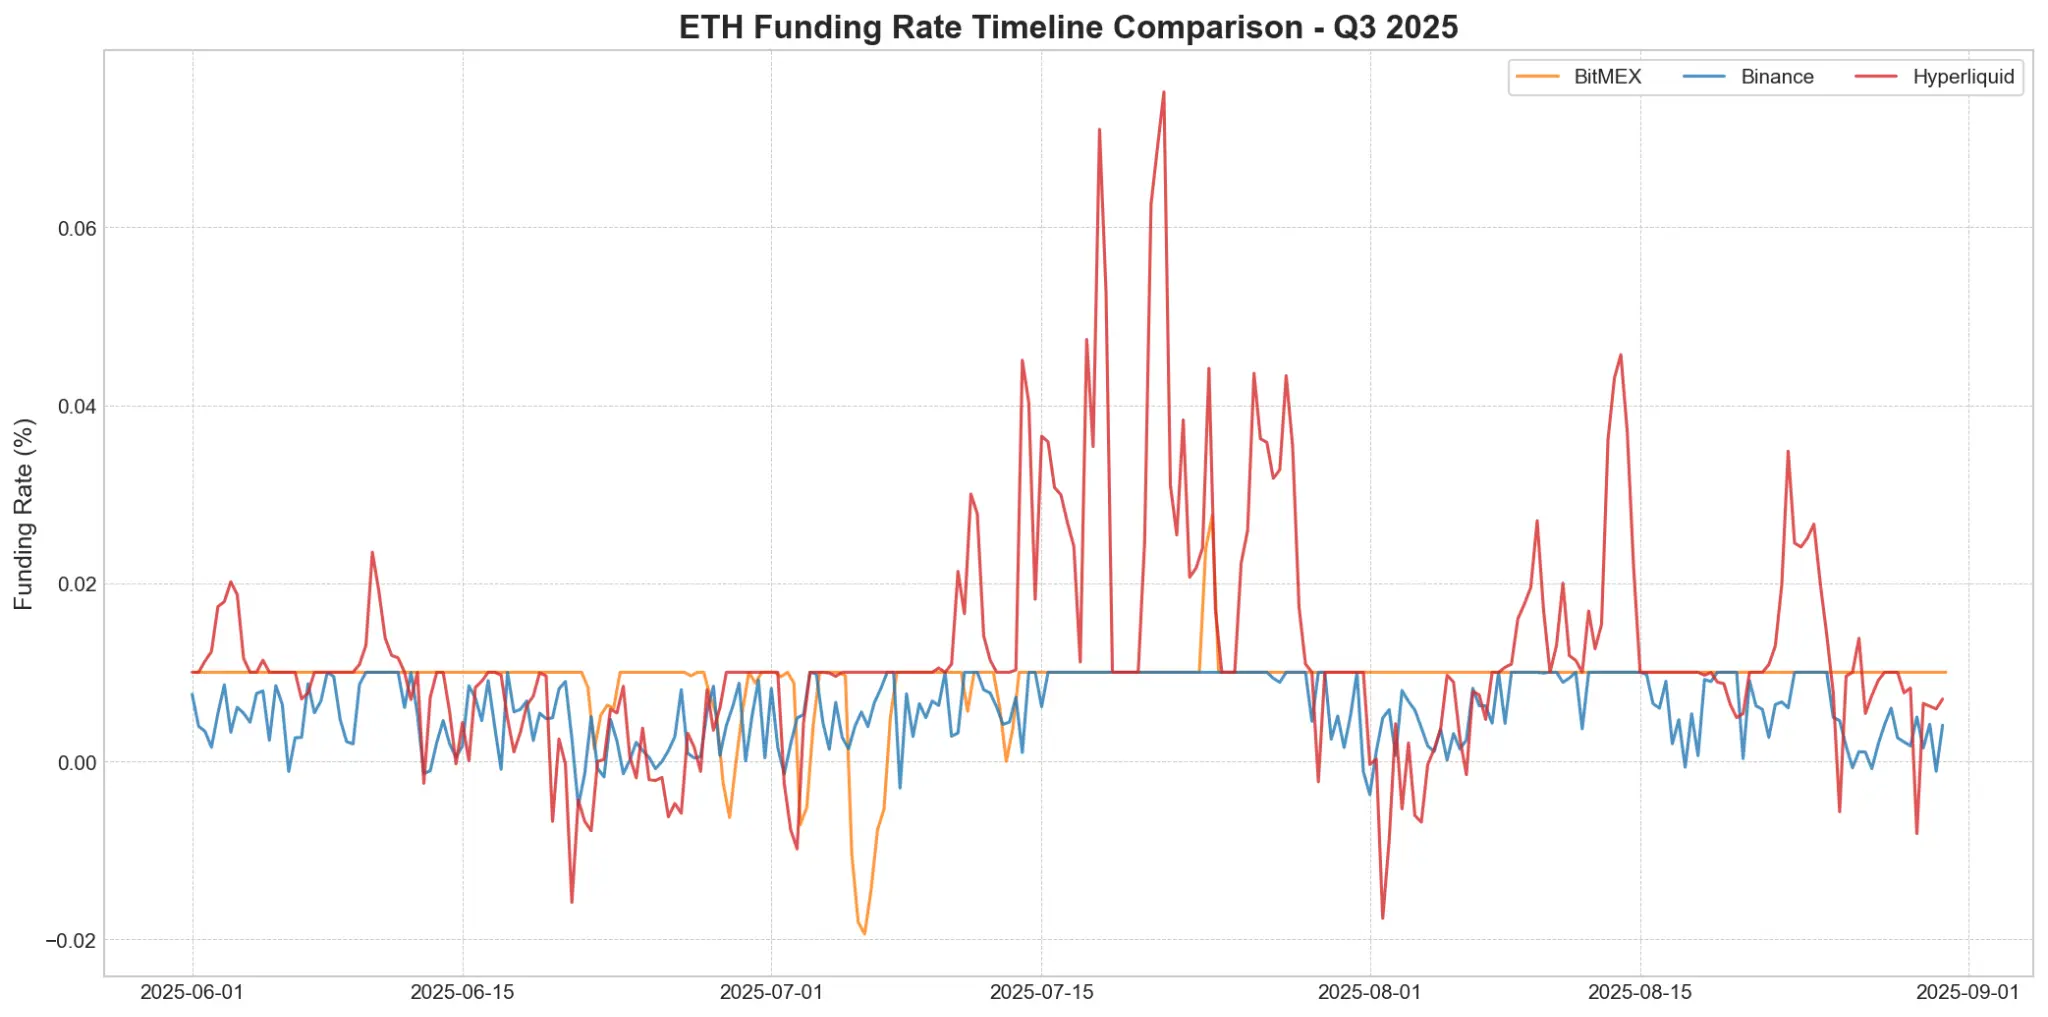
Figure 5: The comparison of ETH funding rates in the third quarter of 2025 reveals a behavior pattern similar to that of BTC. The high liquidity (red) is characterized by high volatility and frequent large fluctuations, while BitMEX (orange) and Binance (blue) maintain a more stable and predictable interest rate environment.
Figure 6: Distribution of Ethereum funding rates for BitMEX, Binance, and Hyperliquid in the third quarter of 2025. The chart shows that the most common Ethereum funding rate among the three exchanges is 0.01%, with BitMEX being the most stable and Hyperliquid exhibiting the highest volatility.
Differences in funding rates among exchanges: Stability vs. Volatility
BitMEX, Hyperliquid, Binance and Hyperliquid platform Bitcoin (BTC) funding rate analysis
$BTC Funding Rate Data (Q3 2025)
| Exchange | Mean | Std Dev | Min | Max | Freq. of 0.01% | Freq. Positive |
| BitMEX | 0.0081% | 0.0049% | -0.0154% | 0.0100% | 78.19% | 93.83% |
| Binance | 0.0057% | 0.0039% | -0.0036% | 0.0100% | 30.70% | 92.54% |
| Hyperliquid | 0.0120% | 0.0097% | -0.0139% | 0.0672% | 39.45% | 95.98% |
Funding rate analysis of Ethereum (ETH) on BitMEX, Hyperliquid, and Binance, as well as Hyperliquid
$ETH funding rate data (Q3 2025)
| Exchange | Mean | Std Dev | Min | Max | Freq. of 0.01% | Freq. Positive |
| BitMEX | 0.0090% | 0.0045% | -0.0194% | 0.0276% | 87.52% | 95.12% |
| Binance | 0.0060% | 0.0038% | -0.0050% | 0.0100% | 31.71% | 92.68% |
| Hyperliquid | 0.0126% | 0.0131% | -0.0176% | 0.0752% | 33.57% | 88.81% |
The above image clearly shows the differences in funding rate stability between BitMEX and other exchanges such as Hyperliquid and Binance.
- BitMEX: As one of the oldest cryptocurrency derivatives exchanges, BitMEX is the benchmark. During the analysis period, the funding rate for BTC was exactly 0.01% for 78.19% of the time, while the funding rate for ETH was exactly 0.01% for 87.52% of the time. The low standard deviation indicates that its funding rates are the most predictable. This reflects that the premiums of BTC and ETH perpetual contracts on BitMEX are mostly in line with spot prices.
- Binance: As the largest cryptocurrency exchange, Binance's average funding rates for BTC and ETH are the lowest, with a median always below 0.01%. This indicates a persistent short-selling pressure on Binance compared to BitMEX. This reflects a long-term average market sentiment rather than a momentary impulse.
- Hyperliquid: The funding rate volatility of Hyperliquid is the most pronounced among the three exchanges, with its average funding rate and standard deviation consistently the highest. This is directly attributed to its 1-hour funding rate calculation window, as well as its inability to offer leverage as high as BitMEX, which causes it to overreact to the basis. The observed highest funding rates for BTC and ETH were 0.067% and 0.075%, respectively, far exceeding the levels of other exchanges, highlighting the trend of its funding rate volatility.
Bitcoin vs. Ethereum Funding Rate
Although the funding rates of the two assets show a similar overall trend across exchanges, the data reveals a key difference: in the third quarter of 2025, the funding rate of ETH exhibits “higher beta.”
- Slightly higher fee rate: The average funding rate for ETH is slightly higher than that of BTC across all exchanges.
- Significantly higher volatility: On the Hyperliquid platform, the funding rate for ETH is 0.0131%, which is nearly 35% higher than BTC's 0.0097%. This means that not only is the average funding rate for ETH higher, but its volatility is also greater, making it more likely to experience extreme peaks.
Key Points for Traders
Understanding this market structure can provide a framework for identifying high-probability trades. Traders do not need to predict market sentiment but can instead bet on the execution of the market's own rules.
1. Structural Bottom Line: Never Counteract the Positive Deviation of the Formula
A key finding is that the funding rates are predominantly positive—our data for Q3 2025 shows that this has been the case more than 92% of the time. This is not random; it is a direct result of the +0.01% interest rate component in the formula, which provides a continuous push. Even if you are extremely bearish, keep in mind that a positive funding rate below 0.01% already implies that the trading price of perpetual contracts is below the spot price. For the interest rate to become negative, the market must overcome this inherent positive bias.
. Therefore, if markets like Boros show an implied funding rate close to zero, then going long has a structural advantage over going short and expecting the rate to remain negative. In this case, the funding rate formula is not your friend—it is actively pushing the rate back into positive territory.
2. Arbitrage Limit: Don't Expect High Interest Rates to Last
Just as the formula creates a soft bottom line, the availability of large institutional capital also creates a hard top line. Once the funding rate significantly rises above the benchmark of 0.01%, it brings double-digit annualized returns, which are hard for arbitrageurs to resist.
Billions of dollars in capital from institutions and DeFi protocols are continuously focusing on these opportunities. When a premium arises, they will simultaneously short perpetual contracts and buy spot assets, which rapidly compresses the premium and forces funding rates to fall back. This means that while interest rates may spike, these spikes are essentially unstable and short-lived. Betting on sustained high interest rates is essentially betting on a large, efficient, and well-capitalized segment of the market.
Conclusion
Funding rate trading is an emerging trend in the cryptocurrency industry. At BitMEX, we look forward to witnessing the next evolution of cryptocurrency derivatives. Our analysis shows that success in the funding rate market does not stem from predicting chaotic market sentiment but rather from mastering the fundamental structure of the market.
Two core factors—the attractiveness of the funding rate formula at 0.01% and the large arbitrage capital pool executing that formula—create a highly predictable market environment. By understanding why interest rates are anchored and why negative rates are an anomaly, traders can move beyond price speculation and take advantage of the high-probability opportunities embedded in the market structure pioneered by BitMEX nine years ago.