
Date: Fri, Dec 26, 2025 | 06:30 PM GMT
The broader cryptocurrency market has been navigating a period of choppy and uncertain price action over the past several weeks, a phase that began after the sharp market-wide sell-off on October 10. During that correction, Ethereum (ETH) dropped nearly 28% over the last 60 days, applying sustained pressure across the altcoin sector — including ether.fi (ETHFI).
ETHFI has mirrored this weakness, sliding more than 31% over the same period. However, despite the sharp downtrend, recent price behavior suggests selling pressure may be easing. The token is now trading near a historically significant demand zone, where buyers have repeatedly stepped in before — raising the possibility that ETHFI could be approaching an inflection point.
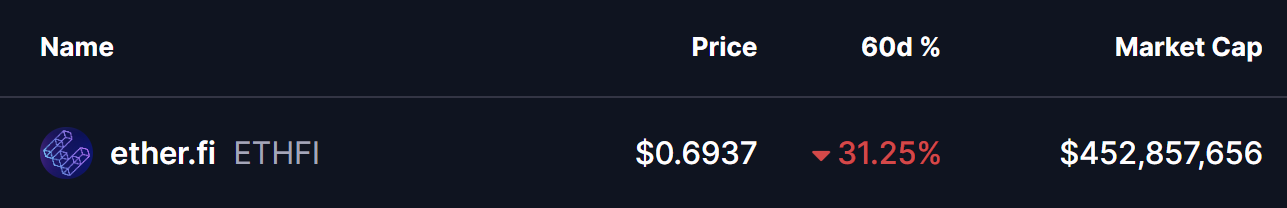
Source: Coinmarketcap
Double Bottom Pattern in Focus
On the daily timeframe, ETHFI appears to be forming a potential double-bottom structure — a classic reversal pattern that often signals exhaustion among sellers. The setup began after ETHFI was rejected from the $0.9233 resistance area, a move that triggered a sharp decline of nearly 28% and pushed price back toward the lower end of its range.
That sell-off dragged ETHFI into the $0.65 support zone, a level that has consistently acted as a strong demand area in the past. The chart now shows price revisiting this same region and stabilizing once again, suggesting buyers are actively defending it. The similarity between the first and second lows strengthens the case that a double-bottom base may be forming.
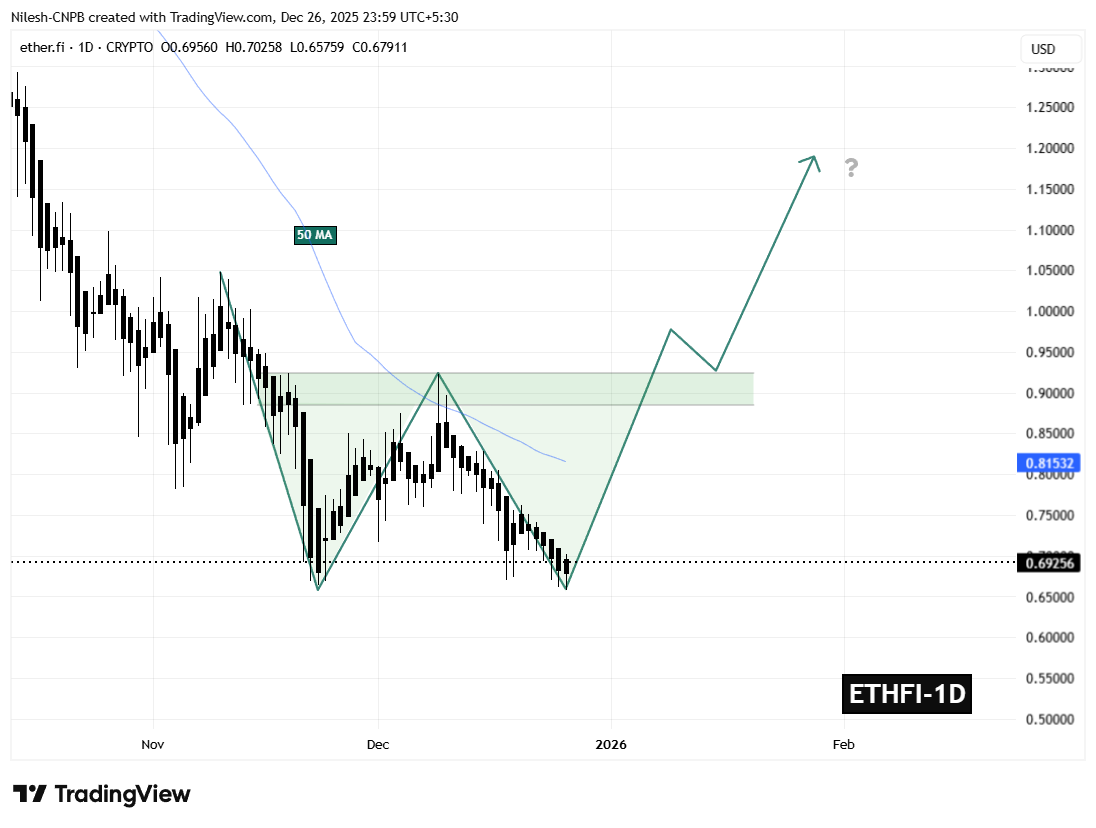
ETHFI Daily Chart/Coinsprobe (Source: Tradingview)
If this support continues to hold, the ongoing consolidation could mark the completion of the second bottom — a critical step in shifting momentum away from sellers and toward a potential trend reversal.
What’s Next for ETHFI?
The $0.65 support zone remains the most important level to monitor in the near term. As long as ETHFI holds above this area, the developing bullish structure remains valid and provides room for momentum to gradually rebuild.
On the upside, the first major challenge sits at the 50-day moving average near $0.8153. This level has repeatedly capped recovery attempts throughout the recent downtrend and now represents the initial test for buyers. A sustained move above this moving average would signal improving market structure and growing bullish confidence.
Beyond that, the $0.9233 neckline stands as the key confirmation level. A decisive breakout above this resistance would complete the double-bottom pattern and significantly strengthen the bullish outlook, potentially opening the door for a broader recovery move in the weeks ahead.
For now, ETHFI finds itself at a technically pivotal zone — one that could either reinforce the existing downtrend or mark the beginning of a meaningful rebound if buyers continue to defend support.
Disclaimer: The views and analysis presented in this article are for informational purposes only and reflect the author’s perspective, not financial advice. Technical patterns and indicators discussed are subject to market volatility and may or may not yield the anticipated results. Investors are advised to exercise caution, conduct independent research, and make decisions aligned with their individual risk tolerance.
Disclaimer: The information on this page may come from third parties and does not represent the views or opinions of Gate. The content displayed on this page is for reference only and does not constitute any financial, investment, or legal advice. Gate does not guarantee the accuracy or completeness of the information and shall not be liable for any losses arising from the use of this information. Virtual asset investments carry high risks and are subject to significant price volatility. You may lose all of your invested principal. Please fully understand the relevant risks and make prudent decisions based on your own financial situation and risk tolerance. For details, please refer to
Disclaimer.
Related Articles
Can Polygon's price rebound to January's high? Stablecoin activity and application revenue may become key catalysts
On February 25, news, Polygon's price has fallen sharply by over 50% from its January 2026 high, reaching an annual low of $0.088 on February 11. The overall market correction and multiple support levels being broken for Bitcoin are closely related. Currently, POL is consolidating in the $0.100 to $0.115 range.
According to DeFiLlama data, the total supply of stablecoins on the Polygon network has surged from $2.4 billion in early February to $3.26 billion, while the weekly revenue of DeFi applications on the network has increased by nearly 70%. The rise in activity and liquidity not only indicates an improvement in network health but may also attract more institutional capital into the market.
GateNewsBot14m ago
Bitcoin price drops 50% from historical highs, but Wall Street and corporations are疯狂ly increasing holdings
On February 25, it was reported that Bitcoin's trading price in 2026 dropped to $64,492, down nearly 50% from its all-time high in October 2025. Despite the price decline triggering market panic, adoption of Bitcoin by institutions and corporations continues to accelerate.
BeInCrypto reports that retail investors have a pessimistic outlook on Bitcoin prices, with searches for "Bitcoin to zero" reaching a record high. Crypto hedge funds are increasing cash holdings, with the average cash reserve reaching 15.32%, the highest in nearly a year. Coin Bureau co-founder Nic Puckrin pointed out that this reflects a defensive strategy by institutional investors against short-term price volatility.
GateNewsBot32m ago
USDT market capitalization declines for the second consecutive month, potentially putting pressure on market recovery
Tether's issued stablecoin USDT's market value decreased by 0.8% this month to $183.61 billion, marking two consecutive months of contraction, reflecting market capital outflows and putting pressure on Bitcoin and the overall market. Bitcoin's price experienced a rebound but then fell back to around $65,000.
GateNewsBot45m ago
Data: CryptoQuant: Bitcoin futures market dominated by bears, selling pressure reaches 3-month high
Bitcoin's current price is in the $62,000 - $68,000 range, with the futures market funding rate in negative territory, indicating that bearish sentiment is dominant. Selling pressure continues to increase, reaching the highest level in three months. Although the price decline leads to liquidations, in the long term, it helps improve market leverage conditions.
GateNewsBot47m ago
Dogecoin On-Chain Losses Hit Record High: 1,100 Days of "Profit Days" Warning that DOGE May Enter a Two-Year Bottoming Cycle
February 25 News, Dogecoin (DOGE) is currently in a critical structural and technical range. On-chain research firm AMBCrypto pointed out that its price has entered a rare historical discount level, a characteristic often associated with long-term bottom formation rather than short-term reversal signals. Data shows that the "profit days" indicator has risen to a new high of 1100 days in history, indicating that the vast majority of historical trading days had prices above the current level, and many DOGE holders are still in deep unrealized losses.
This phenomenon typically occurs during the later stages of a market correction cycle, reflecting that there is still significant remaining supply in the market, while long-term holders are numerous. However, structural cycle indicators have not yet released clear bottoming signals. From the perspective of net position changes among holders, during the 2021 and 2024 bull market ends, a large amount of DOGE was sold at cycle tops, while continuous buying in the $0.095 to $0.34 range significantly increased the overall holding costs.
GateNewsBot58m ago
SOL Under Pressure: Is a Short Squeeze Brewing in Solana?
Short Squeeze Potential: Extreme short positions could trigger a sudden upward move in SOL.
Key Levels: Resistance lies at $90–$100, while support holds near $75–$78.
Network Signals: Rising wallet creation suggests accumulation despite price weakness.
Solana’s SOL has been navigating
CryptoNewsLand1h ago