XRP Today's News: Japan's Early General Election Accelerates Selling, Trump's Tariffs Trigger ETF Capital Outflows
XRP declines for 7 consecutive days to $1.8872, Trump’s 10% tariff threat triggers ETF outflows of $53.32 million (second net outflow). Japan’s early general election on February 8 causes Japanese bond yields to soar. Breaking below the double moving averages, $1.85 becomes a key support level. The vote on the “Market Structure Bill” on January 27 may mark a turning point.
Trump’s 10% Tariff Threat Sparks ETF Capital Flight
U.S. President Trump threatens to impose a 10% tariff on eight NATO European member countries, boosting demand for safe-haven assets. Trump announced this 10% tariff policy on January 17, raising concerns about a potential full-scale trade war between the U.S. and Europe. Risk aversion has led XRP spot ETF markets to experience capital outflows for the second time since their launch in November.
On January 20, the U.S. XRP spot ETF reported a net outflow of $53.32 million, with a total net inflow of $1.22 billion since launch. Grayscale XRP ETF (GXRP) experienced a net outflow of $55.39 million. Notably, this is the second net outflow in the U.S. XRP spot ETF market since XRPC launched on November 14. The Tuesday outflows reflect investor concerns over Trump’s determination to acquire Greenland and Japan’s early general election.
XRP and the entire cryptocurrency market remain highly sensitive to global trade dynamics. XRP experienced a flash crash in October, dropping from $2.8406 to $0.7773, then rebounded, ultimately closing at $2.3756, a 15.29% decline. Trump’s threat to impose 100% tariffs on China triggered this sell-off. The memory of that flash crash remains vivid; when investors see Trump waving the tariff stick again, they immediately retreat to avoid risks.
On January 21, President Trump will deliver a speech at the World Economic Forum in Davos. If Trump intensifies tariff threats, XRP will face greater selling pressure. Conversely, if the U.S. president softens tariff rhetoric, XRP may recover. The Cobesi Communications shared a Q&A with the White House, where asked about the cost of purchasing Greenland, Trump replied: “You’ll find out.” This ambiguous statement adds to market uncertainty.
Japanese Bond Yields Surge, Worsening Global Liquidity Concerns
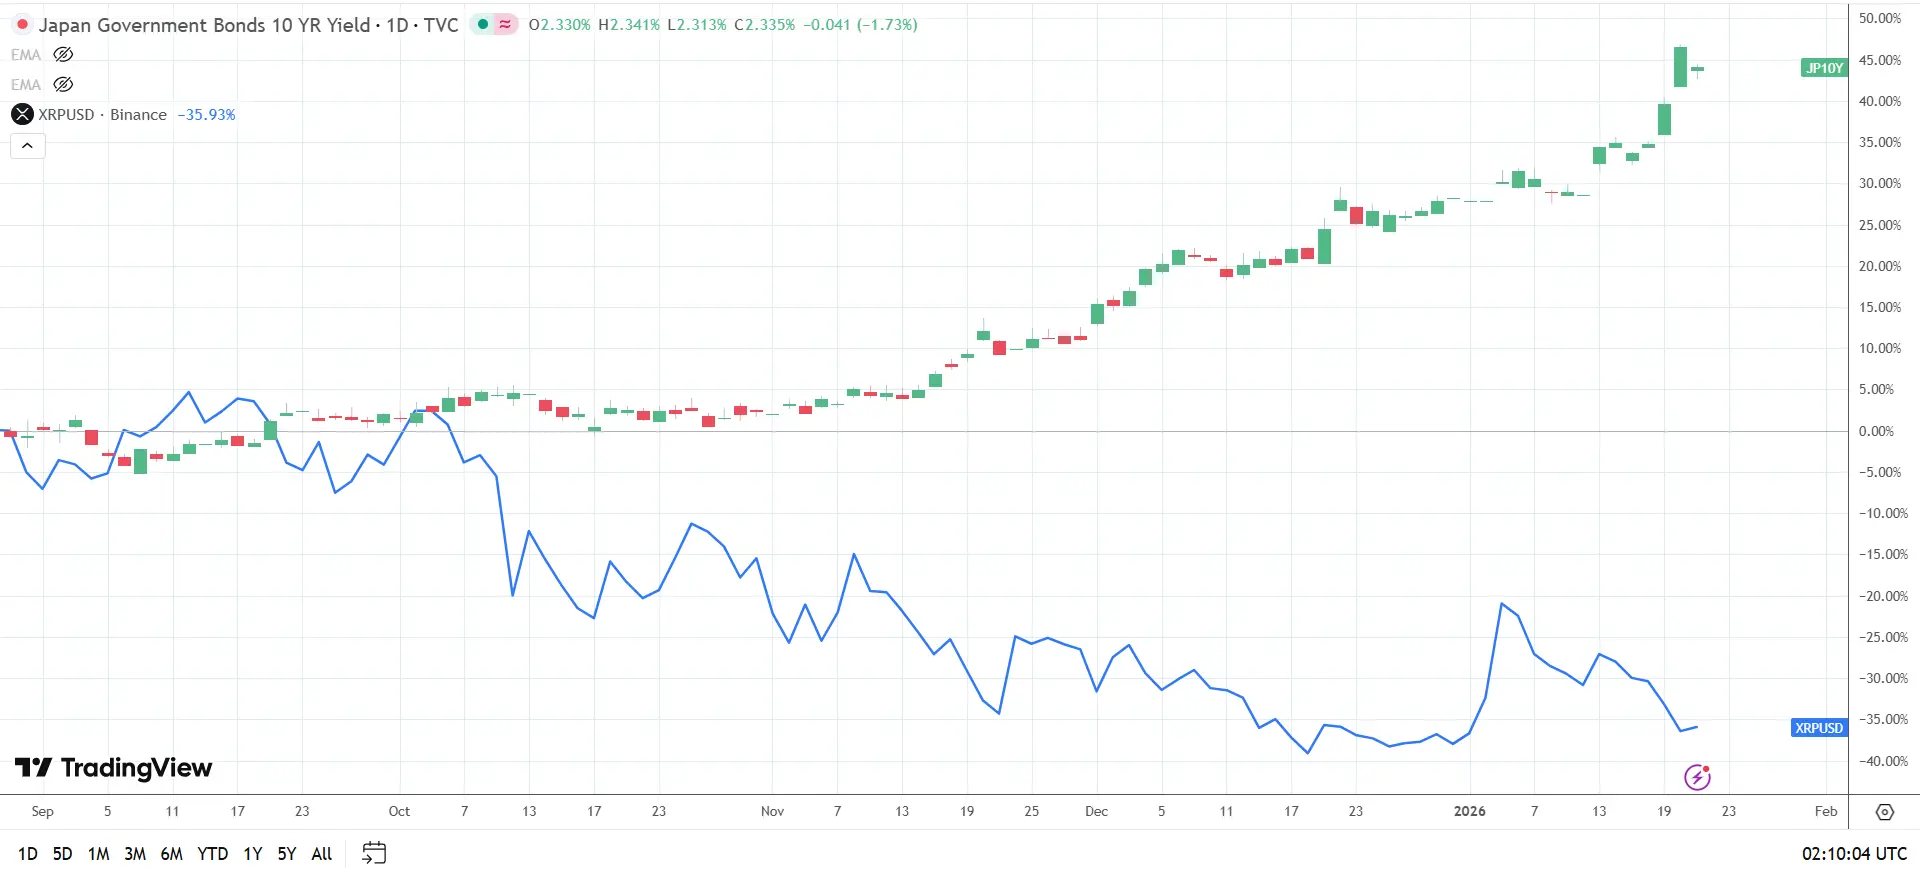
(Source: Trading View)
Meanwhile, Japanese government bond yields soared, intensifying risk aversion as markets reacted to Prime Minister Sanna Marin’s announcement of an early election. This week, Prime Minister Sanna announced the election will be held on February 8. She hopes to leverage strong support in polls. If she secures an absolute majority, she can implement her fiscal policy goals.
The correlation between XRP and the 10-year Japanese government bond yield highlights market sensitivity to rising yields. Rising Japanese bond yields could lead to a global liquidity crunch, as the attractiveness of government bonds increases, impacting demand for risk assets. Concerns over Prime Minister Sanna’s fiscal spending plans and Japan’s debt-to-GDP ratio reaching 240% have caused a significant rise in risk premiums on Japanese bonds.
Notably, after reports of stalled progress on the Capitol Hill Market Structure Bill, the negative correlation between XRP and the 10-year Japanese bond yield re-established. This means that when bond yields rise, XRP prices tend to fall, and vice versa. This correlation reflects the impact of the global liquidity environment on risk asset pricing. As borrowing costs in Japan, the world’s third-largest economy, increase, global liquidity tightens, hitting high-risk assets like cryptocurrencies hardest.
Major Downside Risks Facing XRP
· Trump’s escalation of tariff threats, attempting to acquire Greenland
· Bank of Japan’s hawkish-neutral rate policy (1.5%-2.5%), potentially triggering yen arbitrage unwinding
· U.S. economic data reducing expectations of rate cuts in early 2026
· U.S. lawmakers delaying crypto legislation through the Market Structure Bill
· Continued capital outflows from XRP spot ETF reports
These events will pressure risk assets, causing XRP to break below $1.85, signaling a bearish trend reversal.
Technical Analysis and Key Vote on January 27
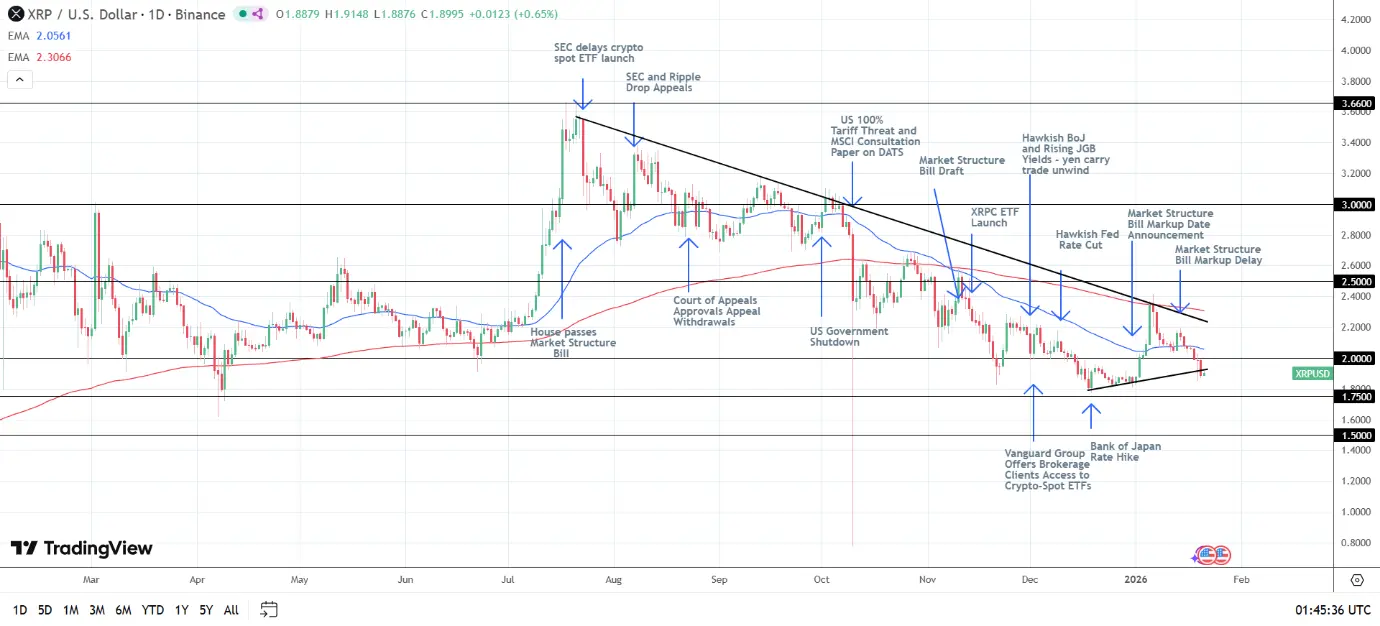
(Source: Trading View)
On January 20, XRP fell 4.86%, after a 0.39% decline the previous day, closing at $1.8872. The token’s movement aligns with the overall crypto market cap, which declined 4.67%. XRP has fallen for seven consecutive days, breaking below the 50-day and 200-day moving averages, indicating a bearish trend. However, bullish fundamentals continue to offset technical disadvantages, keeping XRP above key support levels.
Key Technical Levels to Watch
Support levels: $1.85, $1.75, $1.50
50-day moving average resistance: $2.0561
200-day moving average resistance: $2.3066
Upper resistance levels: $2.0, $2.5, $3.0, $3.66
From the daily chart, a break above $2.0 would target the 50-day moving average. If prices continue to break through the 50-day MA, it could signal a short-term trend reversal to the upside. Importantly, if prices sustain above EMA lines, the medium- and long-term bullish targets remain: $3.0 in 4-8 weeks, and $3.66 in 8-12 weeks.
However, the short- to medium-term outlook depends critically on XRP maintaining above $1.85. Avoiding a fall below $1.85 is key to maintaining the bullish structure. If prices continue to break downward trendlines and fall below $1.85, the bullish setup will invalidate, indicating a trend reversal to the downside.
Traders should closely monitor the USDA’s release of the Market Structure Bill draft on January 23 and the scheduled vote on January 27. Passage of the Bill by the U.S. Senate would reinforce the long-term target of $3.66. Additionally, speeches by Trump in Davos, central bank comments, and capital flows in XRP spot ETF will influence the near-term price outlook.
Related Articles
SBI Japan Launches ¥10B On-Chain Bond With XRP Rewards
Technical Analysis for February 21: BTC, ETH, XRP, BNB, SOL, DOGE, BCH, ADA, HYPE, XMR