These 3 token AIs are showing their strength as the market weakens.
AI Token (AI) has collectively adjusted along with Bitcoin (BTC) and the overall cryptocurrency market for three consecutive days as geopolitical tensions escalate around the US’s intention to acquire Greenland. However, some representatives within the AI group are showing signs of resilience, attempting to establish support zones and aiming for a scenario to retest key resistance levels.
ICP Faces Pressure Around 20-Day and 50-Day EMA
Internet Computer (ICP) is currently struggling to defend a critical support zone, where the 20-day and 50-day exponential moving averages (EMA) converge. Selling pressure increased after the price was strongly rejected at the resistance zone around $4.41 — an area that becomes even more “rigid” when it coincides with the 200-day EMA.
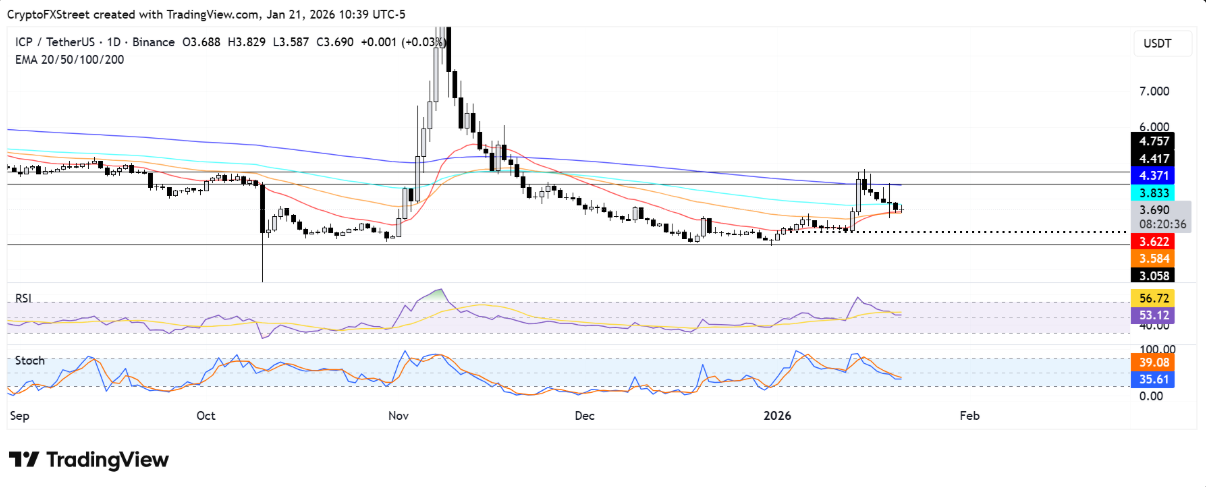
On the other hand, the recovery outlook is only truly supported when ICP maintains a steady upward momentum above the 100-day EMA, opening up the possibility of returning to challenge the $4.41 resistance zone.
In terms of momentum, the RSI indicator is oscillating around the neutral threshold, while the Stochastic Oscillator remains below the midline — signals that the upward momentum is weakening and the market still lacks clear breakout strength.
Bittensor Holds Support at $230, Aiming for Downtrend Resistance
Bittensor (TAO) is striving to defend an important support zone around $230 after the price fell below both the 20-day and 50-day EMAs. Over the past week, this AI token has maintained a clear downtrend, originating from failure to approach the $305 resistance zone — an area coinciding with the 100-day EMA and acting as a “wall” hindering upward movement.
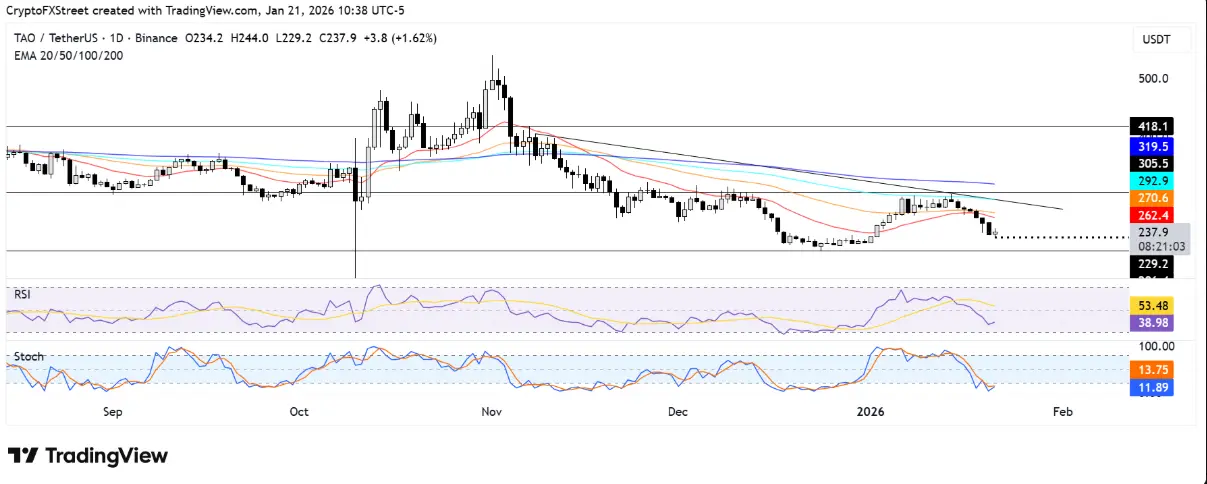 TAO/USDT Daily Chart | Source: TradingViewIn a positive scenario, if TAO maintains the $230 level and quickly recovers the 50-day EMA, the price could open up opportunities to test the downtrend line formed since November 8. Conversely, losing this support zone would increase selling pressure, pushing TAO back to a lower support area around $206.
Regarding technical indicators, RSI is currently below the neutral threshold, reflecting weakening momentum. Meanwhile, the Stochastic Oscillator has entered the oversold zone — a factor that could trigger a short-term technical rebound if buying interest returns.
###Render Bounces at $1.86, Testing 100-Day EMA
Render (RENDER) is in the process of testing the 100-day EMA after bouncing from the support zone at $1.86 — an area that coincides with the 50-day EMA, temporarily halting the previous decline.
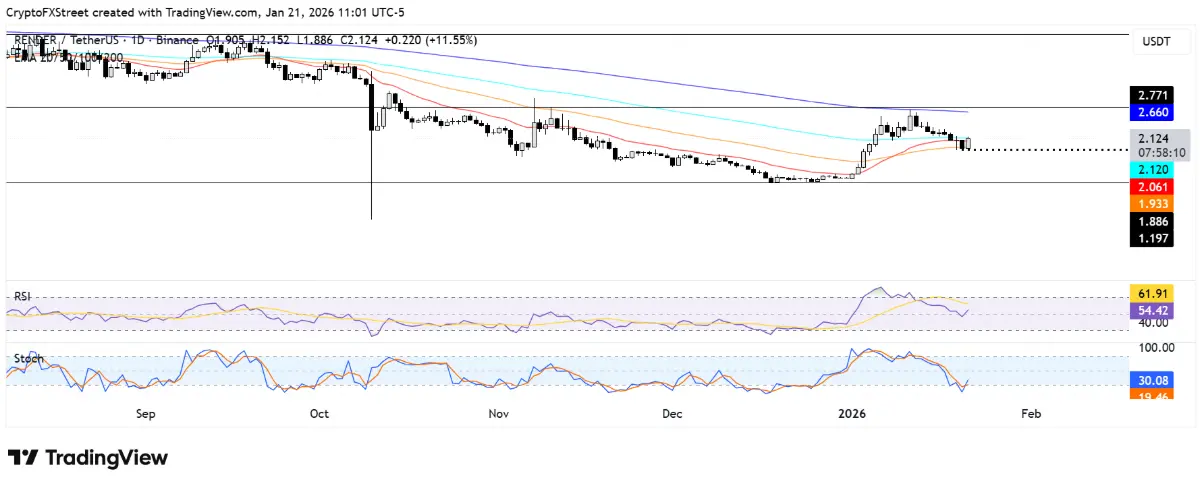 Daily RENDER/USDT Chart | Source: TradingViewIn a positive scenario, if the price can break through and sustain above the 100-day EMA, RENDER is likely to target the resistance zone at $2.77, located just above the 200-day EMA. Conversely, if the $1.86 support level is broken, selling pressure could push the price down to around $1.19.
Regarding momentum, the RSI indicator has recovered from the neutral zone, while the Stochastic Oscillator has exited the oversold region, indicating weakening selling pressure and signs of a slowdown in the downtrend.
Related Articles
XRP Moves Within $1.41–$1.49 Range Amid Mixed Market Performance
Shanghai Silver Squeeze Alert: Physical Prices Hit $95 as Vaults Drain
Here’s the Kaspa (KAS) Price If Big Players Keep Averaging Down