Bitcoin whale accumulation hits a 9-month high! Trump tariffs decline presents a good opportunity for bottom fishing
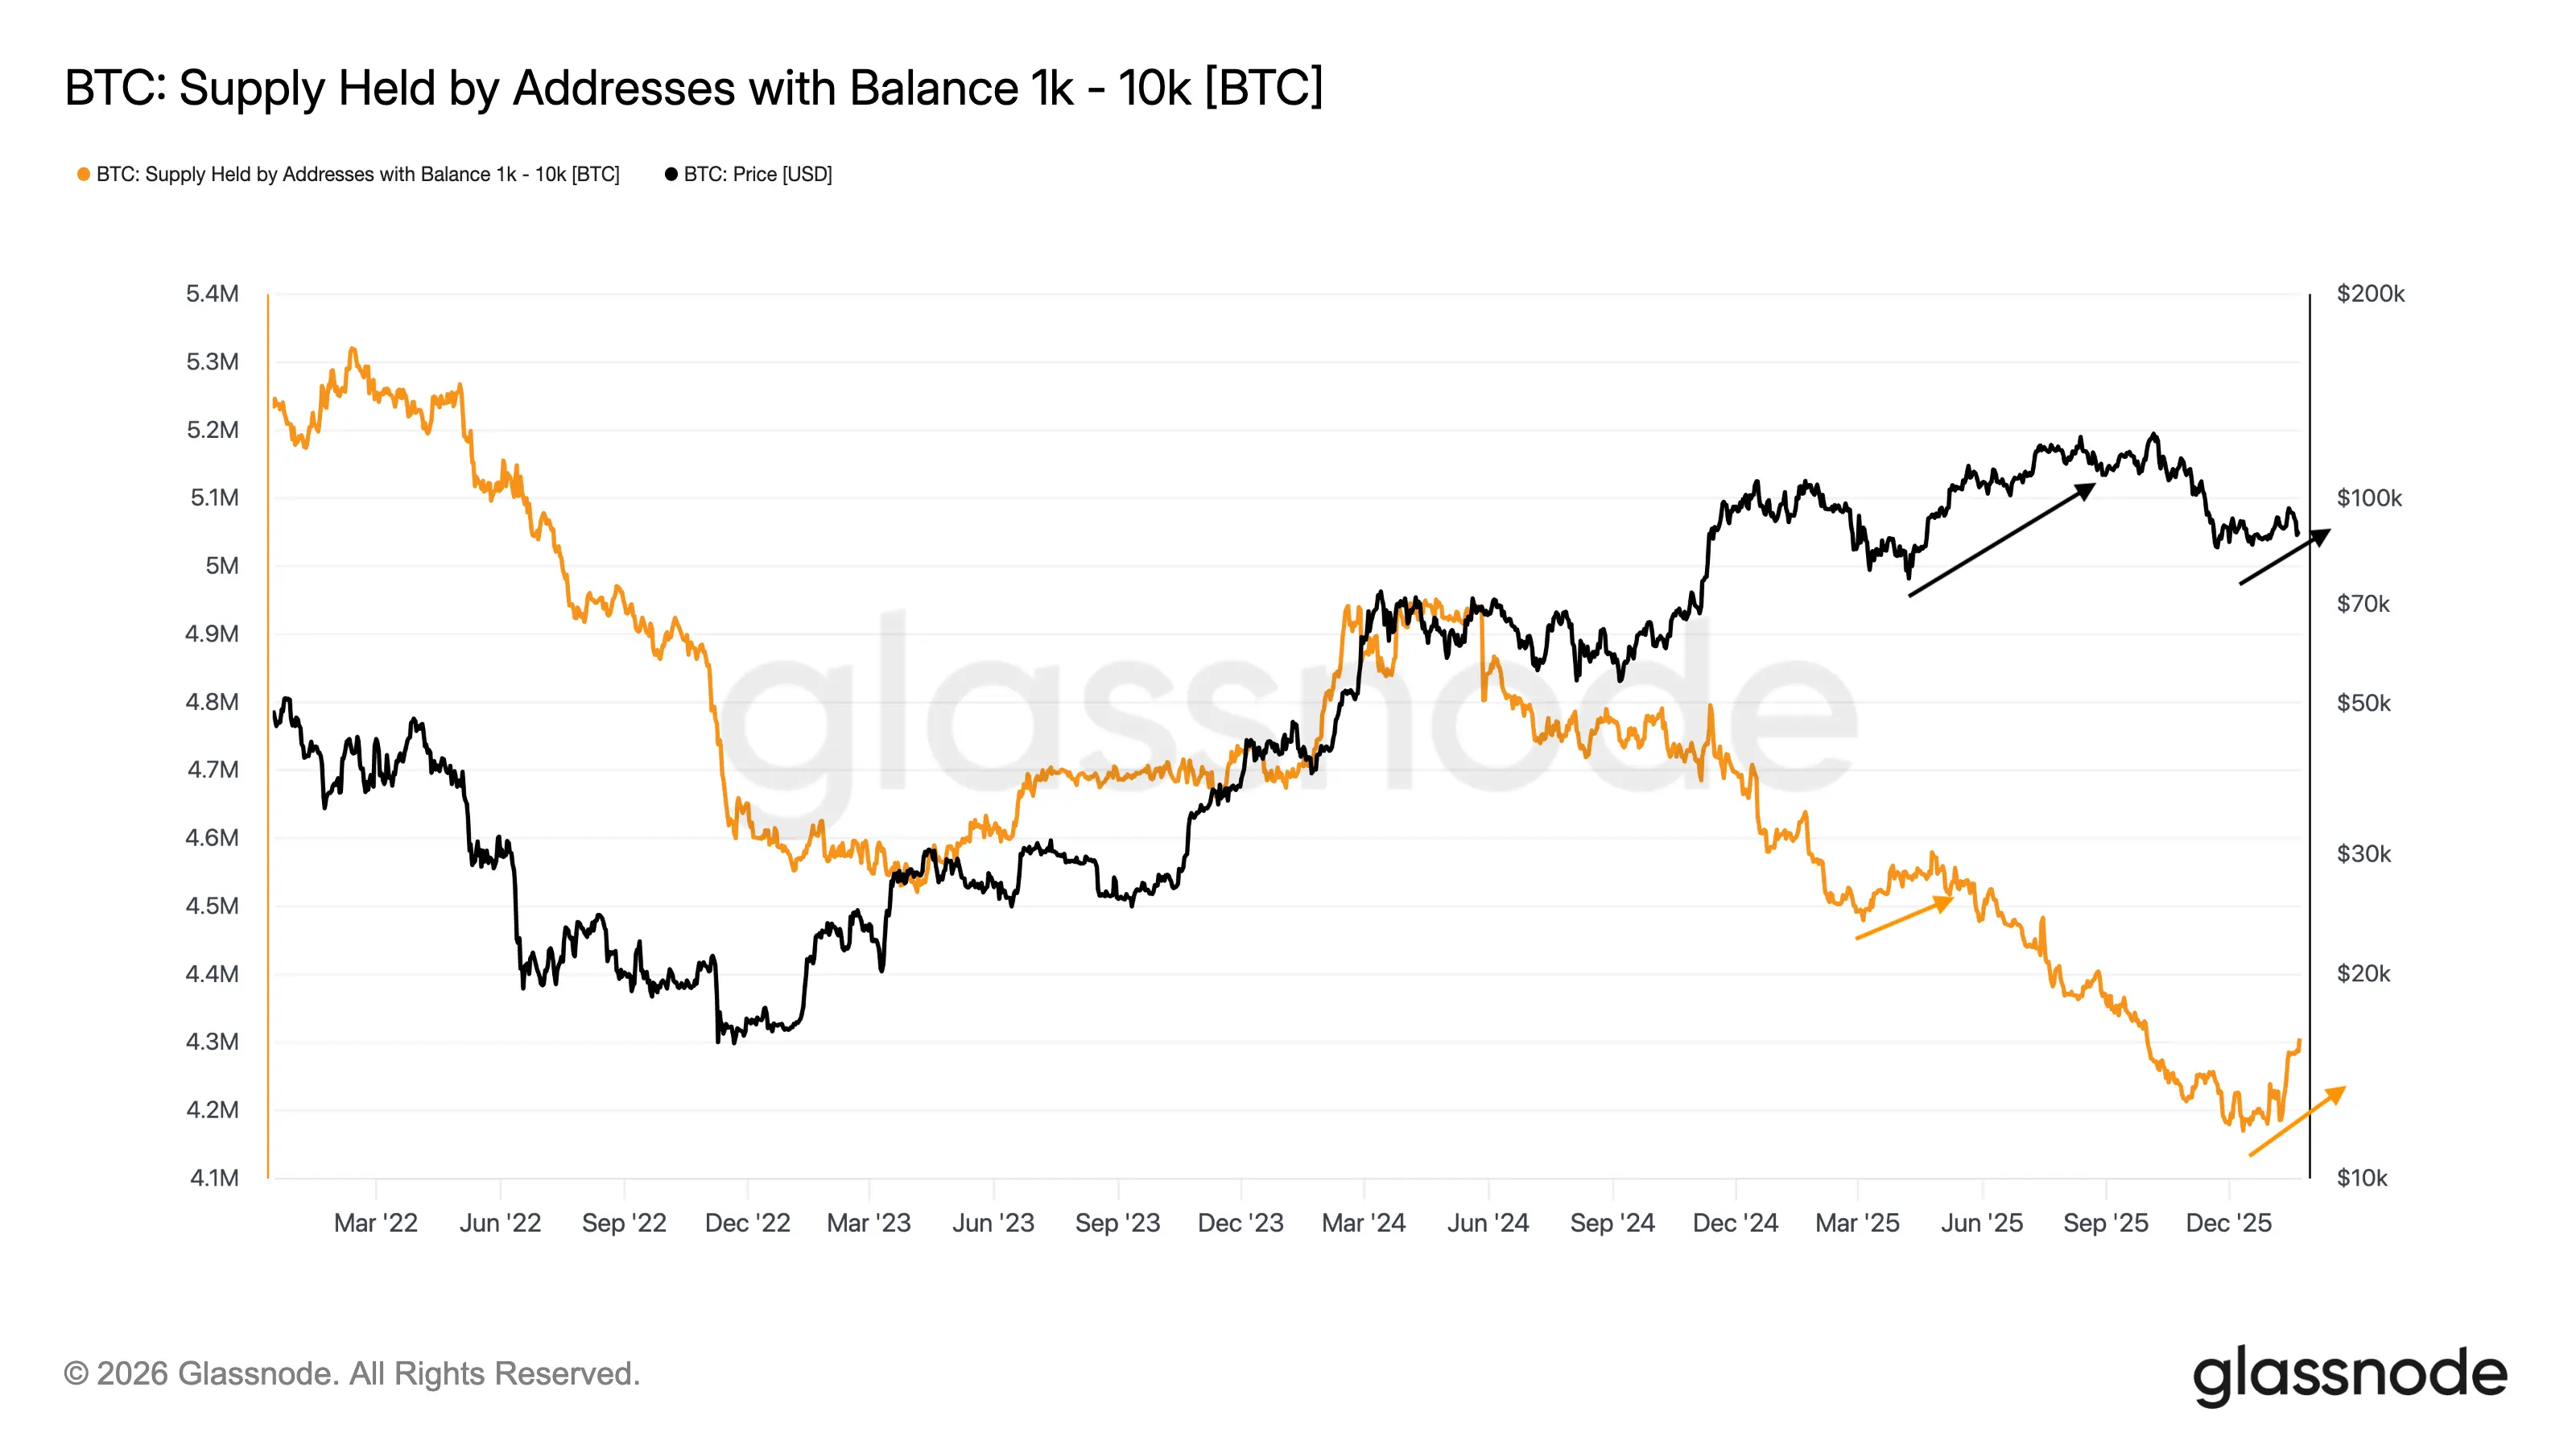
Glassnode shows that the supply of addresses holding 1,000-10,000 bitcoins has been increasing since mid-December, with the growth rate reaching a new high since April 2025. Despite volatility triggered by Trump’s tariffs, whales continue to buy on dips. After similar behavior in March-April, Bitcoin surged 70%, reaching a new high of $126,200. Technical indicators show a rebound from the bull flag’s lower trendline, and the liquidation chart indicates dense leverage at 90,000-100,000, with a short squeeze potentially pushing prices to 100,000.
The historical significance of whales’ accumulation speed reaching a 9-month high
(Source: Glassnode)
According to data from Glassnode, the supply held by addresses with 1,000 to 10,000 bitcoins has been rising since mid-December. Even amid market volatility caused by U.S. President Trump’s tariff policies, which led to a pullback from recent highs, this growth trend continued into January. This divergence suggests that large holders view the recent decline influenced by news as an accumulation opportunity, increasing their holdings during heightened risk aversion rather than reducing them.
This address range represents typical “whale” holdings. Holding 1,000 to 10,000 bitcoins implies an asset value between $100 million and $1 billion, a scale usually associated with institutional investors, family offices, or ultra-high-net-worth individuals. These participants have deep market understanding and professional analysis teams, often exhibiting more forward-looking behavior than retail investors.
Over approximately one month since mid-December, these whales have continued to accumulate Bitcoin, despite multiple negative macroeconomic factors such as Trump’s tariff threats and economic uncertainty. This “counter-trend accumulation” behavior indicates that whales believe current prices are attractive and that the long-term upward trend remains intact. More importantly, this accumulation speed has reached a new high since April 2025, signaling increased confidence and capital deployment by whales.
Historical experience from March-April 2025 offers valuable reference for the current situation. At that time, the same group of whales increased their Bitcoin holdings at a similar pace, while Bitcoin’s price weakened due to Trump’s tariff threats. However, as market pressure eased, Bitcoin stabilized and surged about 70%, reaching a new high of approximately $126,200. This further confirms that whales viewed the decline as a good opportunity to accumulate funds.
History does not repeat exactly, but it often rhymes. The current whale behavior closely resembles the pattern from March-April: same address range, same accumulation speed, same macro background (Trump’s tariff threats). If history repeats, Bitcoin could see a similar 70% rally in the coming weeks to months, pushing the price beyond $150,000, well above the current psychological level of $100,000.
Bull flag’s lower trendline again provides perfect support
(Source: Trading View)
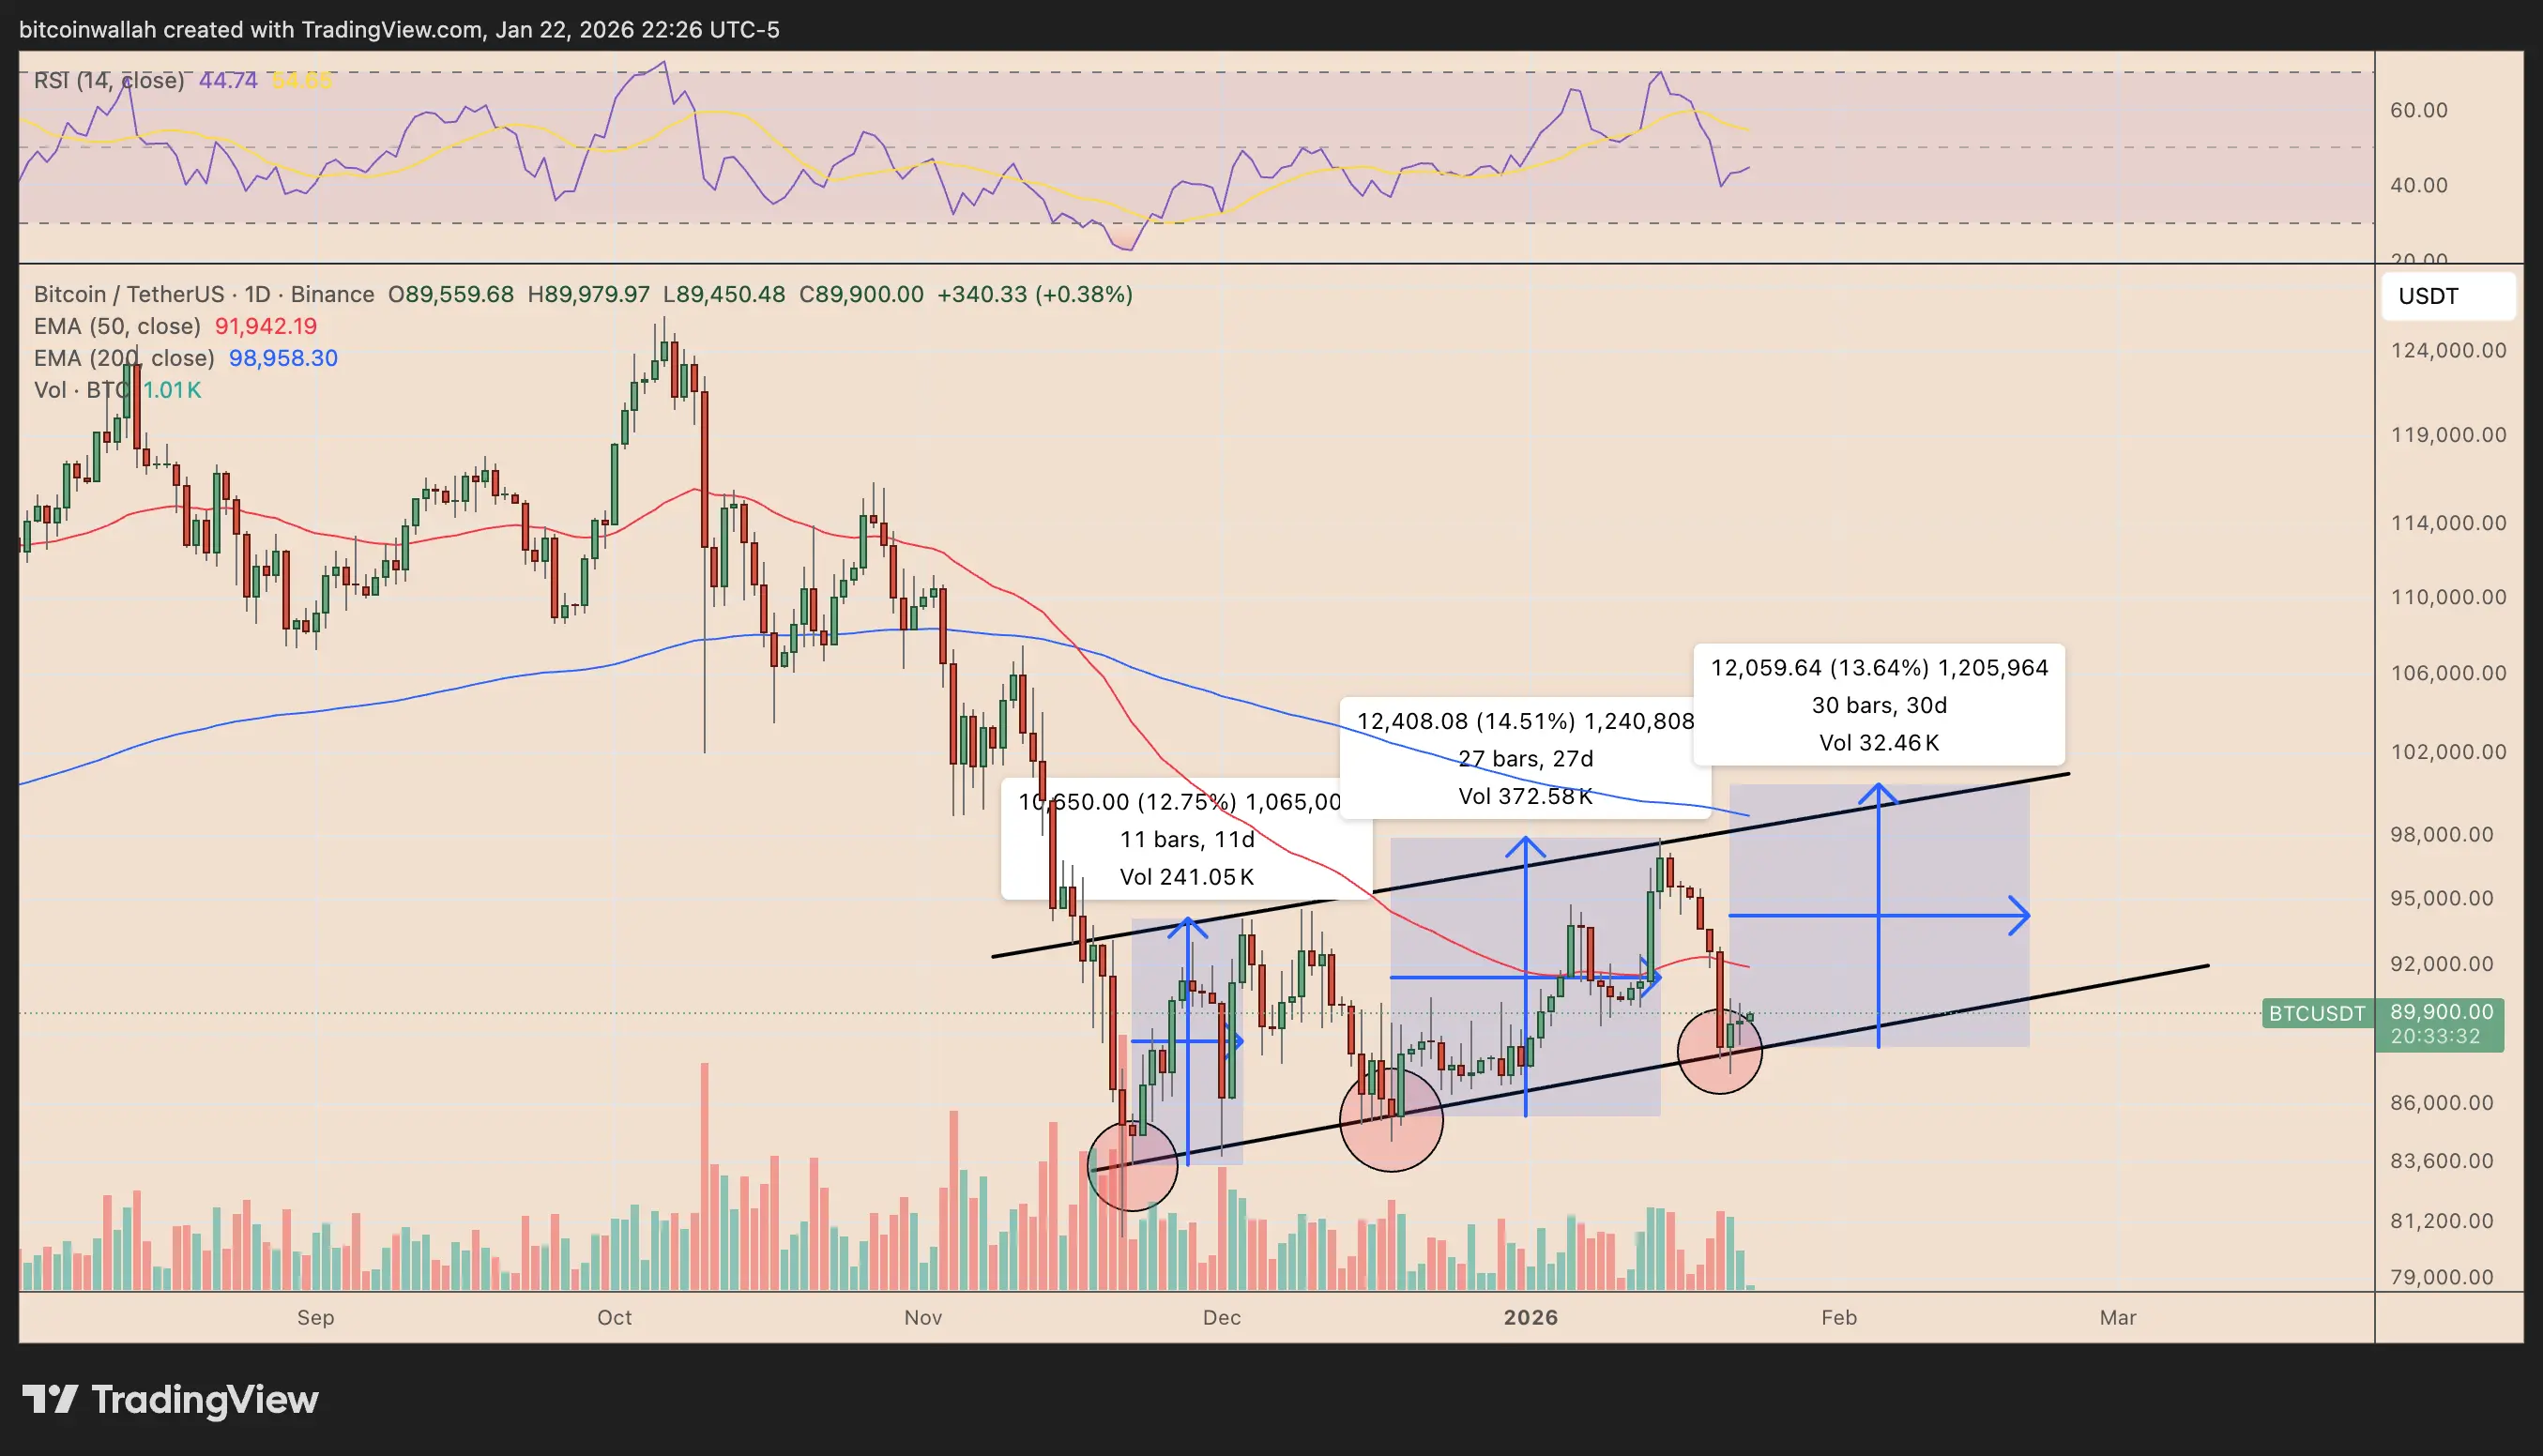
Bitcoin has rebounded again from the lower trendline of the bull flag pattern, which has served as support since late November. Each time the price touched this upward support zone, it quickly bounced within the flag pattern, rising about 12%-15% over 2 to 4 weeks, before encountering resistance near the upper boundary.
The bull flag is a classic bullish continuation pattern in technical analysis. It typically appears after a strong rally, consisting of a steep flagpole (representing prior rapid ascent) and a downward-sloping parallel channel (representing consolidation). Since breaking to new highs in November, Bitcoin has been trading within this bull flag, repeatedly bouncing off the lower trendline, demonstrating the pattern’s high validity.
The latest rebound follows the same script: Bitcoin has held the downward trendline and is attempting to regain key moving average resistance levels, including the 50-day moving average. If this pattern continues, the next rally could push Bitcoin back to the top of the flag, in the $98,000 to $100,000 range. A clean breakout above this zone could lead to a move beyond $100,000.
From a volume perspective, previous rebounds from the lower trendline were accompanied by increased trading volume, indicating active buying near support levels. If the current rebound also sees volume growth, it will strengthen the breakout case. Conversely, if volume diminishes, it may only be a technical bounce, with a potential retest of support afterward.
The time cycle of the flag pattern is also noteworthy. Since late November, it has been running for about two months, which is sufficient for digesting prior gains and building new upward momentum. Technical analysis suggests that longer consolidation periods often lead to larger breakouts. If Bitcoin can break above the upper trendline in the coming weeks, it could trigger a new acceleration phase.
Liquidation heatmap reveals $100,000 magnet zone
(Source: Coinglass)
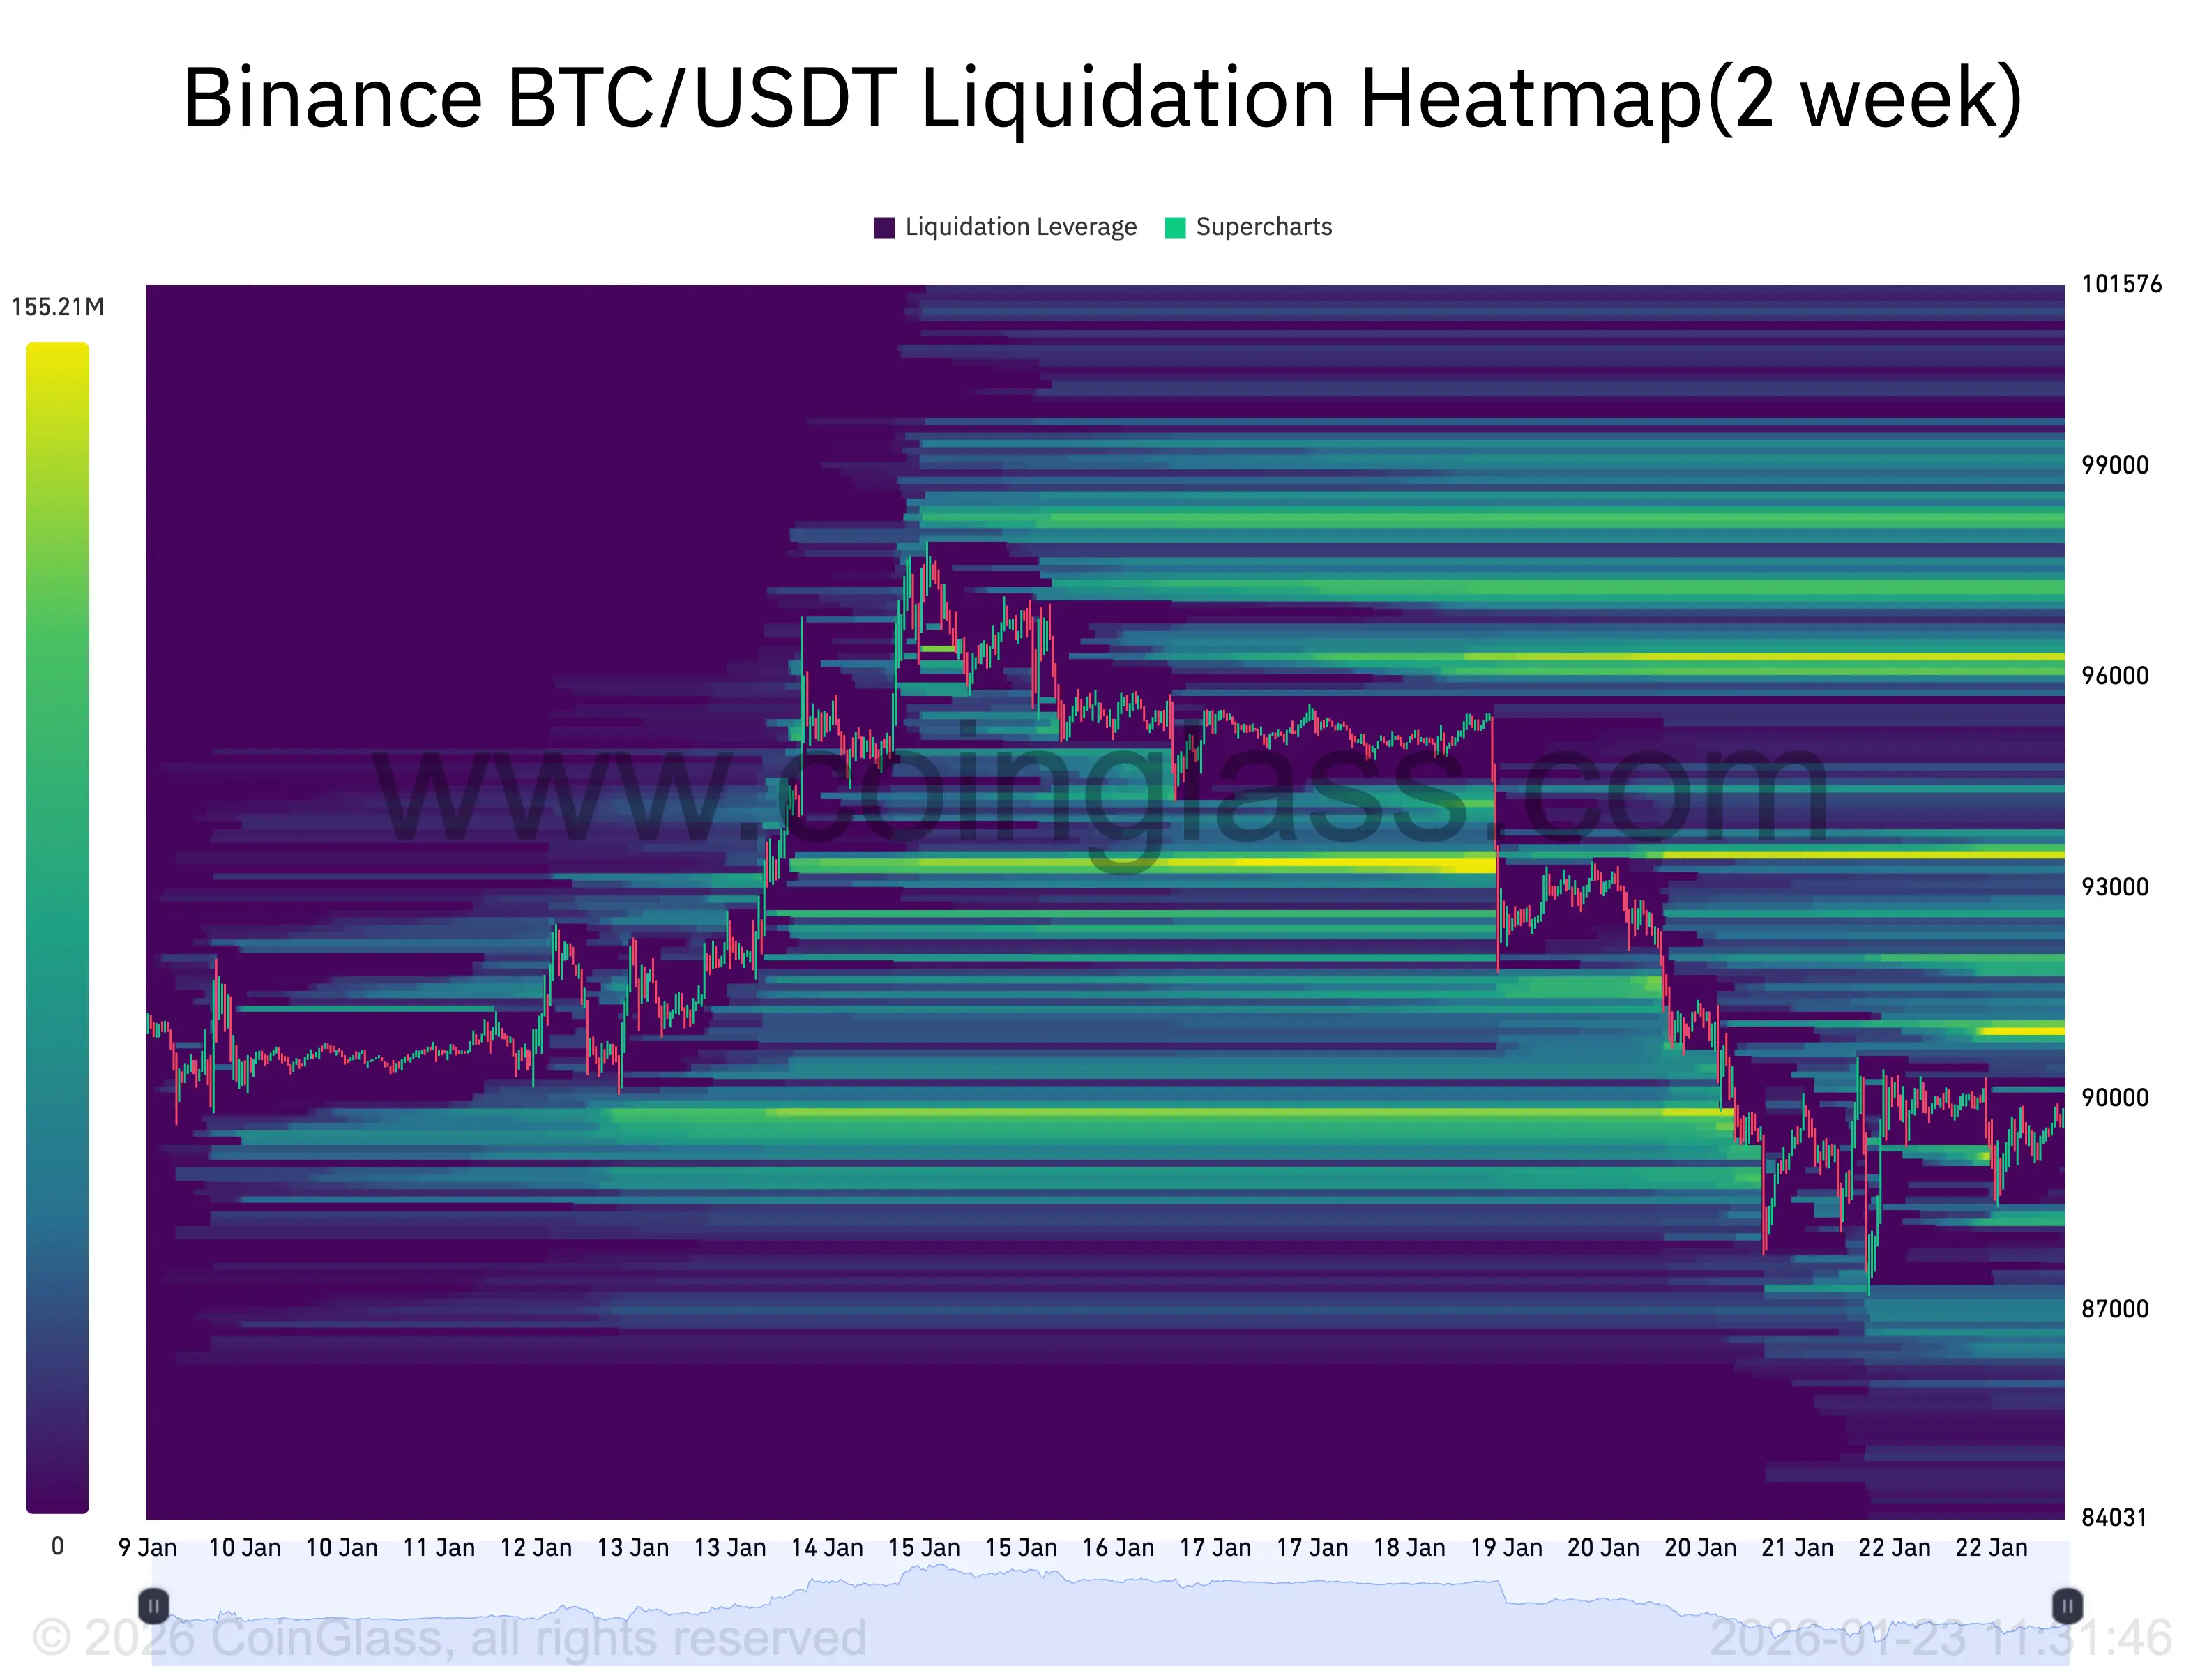
The Bitcoin liquidation heatmap still supports the $100,000 target, as the most concentrated leverage positions are above the current price, starting from the $90,000 to $93,000 range, stacking upward to $96,000 to $99,000, ultimately reaching around $100,000. These liquidity clusters act like magnetic zones: when the price approaches these areas, forced liquidations and stop-loss orders can accelerate the price movement, pulling Bitcoin into the next liquidity zone.
Liquidation heatmaps are vital tools for derivatives market analysis. They show how much leverage positions are at risk of liquidation at different price levels. When the price moves upward and triggers short liquidations, these forced closures (buying Bitcoin) can further push prices higher, creating a self-reinforcing rally.
In this scenario, a clean reclaim of $90,000 increases the likelihood of a chain reaction of “short squeezes,” as this squeeze can cascade through the clusters above, making the $100,000 target a natural liquidity destination. This mechanism explains why Bitcoin often accelerates upward upon breaking key resistance levels, as the chain liquidation reaction generates additional buying momentum.
From the current price of about $95,000 to $100,000, there is only about 5% upside, but the dense leverage positions within this zone suggest the breakout could be very rapid and intense. Traders should closely monitor the $90,000 reclaim; if the price can hold this level and volume increases, chain liquidations could push Bitcoin to $100,000 within hours to days.