
Key Takeaways
-
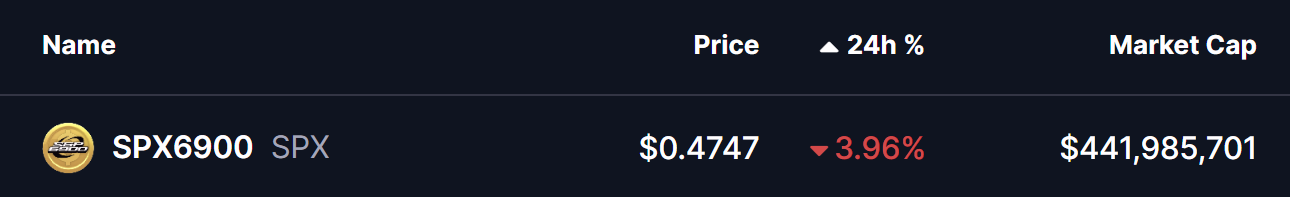
SPX6900 (SPX) has dropped over 4% amid broader crypto market weakness and rising liquidation pressure.
-
The daily chart shows SPX trading inside a descending triangle pattern, with price compressing toward a critical support zone.
-
Buyers continue to defend the $0.44–$0.4775 demand area, preventing a confirmed bearish breakdown so far.
-
A rebound from current levels could push SPX toward the descending resistance near $0.61.
-
A decisive breakdown below $0.44 would invalidate the support and expose SPX to further downside.
The broader cryptocurrency market is in slight under pressure on January 20, with risk sentiment turning cautious once again. Bitcoin (BTC) and Ethereum (ETH) are both trading lower, down 1.69% and 2.45% respectively over the past 24 hours. This sharp move triggered more than $286 million in liquidations, with long positions absorbing the bulk of the damage.
As volatility spreads across the market, memecoins have also felt the heat. SPX6900 (SPX) has dropped near 4%, sliding back toward a technically important area on the daily chart. However, while price action looks weak on the surface, the chart suggests SPX may be approaching a make-or-break zone that could define its next major move.
Source: Coinmarketcap
Descending Triangle Takes Shape on the Daily Chart
From a technical perspective, SPX is trading within a large descending triangle pattern on the daily timeframe. This formation is defined by a series of lower highs pressing against a relatively flat support zone — a structure that often reflects growing selling pressure.
Descending triangles are typically considered bearish, but context matters. When price repeatedly tests a strong base without breaking down, it can also signal accumulation rather than distribution.
In SPX’s case, price has once again dipped into the key demand zone between $0.44 and $0.4775. This area has acted as a reliable support throughout recent months, consistently attracting buyers whenever price revisits it. Each test of this zone has produced long lower wicks, highlighting aggressive dip-buying and a reluctance from sellers to push price lower.
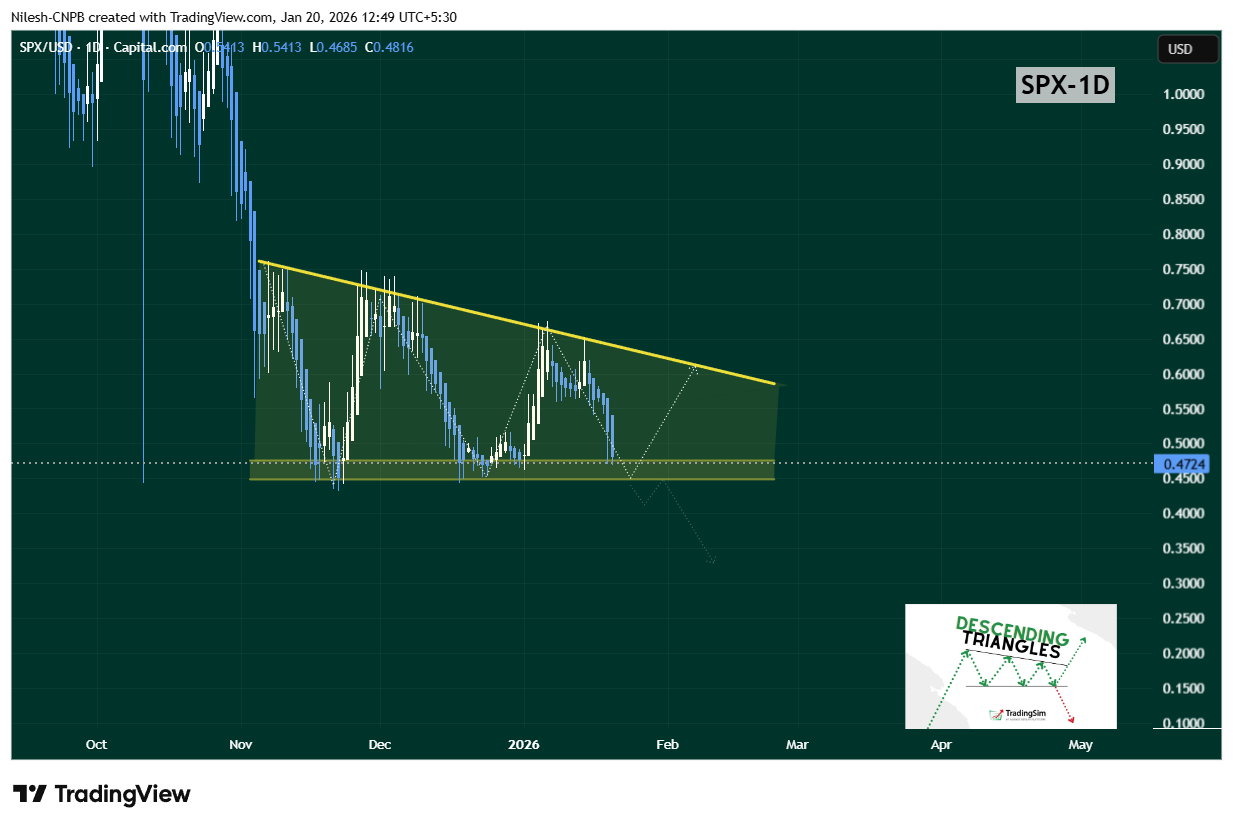
SPX6900 (SPX) Daily Chart/Coinsprobe (Source: Tradingview)
Can Buyers Defend the Base?
As long as SPX holds above the $0.44–$0.4775 support region, the descending triangle remains intact without confirmation of a breakdown. A successful defense here could trigger a relief bounce, potentially sending price back toward the upper trendline resistance near $0.61.
This descending resistance has rejected price multiple times, making it a critical level to watch. A breakout above it would mark a meaningful shift in structure and could signal that buyers are regaining control after weeks of compression.
That said, downside risk cannot be ignored. A decisive daily or weekly close below $0.44 would invalidate the support base and confirm a bearish breakdown from the triangle. Such a move could open the door for a deeper correction as trapped buyers exit positions.
Bottom Line
SPX6900 is currently sitting at a pivotal technical crossroads. While broader market weakness has pushed price lower, the daily chart shows that SPX is testing a well-defined demand zone that has consistently held in the past.
As long as buyers continue to defend the triangle’s base, a rebound toward descending resistance remains a realistic scenario. However, a failure to hold support would shift momentum firmly back in favor of sellers.
Disclaimer: The views and analysis presented in this article are for informational purposes only and reflect the author’s perspective, not financial advice. Technical patterns and indicators discussed are subject to market volatility and may or may not yield the anticipated results. Investors are advised to exercise caution, conduct independent research, and make decisions aligned with their individual risk tolerance.
About Author: Nilesh Hembade is the Founder and Lead Author of Coinsprobe, with over 5 years of experience in the cryptocurrency and blockchain industry. Since launching Coinsprobe in 2023, he has been providing daily, research-driven insights through in-depth market analysis, on-chain data, and technical research.
Disclaimer: The information on this page may come from third parties and does not represent the views or opinions of Gate. The content displayed on this page is for reference only and does not constitute any financial, investment, or legal advice. Gate does not guarantee the accuracy or completeness of the information and shall not be liable for any losses arising from the use of this information. Virtual asset investments carry high risks and are subject to significant price volatility. You may lose all of your invested principal. Please fully understand the relevant risks and make prudent decisions based on your own financial situation and risk tolerance. For details, please refer to
Disclaimer.
Related Articles
Michael Saylor: Bitcoin’s winter is over; institutional and sovereign adoption could fuel the next uptrend
Gate News message, April 25 — Michael Saylor, co-founder of MicroStrategy, said "winter's over" as Bitcoin climbed to approximately $78,000, signaling a shift in market sentiment.
According to analyst Mati Greenspan, recent market moves since the flash crash have been corrections within a broader bull market, with Bitcoin's bottom now in place. Greenspan believes the next leg of gains will be driven by "sovereign adoption," including central banks adding BTC alongside gold to their reserves.
Governments and institutions are increasingly incorporating Bitcoin into their holdings. The U.S. government currently holds approximately 300,000 BTC and has discussed establishing a strategic Bitcoin reserve. El Salvador continues making daily purchases, while the U.K. government and several U.S. state pension funds have added Bitcoin to their asset allocations.
GateNews1h ago
SHIB Reserves Hit 61.8T Amid Mixed Signals of Selling Pressure and Accumulation
Gate News message, April 25 — Shiba Inu's on-chain metrics reveal diverging market forces as a major CEX's SHIB reserves climbed to 61.8 trillion tokens, while simultaneously around 86 billion SHIB moved out of exchanges. Data from CryptoQuant shows the reserve increase began around mid-March and
GateNews2h ago
SHIB Nears Breakout Point After Revisiting Powerful Support Level
SHIB revisits a key support zone that previously triggered major price rallies.
Price compression and accumulation signals suggest a potential breakout ahead.
Analysts project strong upside, though market conditions may limit extreme gains.
Shiba Inu has returned to a price level that on
CryptoNewsLand5h ago
PEPE Price Outlook: The Case for a Surprise ‘Disbelief Rally’ Ahead
PEPE shows weak sentiment with falling price, volume, and Open Interest.
Heavy short bias may trigger a surprise rally through liquidation clusters.
Range-bound price suggests a possible trap before continuation of bearish trend.
PepeCoin — PEPE, has taken another hit, and sentiment
CryptoNewsLand6h ago
Crypto Fear and Greed Index Drops to 30, Signals Panic State
Gate News message, April 25 — The Crypto Fear and Greed Index currently stands at 30, down 8 points from yesterday, according to Coinglass data. The seven-day average is 33, while the 30-day average is 18, indicating a shift toward panic sentiment in the
GateNews7h ago
Not Too Late Yet: Altcoins Eye Rapid Move Ahead of Economic Uncertainty — 5 Picks Investors Are Watching
Market rotation is splitting attention between meme coins and infrastructure-driven blockchain projects.
TAO and FIL reflect stronger alignment with emerging tech and data infrastructure narratives.
DOGE and SHIB remain primarily driven by retail sentiment and short-term volatility
CryptoNewsLand10h ago