
Key Takeaways
-
ZEC is holding a major support zone between $300–$335 after a 30% monthly correction.
-
A descending triangle pattern is forming on the daily chart.
-
A breakout above $411 could signal the start of a renewed bullish move.
Zcash (ZEC) is showing early signs of stabilization after a sharp corrective phase. As of January 26, 2026, ZEC is trading near the $360 level, posting a 4% gain over the past 24 hours. This bounce comes after a steep 30% decline over the last month, which followed ZEC’s explosive 2025 rally, where the privacy-focused cryptocurrency surged more than 800% at its peak, reaching levels near $750.
While broader market conditions remain volatile, ZEC’s latest price action suggests that the asset may be approaching a decisive moment — one that could determine whether bulls regain control or bears extend the correction.
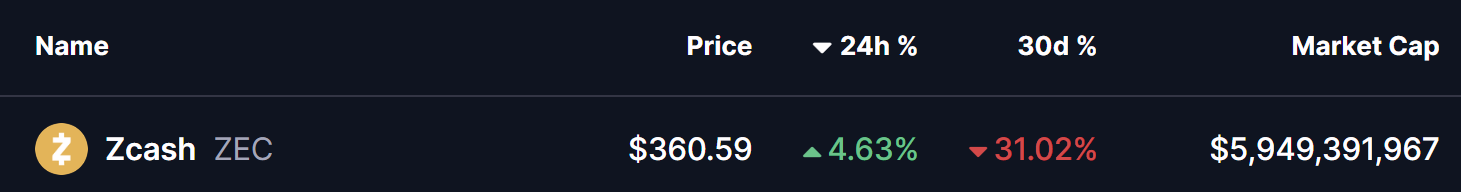
Source: Coinmarketcap
Descending Triangle Takes Shape on the Daily Chart
From a technical perspective, Zcash’s daily chart reveals a well-defined descending triangle pattern, a structure that typically forms after a strong uptrend and often precedes a major directional move.
This pattern is characterized by two key elements:
-
A horizontal support zone between $300 and $335, which has consistently attracted buyers during recent pullbacks.
-
A sequence of lower highs, creating a downward-sloping resistance line originating from the 2025 peak near $750.
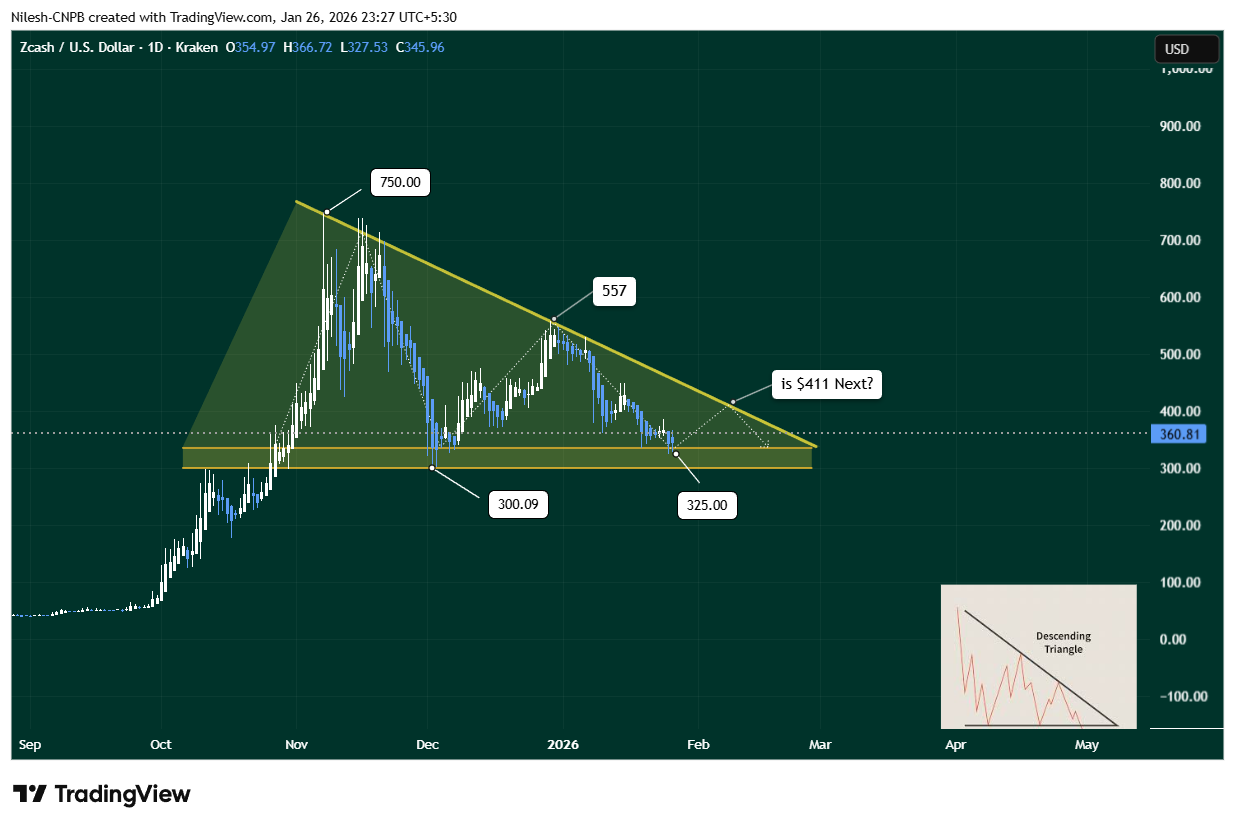
Zcash (ZEC) Daily Chart/Coinsprobe (Source: Tradingview)
During the most recent leg of the correction, ZEC dipped into the lower boundary of this support zone, finding demand near $325. Buyers stepped in aggressively at this level, triggering a rebound that lifted price back toward the $360 area. This reaction suggests that bulls are actively defending the structure and are not yet willing to concede control.
The repeated defense of the $300–$335 region highlights its importance as a critical accumulation zone. As long as ZEC continues to trade above this range, the broader technical structure remains intact.
What’s Next for ZEC?
Looking ahead, If ZEC continues to sustain above the support trendline, the next logical move would be a retest of the descending resistance near $411.
-
Bullish Scenario:
If ZEC holds above support and breaks above the $411 resistance with strong volume, it could invalidate the bearish implications of the descending triangle and mark the beginning of a new bullish expansion phase.
-
Bearish Scenario:
Failure to break resistance — or a loss of the $300–$335 support zone — could send ZEC back into consolidation or trigger another retest of lower demand levels before a clear trend emerges.
Final Outlook
Zcash is currently at a technical inflection point. The combination of strong historical support, a tightening price structure, and an early rebound off key demand levels suggests that a larger move may be approaching. Whether that move resolves higher toward $411 or lower back into support will depend on how price reacts as the descending triangle nears its apex.
For now, $325 support and $411 resistance remain the two most important levels to monitor.
Disclaimer: The views and analysis presented in this article are for informational purposes only and reflect the author’s perspective, not financial advice. Technical patterns and indicators discussed are subject to market volatility and may or may not yield the anticipated results. Investors are advised to exercise caution, conduct independent research, and make decisions aligned with their individual risk tolerance.
About Author: Nilesh Hembade is the Founder and Lead Author of Coinsprobe, with over 5 years of experience in the cryptocurrency and blockchain industry. Since launching Coinsprobe in 2023, he has been providing daily, research-driven insights through in-depth market analysis, on-chain data, and technical research.
Disclaimer: The information on this page may come from third parties and does not represent the views or opinions of Gate. The content displayed on this page is for reference only and does not constitute any financial, investment, or legal advice. Gate does not guarantee the accuracy or completeness of the information and shall not be liable for any losses arising from the use of this information. Virtual asset investments carry high risks and are subject to significant price volatility. You may lose all of your invested principal. Please fully understand the relevant risks and make prudent decisions based on your own financial situation and risk tolerance. For details, please refer to
Disclaimer.
Related Articles
Stablecoins aren’t just for cross-border payments—they’re for going local too! a16z’s latest report: Asia supports two-thirds of transaction volume
Crypto VC giant a16z’s latest report, “9 charts on what stablecoins are becoming,” uses nine key charts to depict the structural changes underway in stablecoins. The report’s central takeaway is not new tokens or new narratives, but stablecoins’ role shifting from “trading tools” and “savings vehicles” to “core financial infrastructure,” along with an increasingly strong degree of localization—creating a clear gap between what the market originally expected and the reality of cross-border payments.
**GENIUS Act in the U.S. boosts stablecoin trading volume to $4.5 trillion in Q4**
For years, regulatory uncertainty has been the ceiling for institutional participation in stablecoins. The turning point came from the U.S. GENIUS Act establishing the first federal-level stablecoin issuance framework. a16z data shows that, prior to the bill’s passage, the adjusted stablecoin trading volume had already been rising for several consecutive quarters.
ChainNewsAbmedia8m ago
Humanity Protocol Rallies 80% From April Lows, But Is the Momentum Fading?
Humanity Protocol surged 80% from April lows, breaking into top 100 crypto assets.
Whale activity and network growth rose, but trading volume dropped sharply by 46%.
Bullish structure remains intact, with key resistance and support levels defining the next move.
Humanity Protocol — H, ha
CryptoNewsLand1h ago
PENGU Eyes 30% Rally as Analyst Flags Crucial Breakout Level
PENGU consolidates near $0.009 resistance after a long 90% decline from highs.
Analysts expect a 30% rally if breakout above key resistance level confirms strength.
ETF speculation and ecosystem growth could fuel volatility and upside momentum.
Pudgy Penguins — PENGU, is sitting at a
CryptoNewsLand3h ago
Analyst: $80K Emerges as Bitcoin's Key Resistance Level, Breakout Could Trigger Increased Volatility
Gate News message, April 26 — On-chain analyst Murphy identified $80,000 as Bitcoin's primary resistance level above the current price, citing a combination of options Gamma exposure, open interest (OI), and implied volatility (IV) data. The level represents a critical checkpoint for May's price
GateNews4h ago
Crypto Fear and Greed Index Falls to 32, Indicating Panic State
Gate News message, April 26 — The Crypto Fear and Greed Index currently stands at 32, up 2 points from the previous day, according to Coinglass data. The index is in a panic state.
The seven-day average is 34, while the 30-day average is 19, indicating elevated market anxiety over the past
GateNews4h ago
PLA Plummets 47.8% in 30 Minutes, Dropping Below $0.12
Gate News message, April 26 — PLA (PlayDapp) price crashed 47.8% in just 30 minutes today, falling to $0.1225. The token, which hit a day high of $0.2347, now trades at $0.122512 with a market cap of approximately $305 million. Trading volume remains notably low, reflecting reduced investor
GateNews5h ago