![]() Trusted Editorial content, reviewed by leading industry experts and seasoned editors. Ad Disclosure
Bitcoin and Ethereum spot ETFs have continued to observe weak demand as their monthly average netflows have remained in the red.
Trusted Editorial content, reviewed by leading industry experts and seasoned editors. Ad Disclosure
Bitcoin and Ethereum spot ETFs have continued to observe weak demand as their monthly average netflows have remained in the red.
Bitcoin & Ethereum Spot ETFs Have Been Observing Net Outflows
As pointed out by on-chain analytics firm Glassnode in a new post on X, the average netflow for both Bitcoin and Ethereum spot exchange-traded funds (ETFs) has remained negative recently. Spot ETFs are investment vehicles that allow investors to gain indirect exposure to an underlying asset. In the case of cryptocurrencies, this means that traders never have to interact with blockchain infrastructure themselves. Instead, the fund buys and custodies tokens on its behalf.
Related Reading: Strategy Extends Bitcoin Accumulation With New 2,932 BTC PurchaseETFs and similar investment vehicles for digital assets are available in various parts of the world, but currently, the most dominant funds are those based in the United States. The US Securities and Exchange Commission (SEC) first approved spot ETFs for Bitcoin in January 2024 and for Ethereum in July 2024. Since their establishment, ETFs have grown into a cornerstone of the market, tapping into demand from traditional institutional entities.
First, here is a chart that shows the trend in the 30-day simple moving average (SMA) of the Bitcoin spot ETF netflow over the last couple of years:
![Bitcoin Spot ETFs]()
These funds appear to have been facing a wave of outflows in recent weeks | Source: Glassnode on X
As shown in the above graph, the US Bitcoin spot ETFs saw their 30-day SMA netflow dip into negative territory back in November, suggesting net capital outflows began.
Since then, the indicator has mostly remained inside this territory, although the capital bleeding has slowed down recently. Earlier this month, the 30-day SMA netflow even flipped into the positive zone, but the net inflows lasted only briefly, with the indicator quickly returning to the red region.
A similar pattern has also been witnessed with Ethereum spot ETFs, as the chart below shows.
![Ethereum spot ETFs]()
How the 30-day SMA netflow of the US ETH spot ETFs has changed since the funds began trading | Source: Glassnode on X
From the graph, it’s visible that the US Ethereum spot ETFs have also seen their 30-day SMA netflow return to the underwater zone after a brief wave of net capital inflows.
Related Reading: Bitcoin Hashrate Slides As Foundry USA Loses 200 EH/s In US Cold SnapThis means that interest in the digital asset market as a whole continues to be down among ETF users. “There is no sign of renewed demand,” noted the analytics firm. It now remains to be seen how long the wave of outflows will go on.
BTC Price
At the time of writing, Bitcoin is floating around $88,000, down 3.5% in the last seven days.
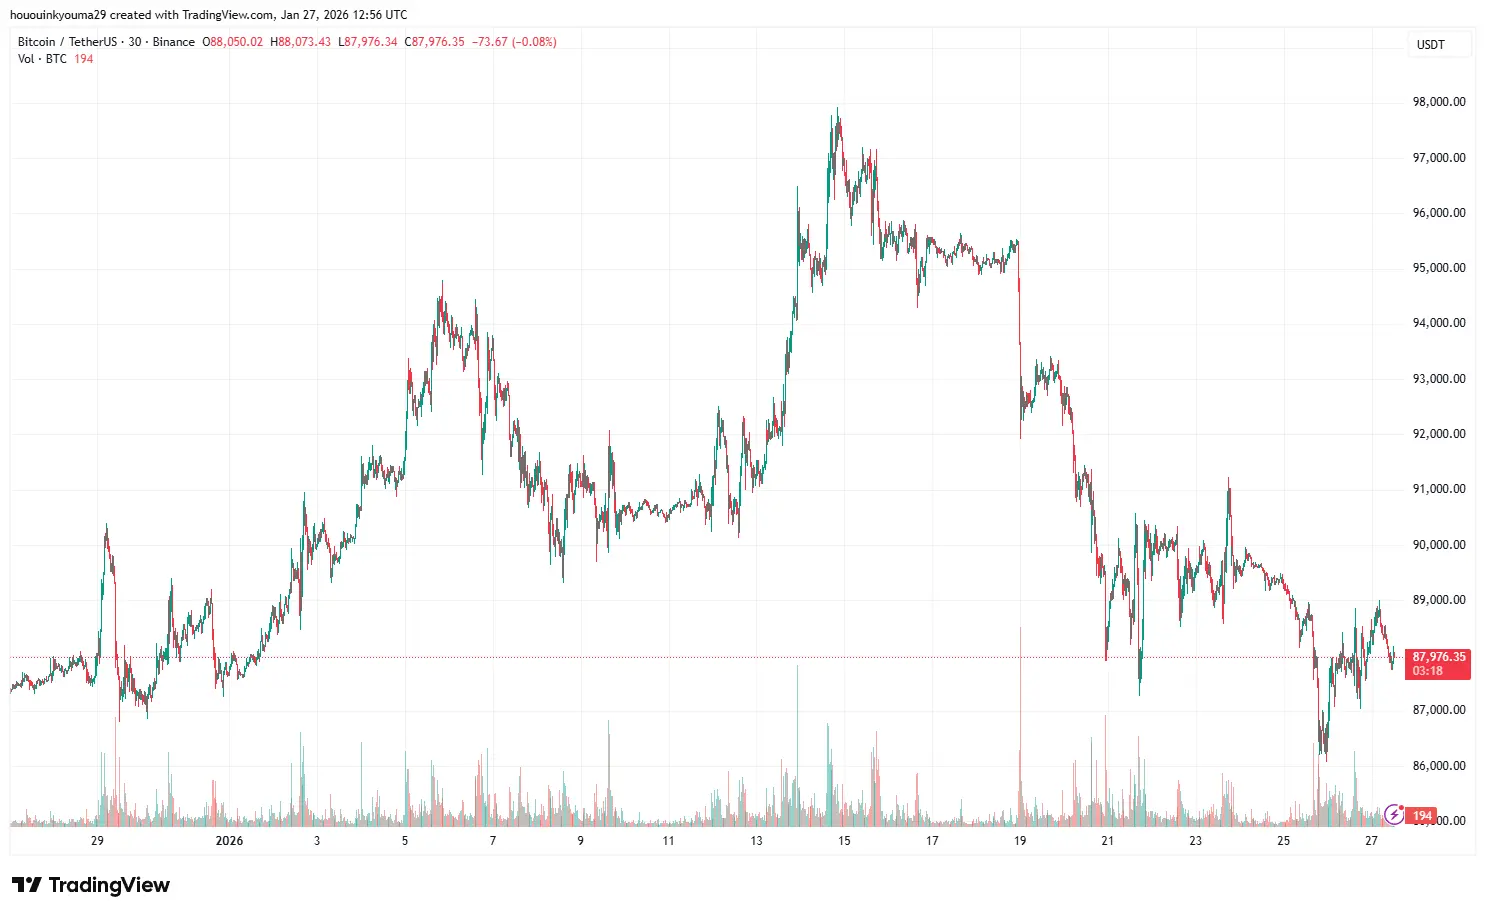
The trend in the price of the coin over the last five days | Source: BTCUSDT on TradingView
Featured image from Dall-E, chart from TradingView.com
![]() Editorial Process for bitcoinist is centered on delivering thoroughly researched, accurate, and unbiased content. We uphold strict sourcing standards, and each page undergoes diligent review by our team of top technology experts and seasoned editors. This process ensures the integrity, relevance, and value of our content for our readers.
Editorial Process for bitcoinist is centered on delivering thoroughly researched, accurate, and unbiased content. We uphold strict sourcing standards, and each page undergoes diligent review by our team of top technology experts and seasoned editors. This process ensures the integrity, relevance, and value of our content for our readers.
Disclaimer: The information on this page may come from third parties and does not represent the views or opinions of Gate. The content displayed on this page is for reference only and does not constitute any financial, investment, or legal advice. Gate does not guarantee the accuracy or completeness of the information and shall not be liable for any losses arising from the use of this information. Virtual asset investments carry high risks and are subject to significant price volatility. You may lose all of your invested principal. Please fully understand the relevant risks and make prudent decisions based on your own financial situation and risk tolerance. For details, please refer to
Disclaimer.
Related Articles
Bitcoin Funding Rate Turns Negative at -0.0031%, Major CEXs Show Mixed Rates
Gate News message, April 26 — According to Coinglass, Bitcoin's 8-hour average funding rate across the network is currently -0.0031%, indicating a bearish sentiment among traders.
Among major centralized exchanges, funding rates vary: a leading CEX shows 0.0002%, another major CEX at -0.0004%, a th
GateNews35m ago
Whale Deposits 300 BTC Worth $23.4M to CEX After 2-Year Dormancy
Gate News message, a whale has deposited 300 BTC (valued at $23.4 million) into a centralized exchange after remaining inactive for 2 years. These 300 BTC were originally withdrawn from CEX 3 years ago when BTC was priced at $19,329. The whale is currently holding an unrealized profit of $17.6 milli
GateNews2h ago
Metaplanet Issues ¥8B Bonds To Expand Bitcoin Holdings
Metaplanet raises ¥8B through zero-coupon bonds to fund Bitcoin purchases without immediate interest burden.
Firm grows BTC reserves to over 40K coins, targeting 100K by year-end despite valuation-driven losses.
Strategy relies on debt financing as stock declines, reflecting risk amid
CryptoFrontNews3h ago
CryptoQuant Analyst: Bitcoin Must Hold Above $83K to Confirm Market Recovery
Gate News message, April 26 — According to CryptoQuant analyst Axel Adler, short-term holder (STH) selling pressure has notably eased following spring market stress relief, and Bitcoin's market recovery remains underway. Current BTC price has approached the short-term holder cost basis.
Adler
GateNews3h ago
El Salvador Adds 8 BTC Over Past Week, Total Holdings Reach 7,633.37 Bitcoin
Gate News message, April 26 — El Salvador added 8 Bitcoin over the past 7 days, bringing its total holdings to 7,633.37 BTC worth approximately $624 million.
Over the past 30 days, the country has accumulated 31 Bitcoin, continuing its strategy of building its national Bitcoin
GateNews5h ago
Bitcoin Perpetual Contracts: Large Holders Earn Fees While Retail Traders Pay, Says Chief Economist
Gate News message, April 26 — Fu Peng, newly appointed chief economist at Xinhuojituan, explained the underlying business model of Bitcoin perpetual contracts on social media, comparing it to traditional finance's "deferred fees" or "overnight fees" used in precious metals and commodity spot
GateNews5h ago