
Ethereum price has been stuck in a tight range for weeks, and that quiet stretch is starting to feel uncomfortable. Since mid November, ETH price has largely moved between $2,700 and $3,400, giving traders little excitement and even less clarity.
That sideways action followed a sharp decline that began in August, when Ethereum slid roughly 45% from around $4,900. Price now sits close to $3,000, and the longer this pause continues, the louder the next move tends to be.
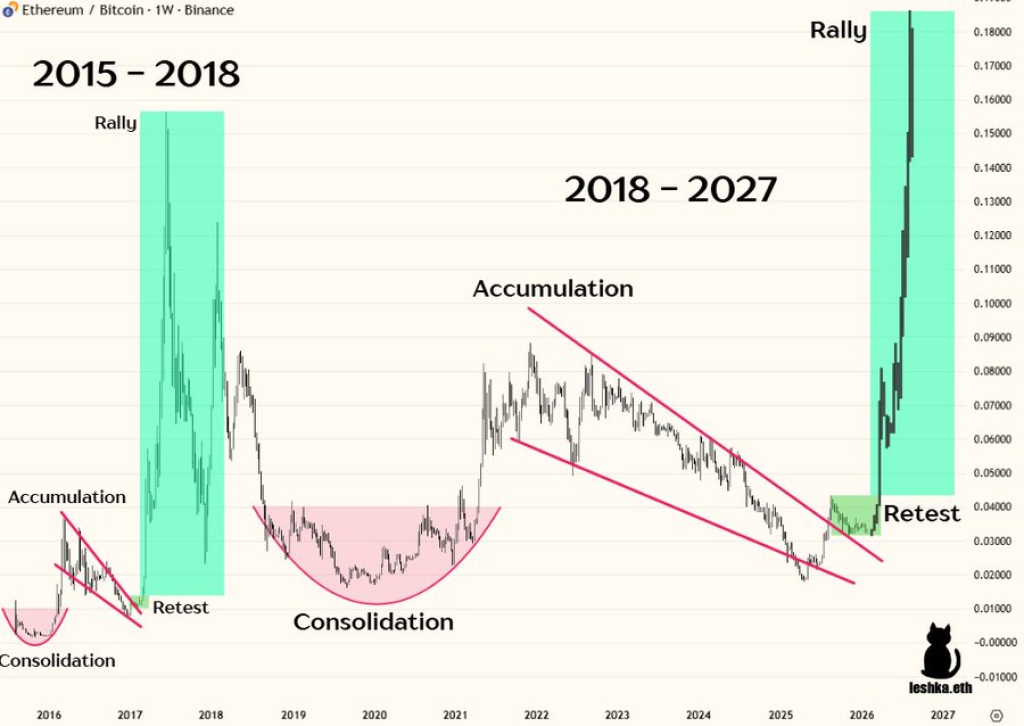
Ethereum price action during this consolidation looks ordinary on the surface. Zooming out tells a very different story. According to analyst Leshka.eth, the current ETH structure mirrors a historical pattern that once preceded an explosive rally. The chart shows a long accumulation phase followed by a clean breakout and retest. That same structure appeared years ago before Ethereum surged from $56 to $1,151.
@leshka_eth / X
Leshka.eth points out that the current setup is not identical, yet the similarities are difficult to ignore. Accumulation has lasted much longer this time, suggesting stronger hands controlling supply. ETH price has respected a downward channel for months, and recent price behavior hints that Ethereum may be attempting to break free from it.
- ETH Price Pattern Suggests A Critical Decision Zone Near $3,000
- Ethereum Institutional Activity Adds Weight To The Chart Setup
- ETH Price Outlook Hinges On Whether History Repeats Or Rhymes
ETH Price Pattern Suggests A Critical Decision Zone Near $3,000
ETH price hovering near $3,000 is not just another number on the chart. This level sits close to the midpoint of the recent range and acts as a decision zone. Sustained trading above this area strengthens the case that accumulation is nearing completion. Failure to hold it would keep Ethereum trapped inside consolidation.
Leshka.eth remains cautious despite the bullish structure. His outlook stays generally bearish, yet he acknowledges the pattern could still play out. That tension between skepticism and technical evidence is what makes the setup compelling. Markets often move hardest when conviction remains split.
Ethereum Institutional Activity Adds Weight To The Chart Setup
Beyond technicals, Ethereum has also seen notable institutional developments. Altcoin Buzz recently highlighted BitMine Immersion announcing ETH holdings exceeding 4.2 million tokens. That scale of accumulation signals confidence rather than speculation. Additional data showed $117M in net ETF inflows on the same day, reinforcing the idea of a growing institutional bid.
ETH price near $3,400 was described as a productive anchor rather than a stretched valuation. That framing matters because it suggests Ethereum is being treated less like a short term trade and more like a strategic asset.
ETH Price Outlook Hinges On Whether History Repeats Or Rhymes
Ethereum has spent months compressing energy inside a narrow range. The chart structure highlighted by Leshka.eth suggests a powerful move could follow, even if the timing remains uncertain. Accumulation phases rarely feel exciting while they last, yet they often define the next major trend.
How Much Will 10,000 ADA Be Worth by 2027 If Cardano Leads the Next Cycle?_**
Whether Ethereum price follows its historical echo or writes a new chapter, this consolidation phase appears far more important than it looks. Watching how ETH behaves around current levels may reveal clues about what comes next, and that alone makes the chart hard to ignore.
Disclaimer: The information on this page may come from third parties and does not represent the views or opinions of Gate. The content displayed on this page is for reference only and does not constitute any financial, investment, or legal advice. Gate does not guarantee the accuracy or completeness of the information and shall not be liable for any losses arising from the use of this information. Virtual asset investments carry high risks and are subject to significant price volatility. You may lose all of your invested principal. Please fully understand the relevant risks and make prudent decisions based on your own financial situation and risk tolerance. For details, please refer to
Disclaimer.
Related Articles
Gate Daily Report (April 27): Comments related to the Trump shooting incident boost the TRUMP coin; the U.S. Department of the Treasury will include Venmo in debt-inquiry donation payments
Bitcoin (BTC) sees a sharp short-term surge and rebound, temporarily trading at around $78,900 as of April 27. Trump’s provocative remarks about the shooting incident boosted the prices of meme coins such as TRUMP, MAGA, and DJT, because a carefully crafted narrative has once again come back into view. The U.S. Treasury has moved Venmo into the debt donation payment channel, after the previously strategic Bitcoin reserve bill stalled.
MarketWhisper1h ago
Ascending Triangle Breakout Loading? Top 5 Altcoins With 5x Upside Potential
Ascending triangles indicate growing buying pressure but need to be confirmed.
Toncoin and Fantom display better trends than others in consolidation.
Overall market conditions still play a crucial role in the success of breakouts.
A common technical pattern has begun to emerge among
CryptoNewsLand1h ago
Crypto Fear and Greed Index Rises to 47, Signaling Neutral Market Sentiment
Gate News message, April 27 — According to Alternative.me, the Crypto Fear and Greed Index stands at 47 today, indicating a neutral market sentiment. The index rose from 33 yesterday (April 26), reflecting a shift toward more balanced market
GateNews2h ago
Whale pension-usdt.eth's $110M Short on BTC and ETH Down $15.25M as April Rally Continues
Gate News message, April 27 — According to on-chain analyst Yujin's monitoring, whale pension-usdt.eth opened a 3x leveraged short position on $110 million worth of BTC and ETH near the start of April, but has since incurred a floating loss of $15.25 million as prices rallied throughout the month.
GateNews2h ago
BNB Price Steady Above $633 as Bulls Face Strong Barriers
Key Insights:
BNB holds above the 50-day EMA near $633, supported by whale activity, while mixed derivatives data keep price action within a consolidation range.
Technical indicators, including RSI and MACD, show mild bullish momentum, though strong resistance levels near $662 and $680
CryptoNewsLand7h ago
Chainlink Price Tightens as $10 Resistance Holds Firm
Key Insights:
Chainlink trades between $8.5 and $10 as a tightening range signals volatility expansion, with buyers showing early strength through higher lows formation.
Open interest drops to $380 million while persistent spot outflows indicate cautious sentiment, though declining selling p
CryptoNewsLand8h ago