
Key Takeaways
-
ZEC is holding a major support zone between $300–$335 after a 30% monthly correction.
-
A descending triangle pattern is forming on the daily chart.
-
A breakout above $411 could signal the start of a renewed bullish move.
Zcash (ZEC) is showing early signs of stabilization after a sharp corrective phase. As of January 26, 2026, ZEC is trading near the $360 level, posting a 4% gain over the past 24 hours. This bounce comes after a steep 30% decline over the last month, which followed ZEC’s explosive 2025 rally, where the privacy-focused cryptocurrency surged more than 800% at its peak, reaching levels near $750.
While broader market conditions remain volatile, ZEC’s latest price action suggests that the asset may be approaching a decisive moment — one that could determine whether bulls regain control or bears extend the correction.
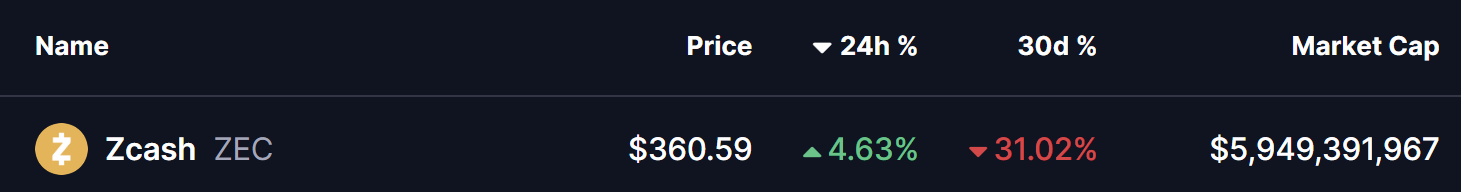
Source: Coinmarketcap
Descending Triangle Takes Shape on the Daily Chart
From a technical perspective, Zcash’s daily chart reveals a well-defined descending triangle pattern, a structure that typically forms after a strong uptrend and often precedes a major directional move.
This pattern is characterized by two key elements:
-
A horizontal support zone between $300 and $335, which has consistently attracted buyers during recent pullbacks.
-
A sequence of lower highs, creating a downward-sloping resistance line originating from the 2025 peak near $750.
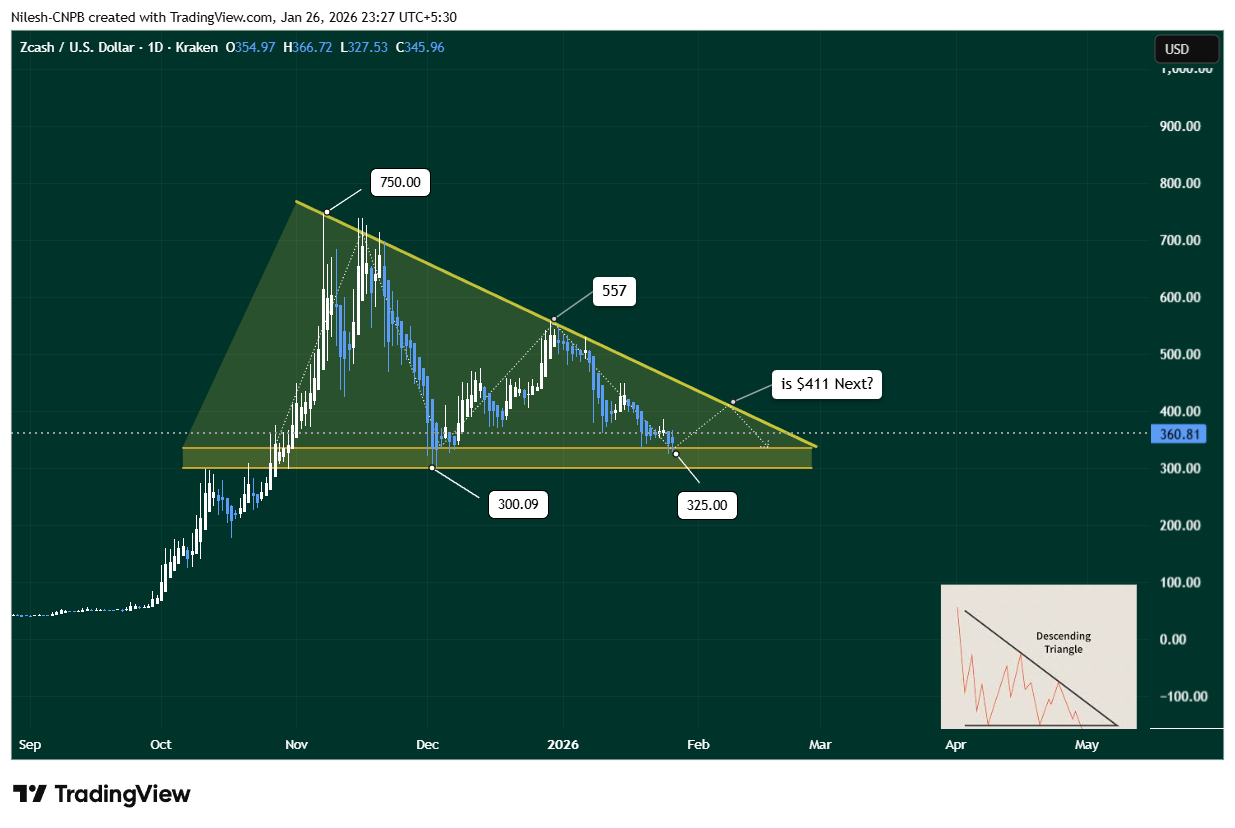
Zcash (ZEC) Daily Chart/Coinsprobe (Source: Tradingview)
During the most recent leg of the correction, ZEC dipped into the lower boundary of this support zone, finding demand near $325. Buyers stepped in aggressively at this level, triggering a rebound that lifted price back toward the $360 area. This reaction suggests that bulls are actively defending the structure and are not yet willing to concede control.
The repeated defense of the $300–$335 region highlights its importance as a critical accumulation zone. As long as ZEC continues to trade above this range, the broader technical structure remains intact.
What’s Next for ZEC?
Looking ahead, If ZEC continues to sustain above the support trendline, the next logical move would be a retest of the descending resistance near $411.
-
Bullish Scenario:
If ZEC holds above support and breaks above the $411 resistance with strong volume, it could invalidate the bearish implications of the descending triangle and mark the beginning of a new bullish expansion phase.
-
Bearish Scenario:
Failure to break resistance — or a loss of the $300–$335 support zone — could send ZEC back into consolidation or trigger another retest of lower demand levels before a clear trend emerges.
Final Outlook
Zcash is currently at a technical inflection point. The combination of strong historical support, a tightening price structure, and an early rebound off key demand levels suggests that a larger move may be approaching. Whether that move resolves higher toward $411 or lower back into support will depend on how price reacts as the descending triangle nears its apex.
For now, $325 support and $411 resistance remain the two most important levels to monitor.
Disclaimer: The views and analysis presented in this article are for informational purposes only and reflect the author’s perspective, not financial advice. Technical patterns and indicators discussed are subject to market volatility and may or may not yield the anticipated results. Investors are advised to exercise caution, conduct independent research, and make decisions aligned with their individual risk tolerance.
About Author: Nilesh Hembade is the Founder and Lead Author of Coinsprobe, with over 5 years of experience in the cryptocurrency and blockchain industry. Since launching Coinsprobe in 2023, he has been providing daily, research-driven insights through in-depth market analysis, on-chain data, and technical research.
Disclaimer: The information on this page may come from third parties and does not represent the views or opinions of Gate. The content displayed on this page is for reference only and does not constitute any financial, investment, or legal advice. Gate does not guarantee the accuracy or completeness of the information and shall not be liable for any losses arising from the use of this information. Virtual asset investments carry high risks and are subject to significant price volatility. You may lose all of your invested principal. Please fully understand the relevant risks and make prudent decisions based on your own financial situation and risk tolerance. For details, please refer to
Disclaimer.
Related Articles
Bullish Altseason Indicators Continue to Appear as Expectations for New Altcoin ATHs Rise
Bullish altseason indicators continue to appear.
Expectations for new altcoin ATHs to occur rise.
Which altcoin assets will set a new ATH first?
The crypto market continues to hold steady prices as promising crypto assets show high possibilities for their prices to hit higher bullish ta
CryptoNewsLand1h ago
Bitcoin Rises Over 14% in April as Spot ETF Inflows Reach $2.11 Billion
Gate News message, April 27 — According to QCP Group analysis, Bitcoin has climbed over 14% in April with four consecutive weeks of gains, driven by sustained institutional inflows and market dynamics. U.S.-Iran negotiations broke down again while Middle East ceasefire efforts continue.
Spot Bitcoi
GateNews2h ago
Bitcoin Implied Volatility Compresses to 39.2%, Institutions Build Bullish Structure
Gate News message, April 27 — According to 10x Research, Bitcoin's implied volatility has compressed to 39.2%, reaching its lowest level in months, while realized volatility has declined even faster to 36.1%.
This marks the first time since early 2026 that implied volatility has exceeded realized v
GateNews2h ago
Latest Bitcoin Weekly Report Shines Light on Bullish Short Phase Ahead, Can BTC Break $90,000?
Latest Bitcoin weeky report shines light on bullish short phase ahead.
Can the price of Bitcoin break $90,000 this year.
Bearish forecast follows a short bullish surge.
The crypto community remains pleased to see both BTC and ETH trading at strong and steady price levels. In
CryptoNewsLand2h ago
When DeFi is too slow for young people and too risky for old money: are we all using Treasury bond interest to shoulder junk bond risk?
DeFi once attracted young people with five-figure APY rates, but it is now seen as overpriced and carrying too much risk. Over the past year, more than $1.62 billion has been stolen, and at one point Aave’s interest rate spiked to 12.4%. The fair yield is about 12.55%, with a retail entry threshold of 18%. Institutional players prefer “strategy-isolated vaults” to reduce tail risk. Conclusion: high leverage is no longer in; in the future, we’ll need higher-risk pricing and insurance tools to accommodate both young people and old money.
ChainNewsAbmedia3h ago
VanEck: Bitcoin Bullish Signals Emerge Amid Funding Rate Dip
Fund management firm VanEck identified two strong bullish indicators for Bitcoin on April 24, according to analysis from the firm's digital assets analysts Patrick Bush and Matthew Sigel. The analysts highlighted Bitcoin's funding rate and declining hash rate as historically reliable signals
CryptoFrontier4h ago