Meme coin collective crash! DOGE, SHIB, PEPE all collapse, weekly drop exceeds 20%
Meme coins are all bearish this week. DOGE dropped over 2%, breaking below $0.12 for four consecutive weeks, with bears targeting $0.10, RSI at 34. SHIB broke the double moving averages, with support at $0.00000678, RSI at 36. PEPE declined for three days, accumulating an 8% drop, with support at $0.00000363. The MACD for all three coins confirms a widening negative zone, indicating a downtrend.
Dogecoin Continues Four Weeks of Decline, Bears Target $0.10
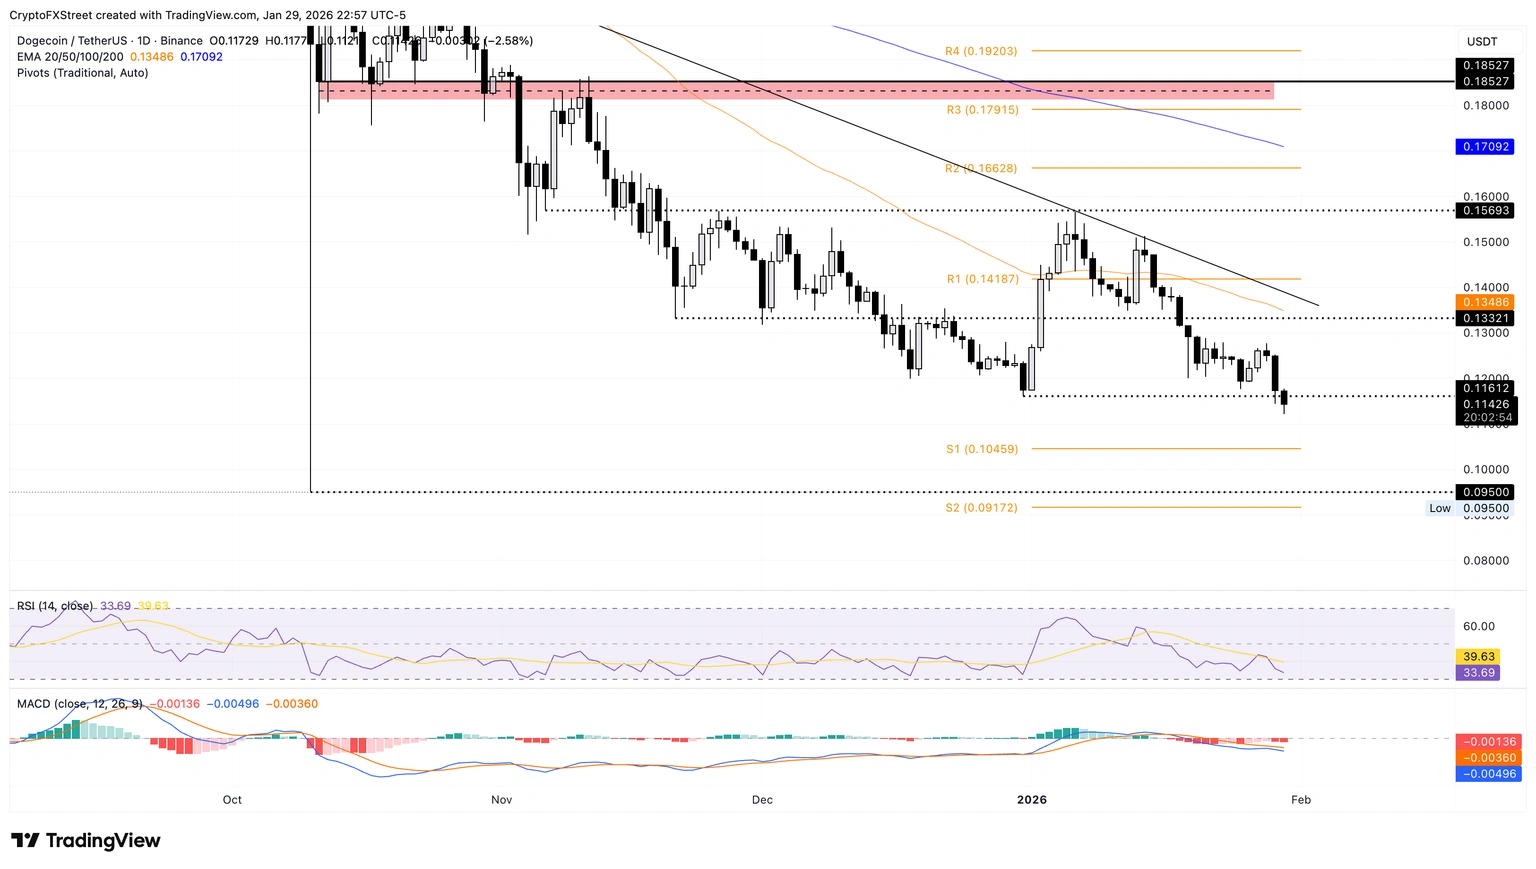
(Source: Trading View)
As of Friday’s close, Dogecoin fell over 2%, continuing the 6% decline from the previous day. DOGE has declined for four straight weeks, breaking below $0.12, with bears aiming for the psychological support at $0.10. After breaking this key level, DOGE’s critical support zone remains between the October 10 low of $0.9500 and the S2 pivot point at $0.9172.
The MACD indicator has extended below the signal line into the negative zone, and the histogram below the zero line has further expanded, confirming downward momentum. MACD is an important indicator of trend strength and direction; when the fast line remains below the slow line and the histogram is negative and widening, it indicates that the downtrend is not only continuing but accelerating. Based on MACD patterns, there are no signs of reversal in the short term.
The RSI at 34 is below the midline and approaching oversold territory, which may slow further declines but still favors bears. RSI is close to 30, the oversold zone, but has not yet entered it, meaning there is still room for further downside. Only when RSI drops below 30 and then begins to rebound can it be considered a sign of oversold bounce.
Potential rebound attempts may face resistance at the 50-day moving average of $0.1348. This level is a short-term trend pivot; failure to regain it could sustain the bearish outlook. The $0.10 psychological level and support zone could trigger panic selling if broken.
Shiba Inu Double Moving Averages Confirm Bearish Pattern
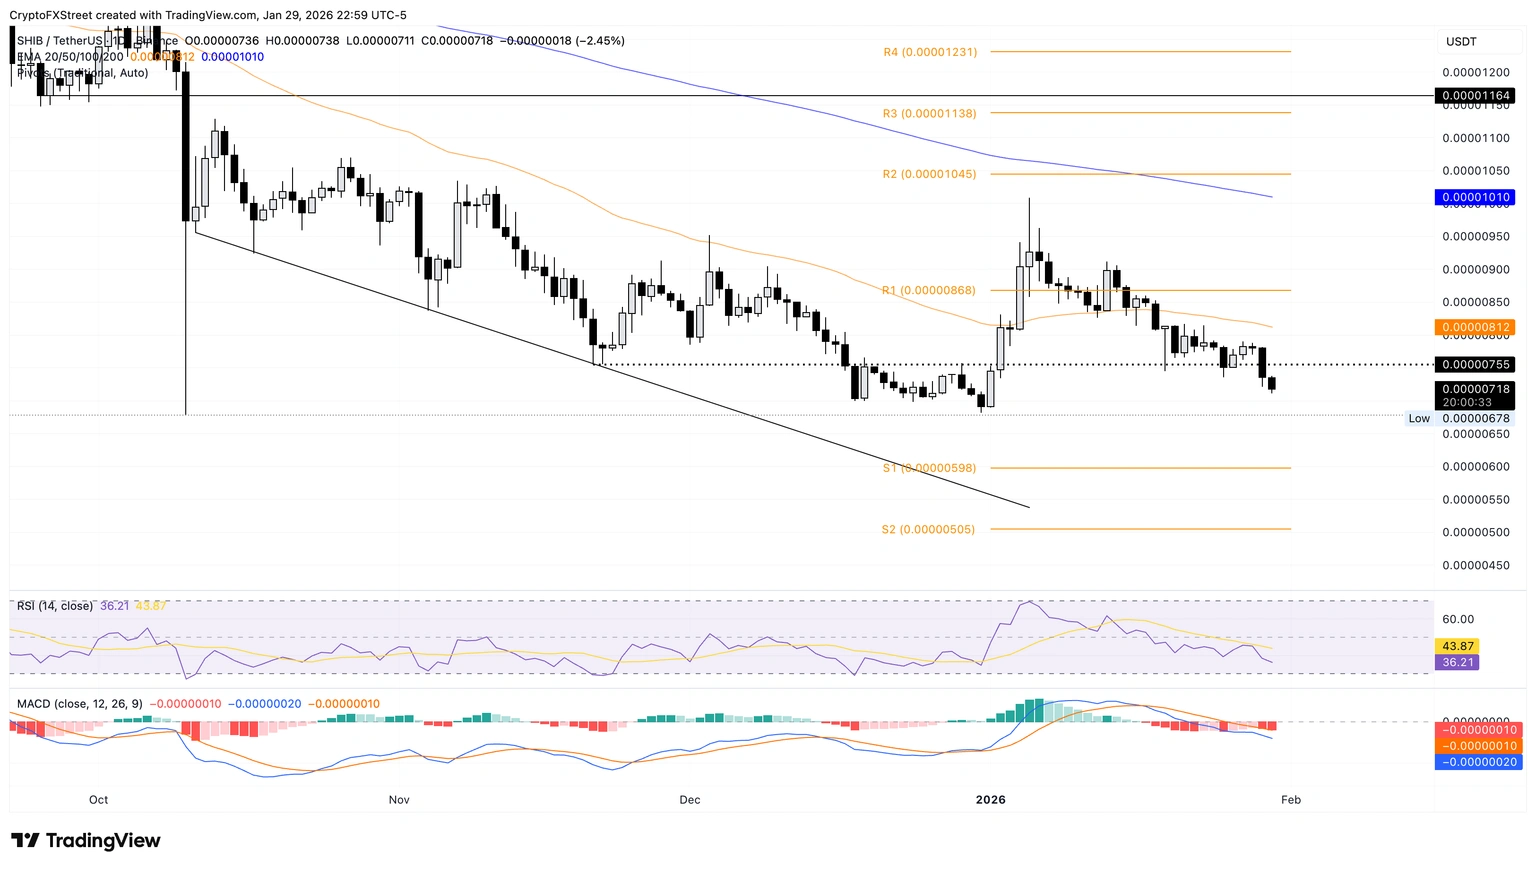
(Source: Trading View)
SHIB remains below the 50-day exponential moving average (EMA) and the 200-day EMA, with the 200-day EMA also trending downward. The short-term moving average is below the long-term, forming a bearish pattern. As of the report, SHIB price declined 2% on Friday, continuing Thursday’s 5% drop. This persistent downward momentum indicates heavy selling pressure and weak buying support.
The MACD and signal line have crossed below zero, with the histogram deepening further, showing strong bearish momentum. Meanwhile, RSI near 36 indicates approaching oversold conditions, with selling pressure intensifying. The double moving average bearish alignment is one of the most reliable trend confirmation signals in technical analysis; when the 50-day MA is below the 200-day MA and both are declining, it typically signals a strong downtrend.
SHIB’s immediate support remains at the October 10 low of $0.00000678, followed by the S1 pivot at $0.00000598. These supports are close, meaning a breach of the first could quickly test the second. If both are broken, SHIB could enter a price vacuum, accelerating the decline.
Comparison of the Technicals of the Three Meme Coins
Dogecoin: broke $0.12, four weeks down, RSI 34, target $0.10 psychological support
Shiba Inu: double moving averages bearish, RSI 36, support at $0.00000678
PEPE: down for three days, cumulative 8% decline, support at $0.00000363
On the positive side, SHIB’s potential rebound could face resistance at the 50-day moving average of $0.00000812. This level is a key medium-term trend point; if regained, it could attract trend followers and trigger a larger rebound. However, given the current technical setup, such a rebound seems less likely.
PEPE Falls for Three Days, Breaks Below 50-Day Line
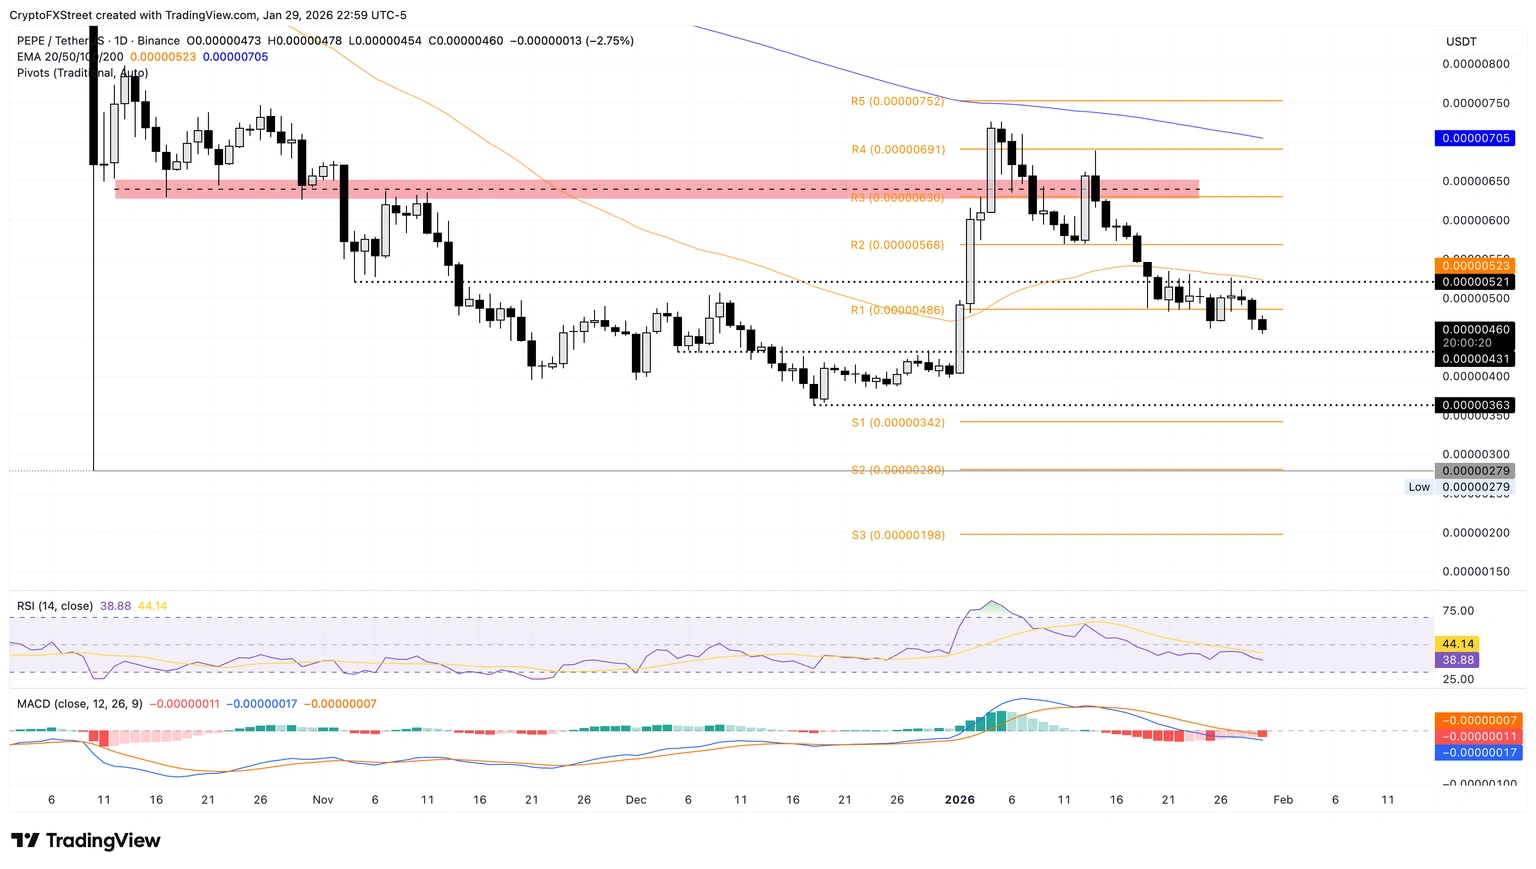
(Source: Trading View)
Similar to other popular meme tokens, Pepe declined 5% on Thursday and was down 2% as of Friday’s close. The frog-themed meme coin has fallen for three consecutive days, moving away from the 50-day moving average. Both the 50-day and 200-day moving averages are trending downward, indicating increasing downward momentum. Momentum indicators on the daily chart also show PEPE facing significant selling pressure.
From a downside perspective, risk remains high, with recent support at the December 18 low of $0.00000363. This support is close to current prices; if panic selling continues, it could be reached quickly. More concerning is the lack of clear technical support below $0.00000363; if this level is broken, PEPE could accelerate its decline.
To resume an upward trend, PEPE needs to close daily above the 50-day moving average of $0.00000523. Achieving this would require about a 44% rebound, which is very difficult in the current market environment. As a newer meme coin, PEPE’s price volatility is typically higher than DOGE and SHIB, leading to larger drops during declines but also potentially stronger rebounds.
The overall meme coin market is entering a deep correction phase, with the three major tokens breaking down technically, indicating a deterioration in market structure. Consecutive weeks of decline have eroded bullish confidence, and the overall bearish technical setup makes rebounds more difficult. Unless there is a major catalyst (such as regulatory news or a sudden shift in market sentiment), meme coins may continue their bottom-finding process.
Related Articles
Dogecoin On-Chain Losses Hit Record High: 1,100 Days of "Profit Days" Warning that DOGE May Enter a Two-Year Bottoming Cycle
Make-or-Break Moment for Dogecoin (DOGE): Can It Defend $0.090 or Face a Deeper Slide?
Dogecoin breaks through key resistance to turn it into support: DOGE price gains strength and may challenge the $0.096 level