Bitcoin Cash (BCH) is currently one of the few cryptocurrencies in the top 10 with a weekly price chart trending upward. Meanwhile, BNB was once considered a potential next candidate but has been under heavy pressure, experiencing a 54% decline over the past four months.
In contrast, BCH has maintained trading within a stable range for nearly 20 months. The price range fluctuates from $272 to $640, offering many attractive opportunities for swing traders.
According to a report from Coinphoton, long-term investors expect this range’s high to be broken and turned into support before considering participation in a stronger bullish trend. Although buyers attempted a breakout in early January, this effort was unsuccessful due to a market-wide sell-off that caused the price to reverse and correct.
However, currently, the Bitcoin Cash network appears to be maintaining a stable state. The significant increase in transaction volume along with active whale movements recently indicates strong on-chain liquidity circulation.
Short-term traders focus on the middle of the range to predict the next move
Since the second week of October, BCH price has touched below the support level in the middle of the $456 range three times on the weekly timeframe. However, no weekly close has fallen below this level, keeping the outlook positive.
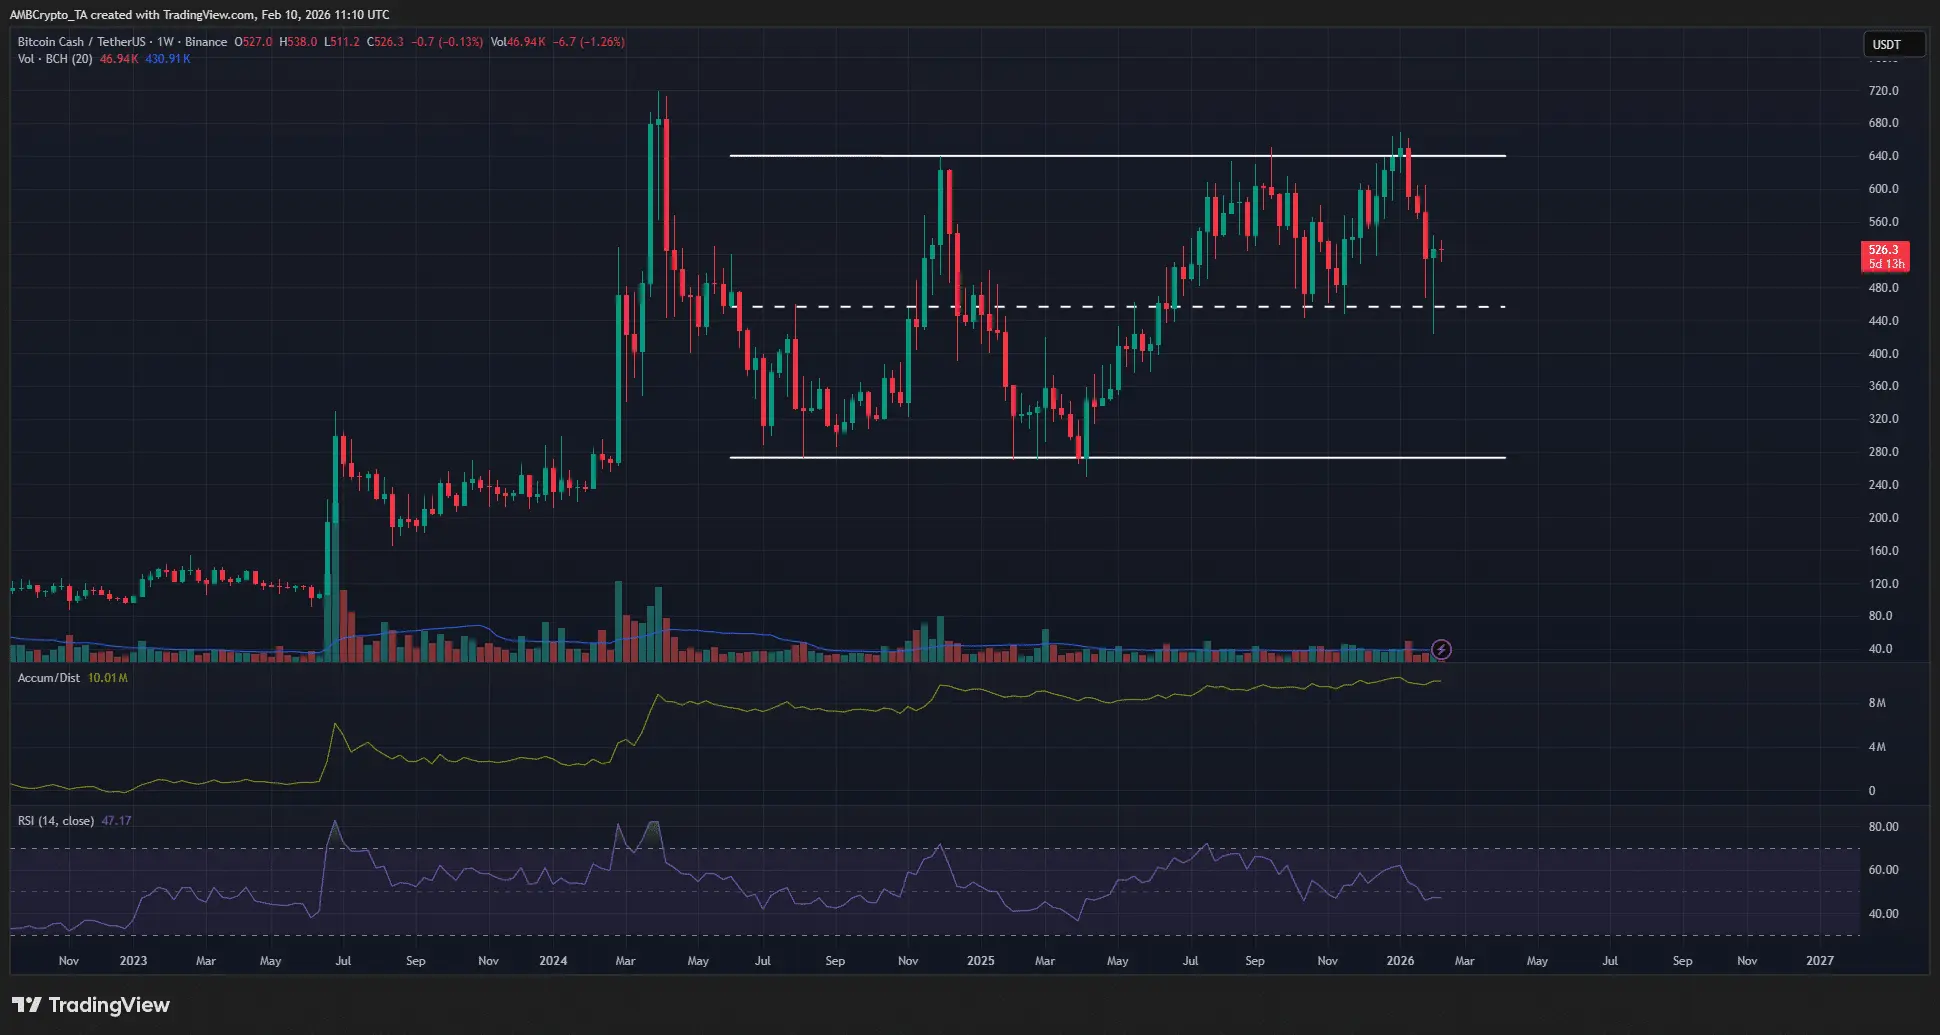 Source: TradingView The accumulation/distribution (A/D) indicator has maintained an upward trend since 2024, reflecting steady buying pressure. Additionally, the weekly RSI is currently at 47, indicating neutral momentum.
Combined with long-term price action, the $440–$460 zone is considered a low-risk, high-reward buying opportunity for investors.
Local supply zones may exert downward pressure
Liquidation heatmaps show that the $550 and $610 price levels are important nearby zones with significant potential to attract upward price movement before a reversal occurs. Notably, the supply zone at $550 has accumulated liquidity over the past 10 days.
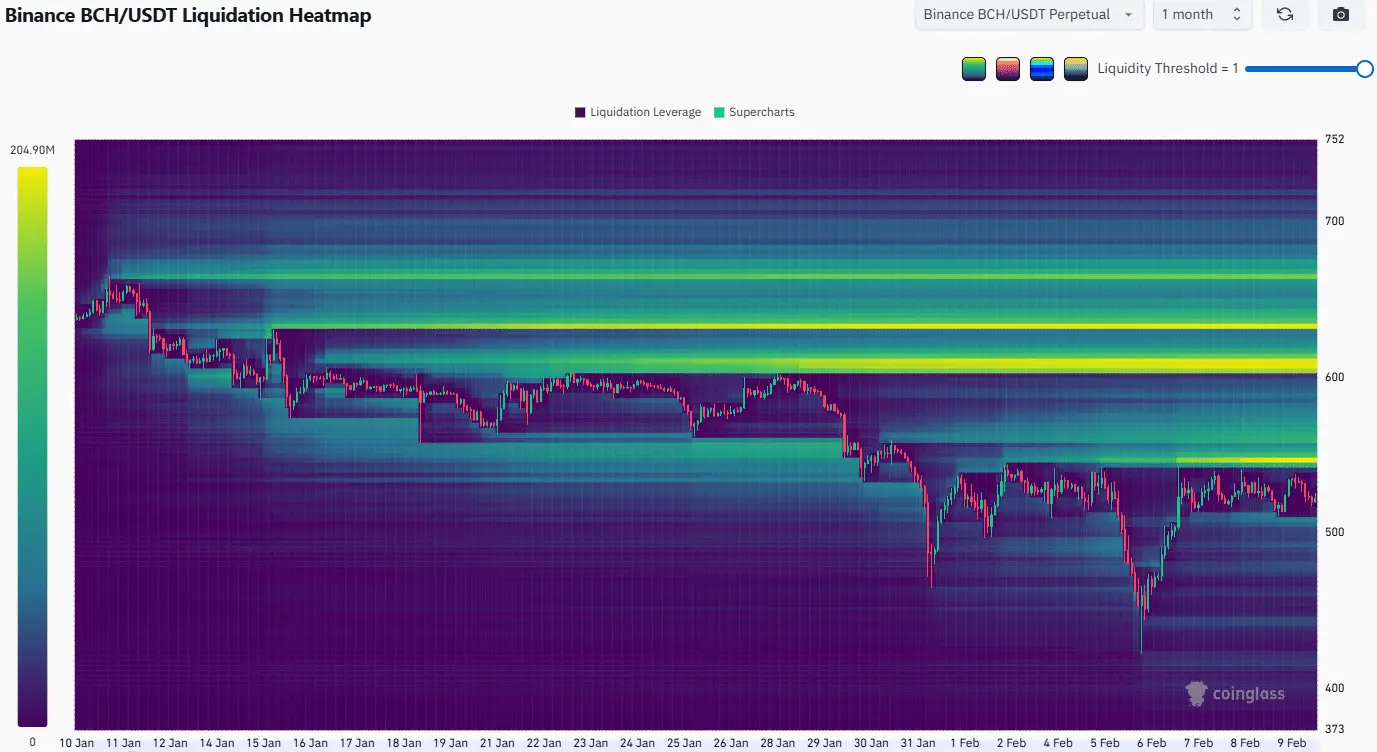 Source: CoinGlass Furthermore, the 4-hour chart indicates that BCH buyers have failed to break through the resistance at $540.
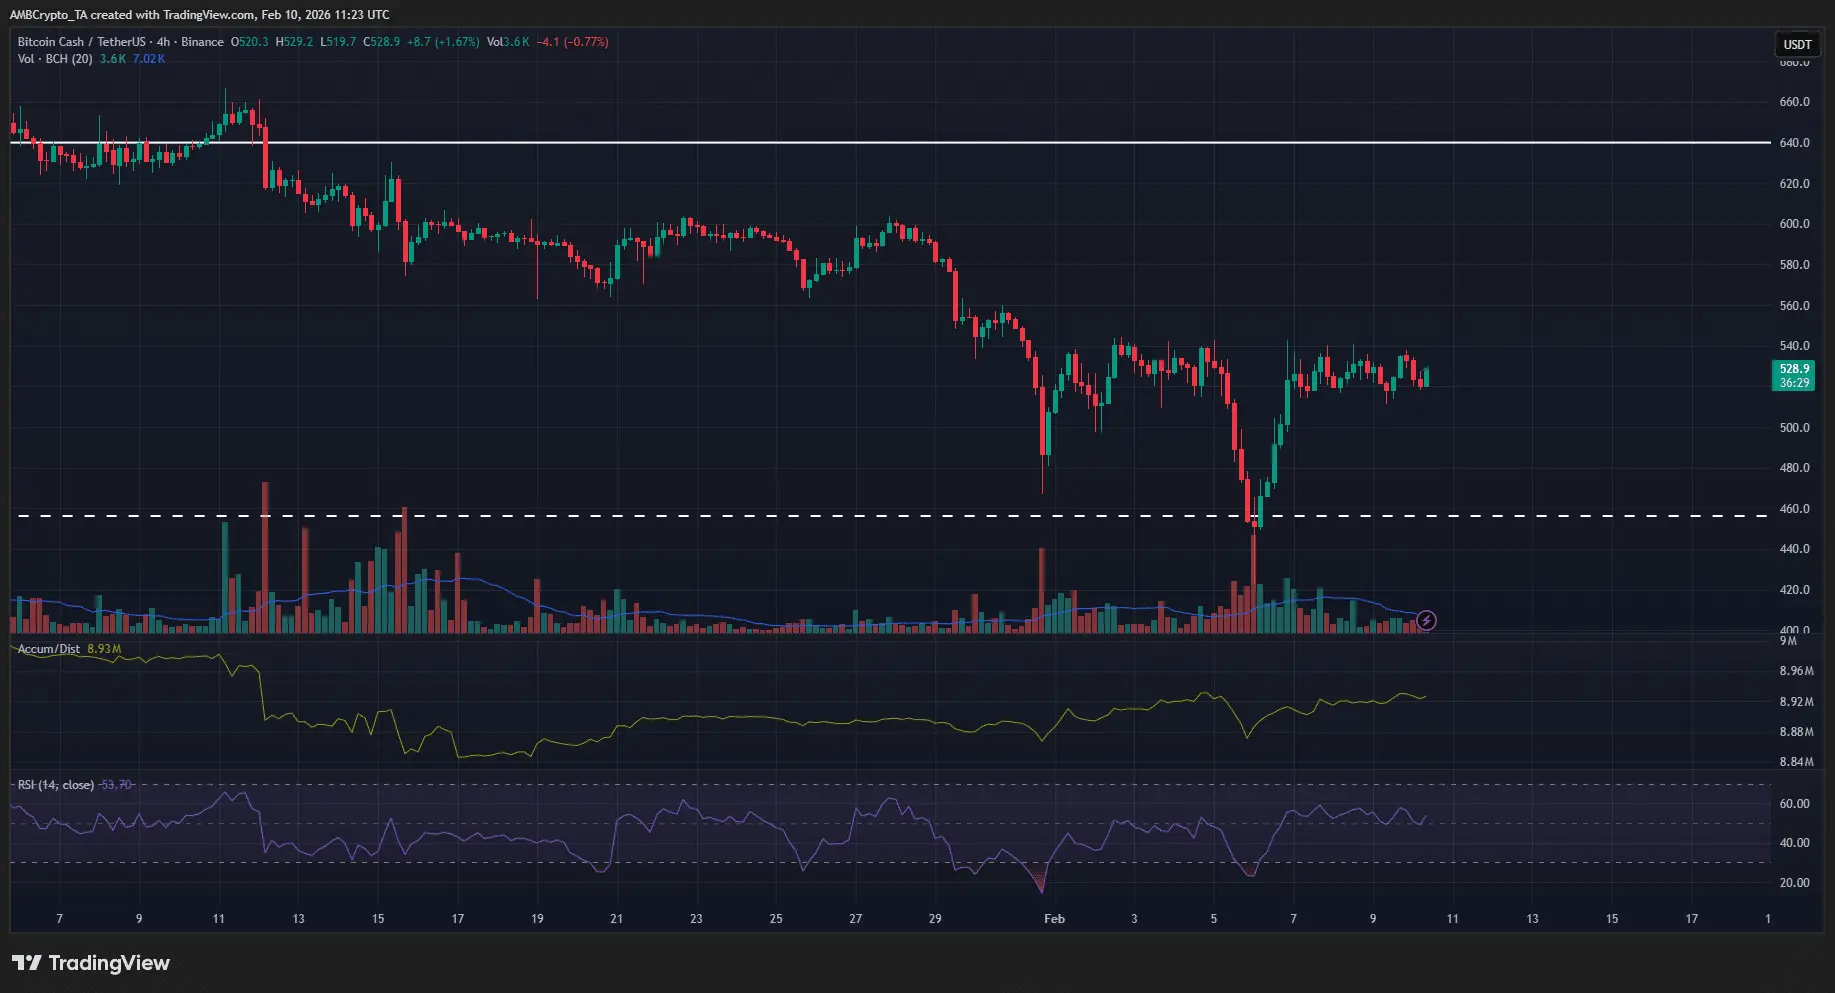 Source: TradingView Therefore, a possible scenario is that the price will be pushed higher in the short term to the $550–$560 zone before correcting downward to around $460. However, if BCH can break above $580, this scenario will be invalidated, opening the potential for a stronger rally.
Disclaimer: The information on this page may come from third parties and does not represent the views or opinions of Gate. The content displayed on this page is for reference only and does not constitute any financial, investment, or legal advice. Gate does not guarantee the accuracy or completeness of the information and shall not be liable for any losses arising from the use of this information. Virtual asset investments carry high risks and are subject to significant price volatility. You may lose all of your invested principal. Please fully understand the relevant risks and make prudent decisions based on your own financial situation and risk tolerance. For details, please refer to
Disclaimer.
Related Articles
Bitcoin to $90,000? Top Analyst Outlines Bullish Case Following Recent Breakout - U.Today
Bitcoin has achieved a significant breakout, prompting analysts to set aggressive price targets. Will Meade predicts a rise to $90,000 based on current momentum, following a range-bound trading environment and consolidation, indicating bullish trends in the market.
UToday8m ago
Bitcoin Cash Battles $459 Resistance as Massive Sell Walls Stack Toward $650
BCH is trading at $455.86 close to the resistance range of $459.20 with the support level of $447.44.
The chart data indicates that the chart has strong resistance levels at around $520, $580 and $650 which restricts the momentum on short term upside.
Following a sharp fall, price
CryptoNewsLand18m ago
Dogecoin Holds $0.0925 as Traders Recall Historic 12x Surge and Watch $0.09443 Resistance
Dogecoin is trading at $0.0925 which translates to 0.6% increase in the past 24 hours.
The short term range is narrow as support and resistance are located at levels of $0.09173 and $0.09443 respectively.
Historical chart data shows that there
CryptoNewsLand23m ago
Solana Approaches Major Triangle Breakout With $373 Target in Focus
Price action shows a tightening structure between descending resistance and a rising long-term support trendline.
The chart highlights $373.42 as a potential liquidity level if price breaks above the descending resistance.
The rising base trendline continues stabilizing price after the l
CryptoNewsLand1h ago
Cardano (ADA) Holds Top 10 Market Cap Rank as OI Surge Offsets Bears - U.Today
Cardano has regained its position in the Top 10 cryptocurrencies, currently ranking 10th with a market cap of $10.34 billion. The crypto market is experiencing a rally, with Cardano seeing significant volume increases and positive sentiment ahead of its upcoming Van Rossem hard fork.
UToday1h ago
Avalanche (AVAX) stands before a breakthrough opportunity thanks to strong buying power from the bulls
Avalanche (AVAX) has shown a 13% increase over the past week, maintaining trading above $10. Growing interest from individual investors and positive derivatives data indicate a potential bullish trend, despite ongoing geopolitical tensions.
TapChiBitcoin2h ago
