The LINK price is starting to catch traders’ interest again, and honestly, it makes sense. After months of grinding lower, Chainlink is now sitting right near the bottom of a major macro range, and that’s usually where things start getting interesting.
Crypto expert Lucky summed up the mood perfectly with a simple question: is $LINK quietly getting ready for a comeback? And when you look at the charts, it’s not hard to see why that idea is floating around again.
- Monthly Chart Shows LINK Price Still Stuck in a Massive Range
- Daily Chart: LINK Price Is Sitting Right in a Demand Zone
- LINK Price Outlook: Quiet Setup or Something Bigger Brewing?
Monthly Chart Shows LINK Price Still Stuck in a Massive Range
On the monthly timeframe, the LINK price has basically been trapped in a huge consolidation zone for years now. The chart shows that impulse move into the 2021 peak, followed by a long stretch of sideways action where price has been capped inside a broad range.
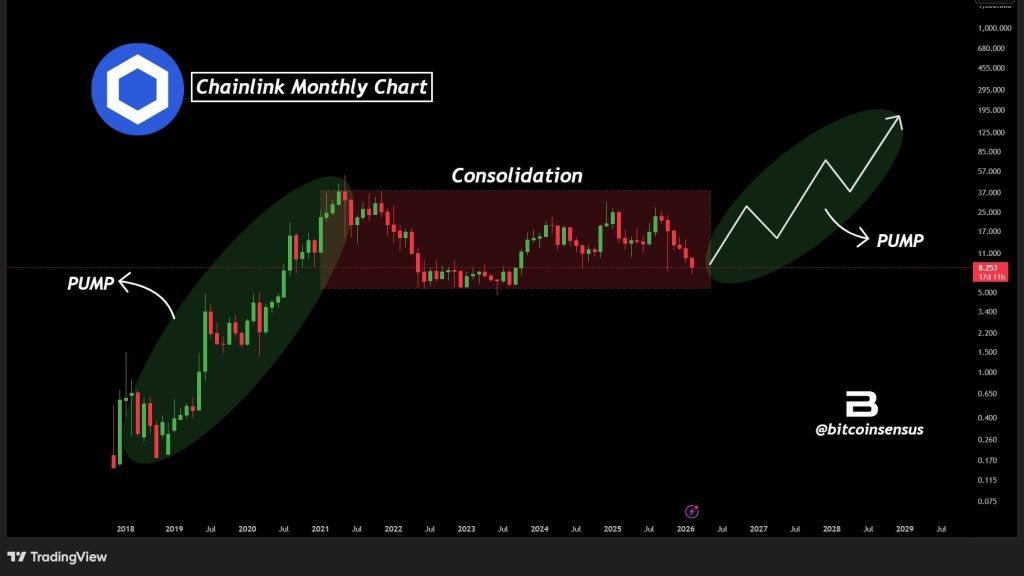
Source: X/@Bitcoinsensus
The key detail is where LINK sits right now, near the lower end of that range. That’s important because these lower range zones are often where price compresses before the next major expansion phase begins.
Bitcoinsensus pointed out this same structure, calling it a macro consolidation that may be nearing its end. The idea is pretty simple: big impulse, long reset, then eventually the next wave higher once the range finally breaks.
Daily Chart: LINK Price Is Sitting Right in a Demand Zone
Zooming into the daily chart shared by Lucky, the LINK price is sitting inside a clear demand zone after months of downtrend pressure. That falling resistance line has controlled price for a long time, but now LINK is compressing right near support, which is usually where sellers start losing their grip.
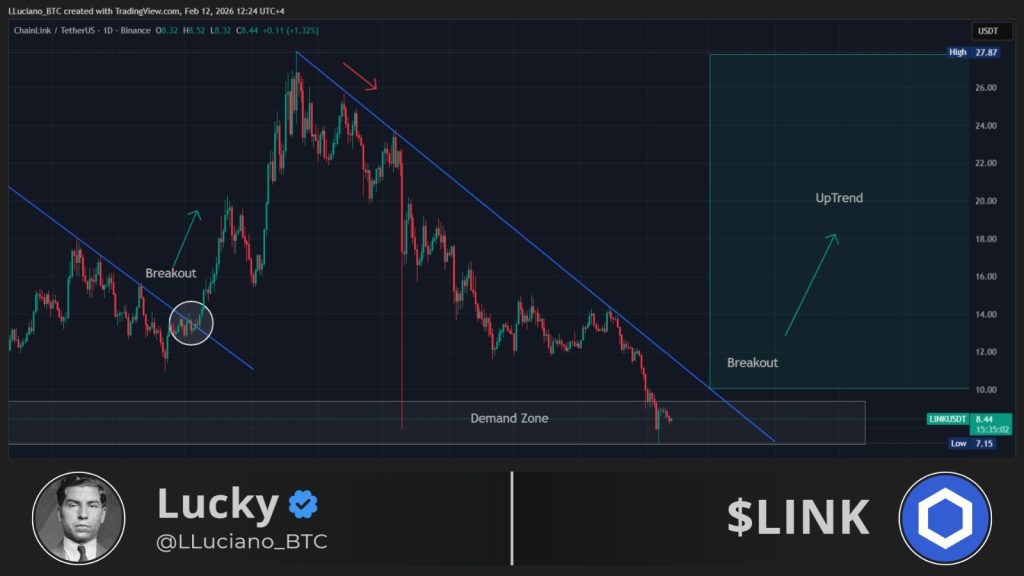
Source: X/@LLuciano_BTC
The chart also highlights a breakout area above the downtrend line, and if the LINK price can reclaim momentum and push out of this base, the upside starts opening up quickly. The target zone on the chart stretches toward the $20–$27 region, which would be a full recovery move back into the upper structure.
Top Analyst Says Chainlink (LINK) Price Could 17x From Here – The $100 Chart Setup Explained_**
LINK Price Outlook: Quiet Setup or Something Bigger Brewing?
Right now, the LINK price is still in the “boring” phase of the cycle, that part where everything feels slow right before it stops being slow. Macro consolidation near range lows, compression on the daily chart, and a clear breakout trigger overhead are exactly the kind of setup traders like to spot early.
If LINK breaks out of its downtrend and starts reclaiming higher levels, this could turn into one of those comeback charts people only appreciate after the move is already gone. For now, Chainlink is sitting at a major decision point. And the next move could end up being a lot bigger than it looks today.
Disclaimer: The information on this page may come from third parties and does not represent the views or opinions of Gate. The content displayed on this page is for reference only and does not constitute any financial, investment, or legal advice. Gate does not guarantee the accuracy or completeness of the information and shall not be liable for any losses arising from the use of this information. Virtual asset investments carry high risks and are subject to significant price volatility. You may lose all of your invested principal. Please fully understand the relevant risks and make prudent decisions based on your own financial situation and risk tolerance. For details, please refer to
Disclaimer.
Related Articles
Analysis: BTC has not yet rapidly surged to $80,000, and after gold's rally slows down, funds may flow back into the crypto market.
Bitcoin fluctuates above $72,000, while Ethereum rises slightly. The market experiences consolidation; despite Bitcoin successfully breaking through the $70,000 mark, it has not quickly surged toward $80,000. In the context of easing tensions in the Middle East, risk assets are boosted. Derivatives data shows bullish sentiment remains strong, but gold-linked token futures contracts decline, indicating capital flowing into cryptocurrencies. In the options market, demand for high-strike call options increases, and overall volatility remains stable.
GateNews13m ago
Assess whether DOGE holds above $0.088 as whale selling pressure increases
Dogecoin (DOGE) is facing strong selling pressure since breaking below $0.1. During this prolonged downtrend, DOGE has broken the support level of $0.09 and touched a low of $0.088 before a slight rebound.
At the time of writing, DOGE is trading at $0.092, up 2.56% in the past 24 hours, reflecting increased volatility.
TapChiBitcoin25m ago
Hyperliquid Just Did $2.9T - The CEX Era Officially Ended
Bitcoin experienced an 8.12% increase in March 2026 after two months of losses. Historical data indicates March is typically strong for Bitcoin, with hopes for continued gains amidst market volatility and cautious sentiments among traders.
Coinfomania33m ago
After -25% Bloodbath… Bitcoin Is +8% – Too Late to Buy?!
Bitcoin experienced an 8.12% increase in March 2026, turning around losses from the previous months. Historically, March has been strong for Bitcoin, showing average gains and a potential for renewed market confidence, even as traders remain cautious about future trends.
Coinfomania47m ago
Dogecoin Price Pressures Mount as $0.08 Support Nears Break
Key Insights:
Dogecoin maintains a firm bearish structure as consecutive lower highs and lower lows reinforce sustained downside pressure across higher timeframes.
The $0.08 level aligns with value area low and historical demand, making it a decisive zone for near-term market
CryptoFrontNews1h ago

