Can PEPE repeat the price surge from April 2024?
The memecoin market continues to demonstrate a clear divergence from previous growth cycles, where FUD (fear, uncertainty, doubt) was often the main factor driving short-term capital flows. Current data shows an increasing polarization between tokens without real utility and past trends.
According to CoinMarketCap, the memecoin sector lost nearly $8 billion in 2026, dropping to its lowest level in years. Some memecoins experienced declines of over 60%, with only a few maintaining relative stability.
In this context, the 47% drop in Pepe (PEPE) price during the same period indicates that even the “OGs” (veteran icons) are not immune to market pressure.
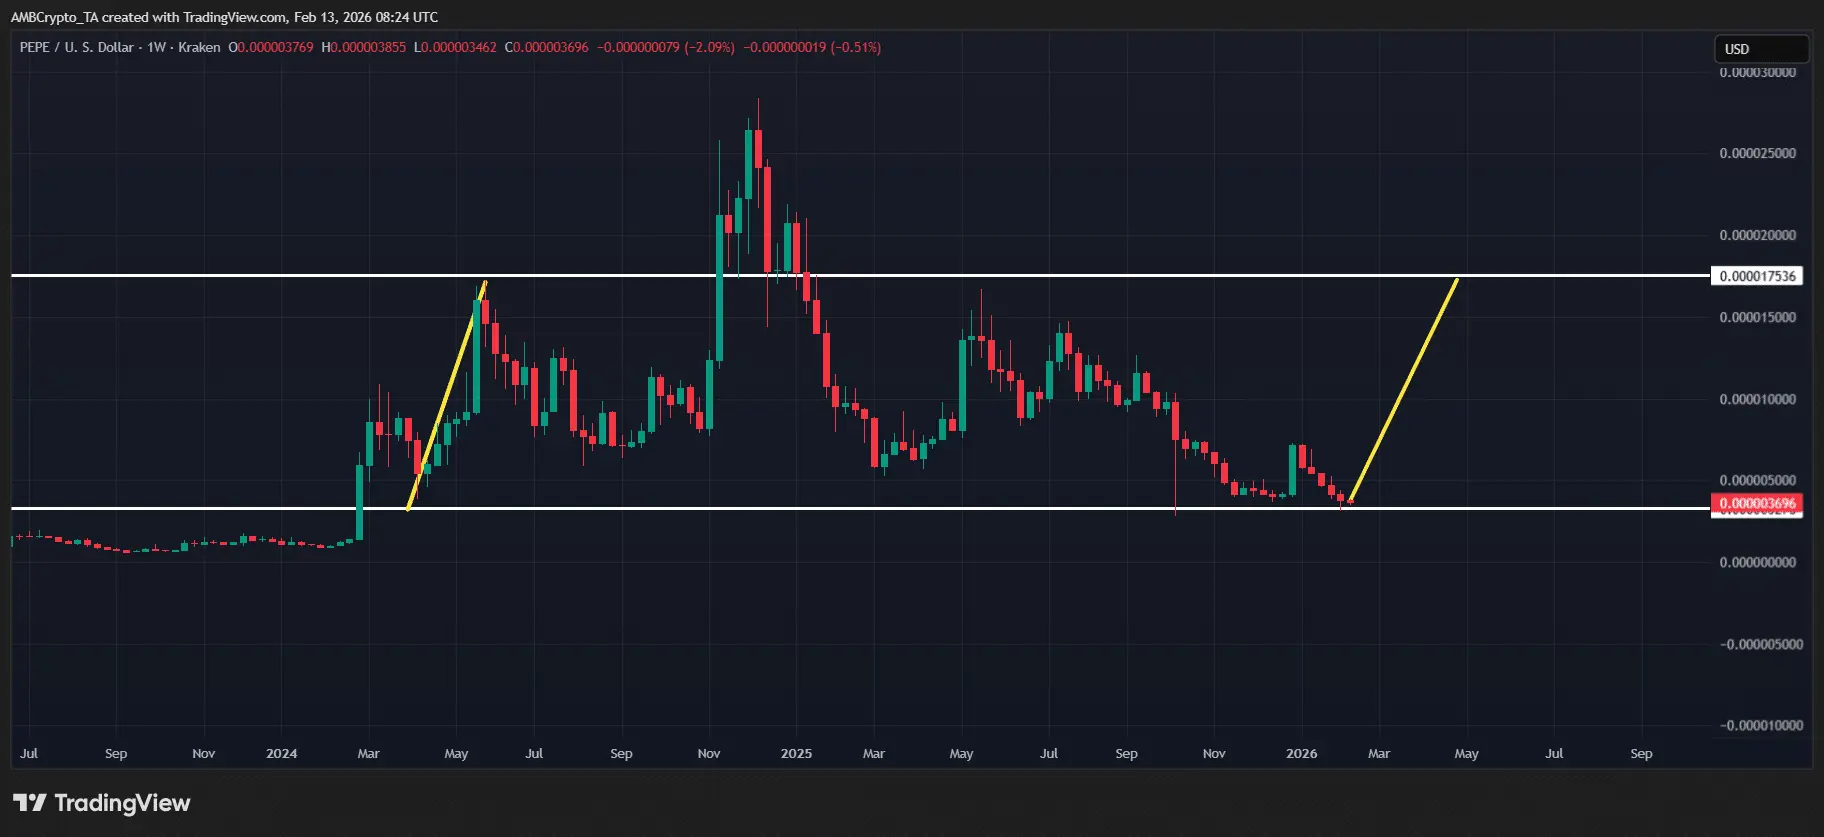 Source: TradingView However, it is noteworthy that social activity around PEPE remains high. Recent Twitter posts reached 888, while positive sentiment surged to 80.95%.
A Critical Moment for PEPE
According to Coinphoton, the current period is crucial for PEPE’s price development.
On the chart, PEPE has fallen to an important support level since early April 2024, around $0.0000035. In the previous cycle, this price level triggered an impressive 152% rally, highlighting the high volatility and the potential for quick trend reversals in memecoins.
Additionally, PEPE’s open interest (OI) shows positive signs, with nearly $30 million added to new positions just in the past week. This represents a 15% increase, bringing total OI to $221 million, indicating traders are preparing for a breakout move.
Considering these factors, the formation of a bottom for PEPE is becoming increasingly evident. However, a major question remains: with a 40% decline over the past month, could the current recovery turn into a classic “bear trap,” trapping short sellers if the upward momentum persists?
On-chain Indicators Signal PEPE’s Breakout Potential
On-chain metrics are signaling the possibility of a “short squeeze” for PEPE.
According to Arkham Intelligence, there is a clear divergence between spot positions and perpetual contracts. Notably, PEPE’s Funding Rate has turned negative, indicating increasing short pressure as many traders bet on further price declines.
Furthermore, data from Santiment reveals that the top 100 PEPE wallets have accumulated an additional 23.02 trillion tokens since the sharp drop in October. This activity has started to impact the market, with the PEPE/BTC pair gaining 4.3% in a single day.
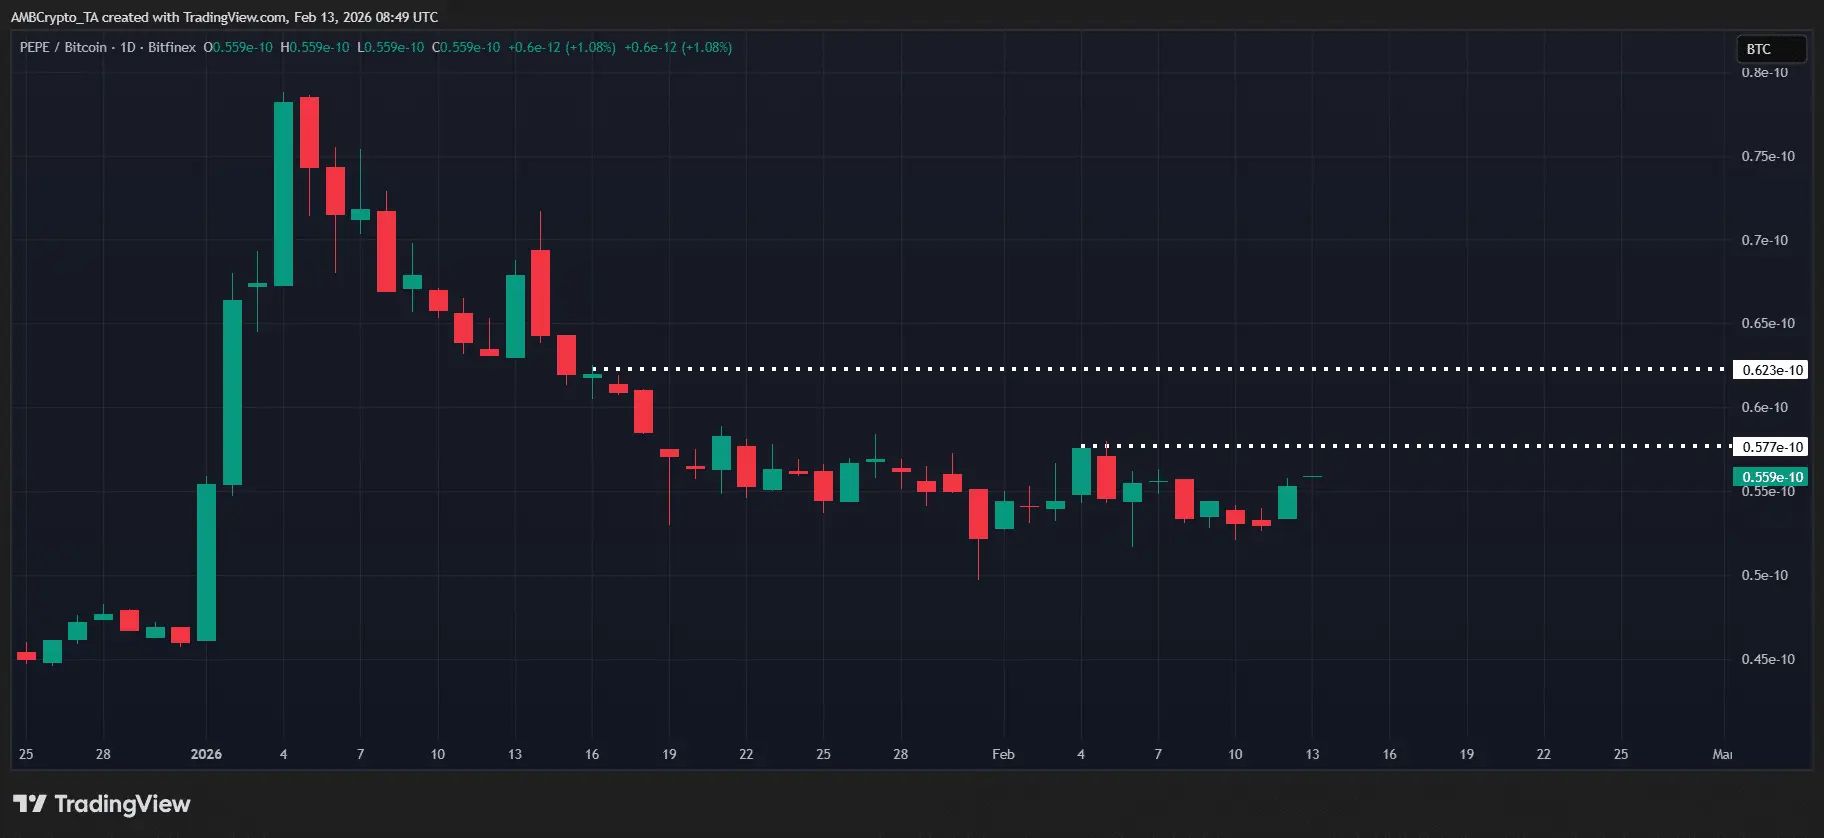 Source: TradingView (All these factors combined create a typical “bear trap” scenario. The rising OI, strong capital flows, and significant accumulation at historical support levels are not coincidental. With the current negative Funding Rate, the buying side is gradually pushing short sellers into a dangerous position.
If this trend continues in the coming days, PEPE could break through the short-term resistance at $0.0000065, opening the door for a strong rally similar to that in April. For investors, this is a critical time to pay close attention to on-chain signals, as they are becoming key factors in predicting the next trend.
Mr. Teacher
Related Articles
PEPE Holds $0.054351 Support as 4H Breakout Faces $0.054808 Resistance
PEPE Price Compresses Near $0.05438 as Key Indicators Signal Neutral Momentum
Project Hunt: Token trading tool pepe boost for the past 7 days, the project most unfollowed by top figures
PEPE Nears Upper Range Boundary After 28% Rally as $0.053806 Support Remains Intact
PEPE Nears Upper Range Boundary After 28% Rally as $0.053806 Support Remains Intact
PEPE Holds $0.054351 Support as 4H Breakout Faces $0.054808 Resistance