Hedera breaks through a key resistance level, signaling a reversal: Will the price hold above the $0.10 mark?
The price structure of HBAR began to shift as the market was tightly compressed below the long-term downtrend line, while continuously facing pressure from the horizontal resistance zone at $0.10 — an area that has repeatedly halted previous recovery attempts.
During this phase, demand quietly absorbed supply around the $0.073–$0.090 range, creating a series of higher lows. This development reflects a gradual weakening of the bears and an ongoing re-accumulation process.
A turning point occurred when momentum expanded strongly, with a weekly candle closing decisively above the $0.10 level. This signal not only confirms a breakout of the key resistance zone but also marks the end of the previous long-term downtrend.
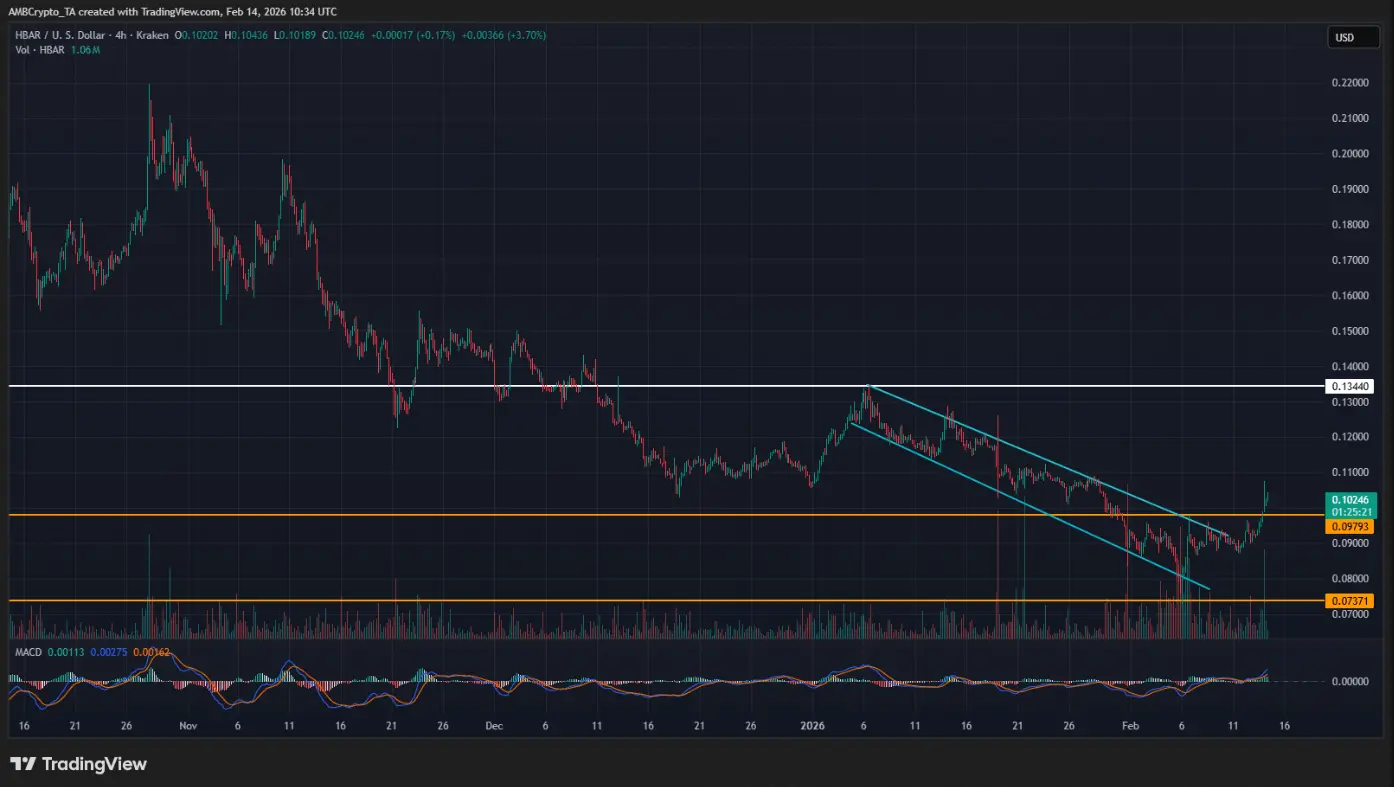 Source: TradingView Continued buying pressure pushed the price up to the $0.134 region, forming the first higher high since the downtrend ended — an important sign of a market structure shift.
Although candlestick wicks appeared, indicating rejection at this supply zone, subsequent corrections remained above the $0.097–$0.10 area. This suggests the market is reclaiming support rather than entering a new distribution phase.
Maintaining stability above the old resistance zone confirms market acceptance at the new price level, while successive higher lows reinforce a trend reversal signal on higher timeframes.
Overall, a clear breakout, the role reversal of resistance and support, along with higher highs and higher lows, indicates HBAR is completing its transition from a distribution phase to an early bullish trend formation.
Factors Amplifying HBAR’s Bullish Momentum
As the bullish structure gradually completes, trading volume and leveraged capital flows begin to accelerate, laying the groundwork for a deep recovery phase.
Hedera (HBAR) experienced a significant liquidity surge during the rebound, coinciding with FedEx — a global logistics giant — officially joining the Hedera governing council. Spot trading volume increased over 43%, surpassing $200 million, indicating fresh capital entering the market.
Simultaneously, the price rose 7%, reclaiming key moving averages. This movement acts as a confirmation signal, reflecting strong confidence from the bulls behind the rally.
Notably, demand originated from the $0.09 support zone, implying a natural, sustainable accumulation process rather than short-term speculative rotation.
From a technical perspective, the rally also aligns with an inverse head and shoulders pattern. The substantial volume increase during the neckline breakout further strengthened the reliability and durability of this pattern.
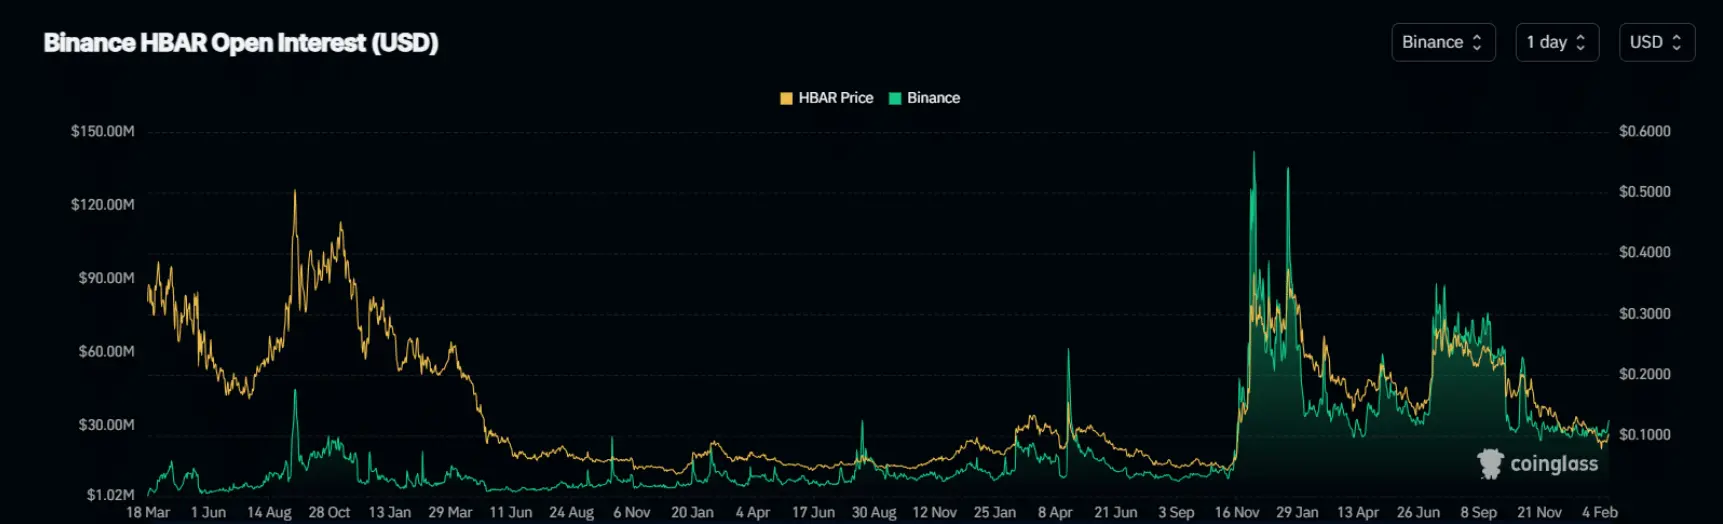 Source: CoinGlass The derivatives market continues to add to the overall picture. Open interest (OI) in futures contracts increased by 9%, approaching $29 million from February 11 to 12.
At the same time, the funding rate turned positive again, around +0.05%, indicating that leveraged long positions are becoming increasingly aggressive.
While leverage amplifies upward momentum, it also concentrates risk. Over-leveraged positioning can heighten the chance of a squeeze if prices sustain their gains, but it also makes the market more sensitive to corrections when spot demand weakens.
HBAR: Reversal Momentum Is Forming
At the time of writing, HBAR remains under selling pressure amid unfavorable macro conditions, with the price continuing to trade below the descending trendline from the $0.21 peak in November 2023.
Structurally, bears still control the market through a series of lower highs. However, positive signals are emerging as demand shows signs of returning around the $0.078 bottom, indicating selling pressure is gradually waning.
Conversely, bulls have actively increased pressure on the supply zone at $0.10–$0.104 after breaking short-term market structure within the $0.090–$0.102 range. This reflects an effort to regain short-term control.
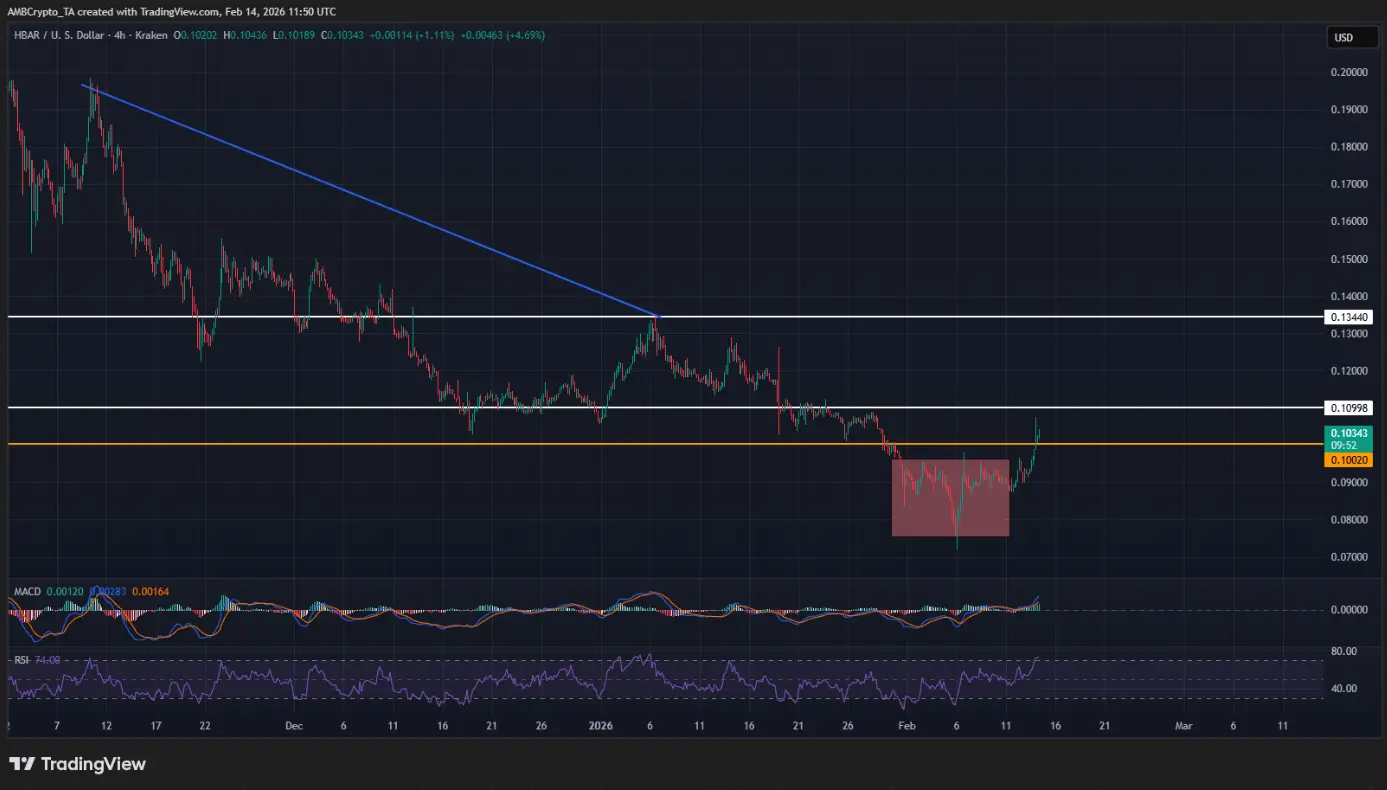 Source: TradingView If the price can sustain stable closes above the psychological $0.10 level, a bullish scenario will be reinforced, with the next target in the resistance corridor of $0.11–$0.134. Such a breakout would confirm the trend reversal structure of higher lows and higher highs.
However, persistent wicks rejection around the $0.104–$0.107 zone indicate strong supply at this level. If bears regain control and push the price back below $0.098–$0.10, the breakout attempt may be invalidated.
In that case, HBAR could enter a correction phase back toward $0.090, possibly retesting the critical demand zone at $0.078.
Overall, the current price structure faces a crucial decision point. Whether the price can successfully confirm above the supply zone will be key in determining if the reversal momentum continues to expand or gradually weakens in the near future.
SN_Nour