The PI price loses momentum of recovery amid investor profit-taking.
Pi Network is fluctuating around the $0.1750 mark at the time of this article’s publication on Saturday, after reversing from a key resistance zone, ending a fairly solid recovery that took place earlier in the week. Notably, over the past 24 hours, more than 4 million PI tokens have been transferred to centralized exchanges (CEX) compliant with Know-Your-Business (KYB), reflecting a wave of profit-taking that is increasing and exerting significant pressure on the upward momentum. From a technical perspective, the outlook for Pi Network is deteriorating as the 50-day EMA at $0.1771 is considered the “last shield”; if this level is broken, the risk of deeper weakening will become clear.
Trader profit-taking during the one-year anniversary of PI Open Network
Buying interest from Pi Network’s retail investor community is gradually cooling down, as evidenced by the increasing number of users depositing tokens onto centralized exchanges. According to data from PiScan, in just 24 hours, up to 4.37 million PI tokens have been deposited into CEX platforms. This profit-taking wave indicates that market expectations around the one-year milestone have been fully reflected in the price, just as Coin Photon previously analyzed.
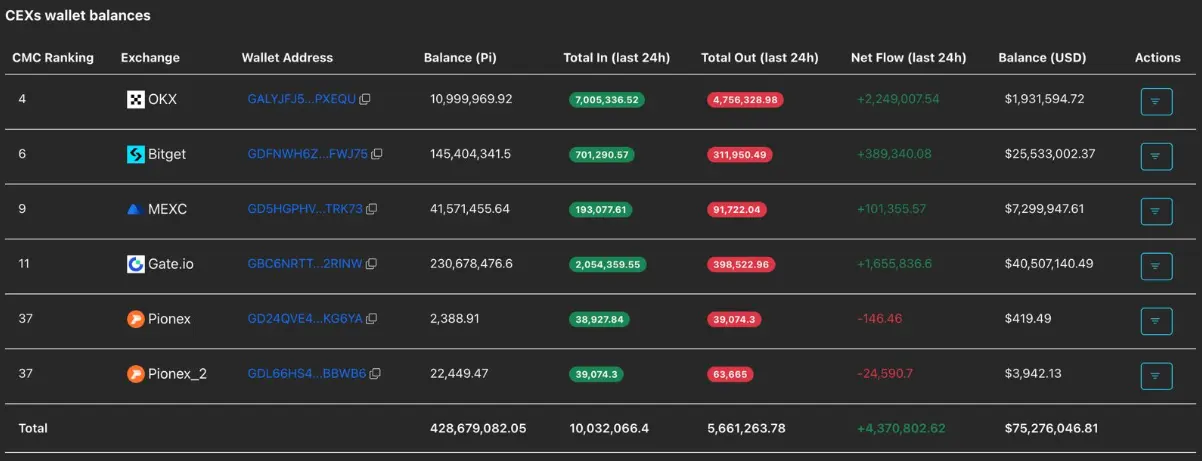 PI balance on CEX | Source: PiScan
Technical outlook: Will PI tokens fall below the 50-day EMA?
Pi Network launched a short-term recovery phase from February 12, recording an impressive increase of about 40% within a week, before moving up to test the resistance zone at $0.1919 — corresponding to the bottom formed on October 11 — during Wednesday’s trading session. However, strong supply at this level quickly halted the rally, causing the price to reverse about 5% in the next session. This movement also created a negative “evening star” candlestick pattern and pushed the price back to test the 50-day EMA around $0.1771.
Notably, the short-term high set on February 15 at $0.2070 has reinforced the role of the resistance trendline — connecting the peaks on August 30 and November 28 — which has continuously restrained the bulls’ breakout attempts over recent times.
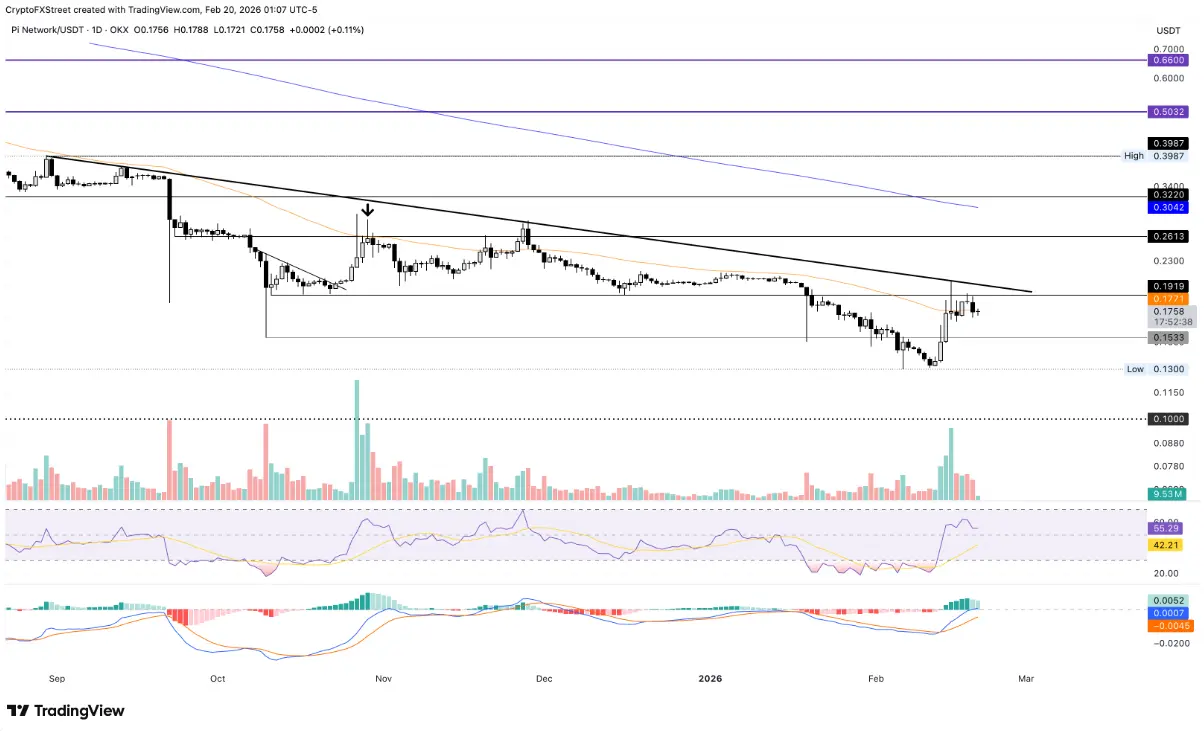 Daily PI/USDT chart | Source: TradingView
Currently, Pi Network’s price is still hovering around the 50-day EMA at the $0.177 level, indicating a clear consolidation phase. If the price cannot regain an advantage soon, the risk of a correction back to the support zone at $0.1533 remains.
Technical signals on the daily timeframe are gradually leaning towards caution. The RSI remains around 55 and moves sideways above the neutral threshold, reflecting that buying momentum is not strong enough to break out. Meanwhile, the MACD histogram continues to narrow, suggesting a high likelihood of a crossover between the two moving averages — a common indicator of impending significant volatility.
Nevertheless, an optimistic scenario has not been ruled out. If the price can rebound from the 50-day EMA and decisively break above the $0.1919 zone, selling pressure will weaken considerably, paving the way for PI to test the trendline around the $0.20 mark. If this resistance is successfully broken, the bullish trend could extend, with the next target near the September 23 low at $0.2613.
SN_Nour
Related Articles
Pi Network Marks Open Network Anniversary With New Strategy
Pi Core Team Confirms Successful Protocol v19.6 Upgrade Across the Network
Pi Network Moves to v19.9 After Successful v19.6 Migration
Pi Network Issues Upgrade Reminder to Mainnet Node Operators — Key Deadline Looms