Solana's price faces a bullish trap as 50% of holders divest
The price of Solana (SOL) has increased by 2.9% over the past 24 hours, breaking above the neckline of the inverse head and shoulders pattern on the 12-hour chart. This is a technical signal often indicating a trend reversal, offering over 50% upside potential. However, this breakout occurs amid a backdrop of strong long-term holder profit-taking, while leverage in the market is rapidly increasing. These conflicting signals raise the risk of a classic “bull trap,” where early buyers could face losses if market momentum does not sustain.
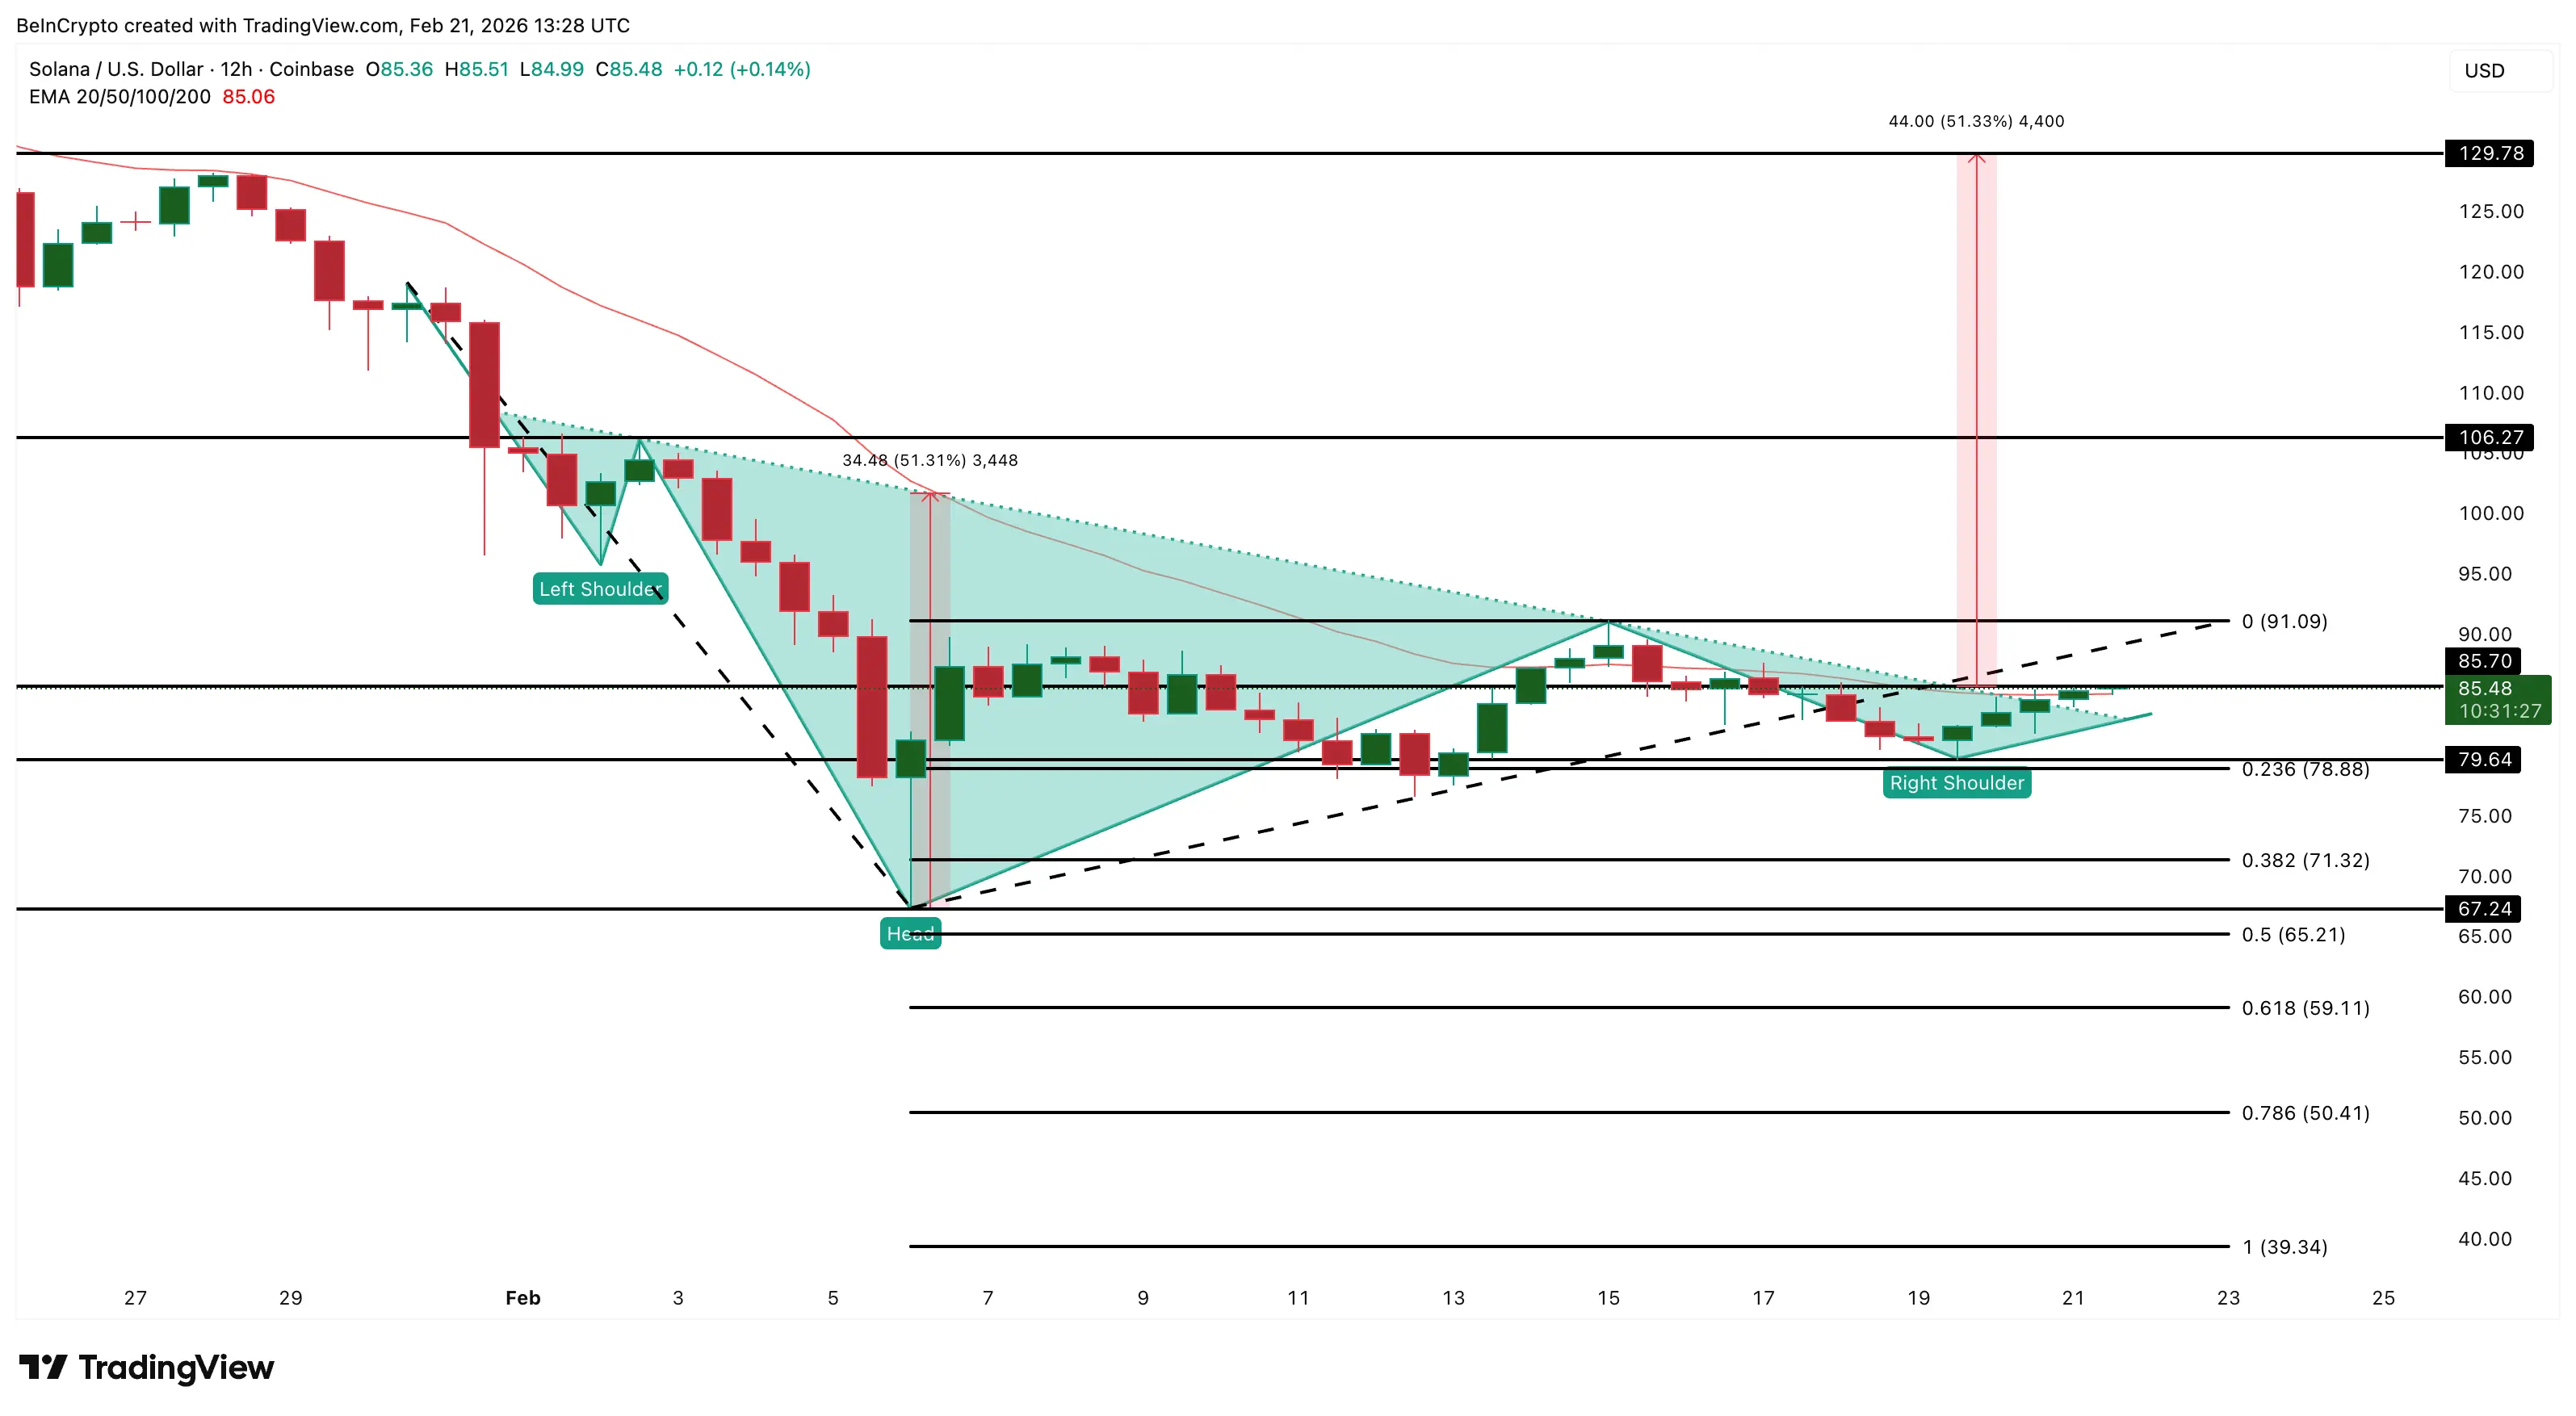
Breakout with 50% Upside Potential
Recently, SOL broke above the neckline of the inverse head and shoulders pattern—a key technical indicator. Necklines sloping downward are more prone to being broken because resistance pressure diminishes over time as sellers accept lower prices. However, this also increases the likelihood of a false breakout due to a lack of confirmation from strong resistance levels.
This breakout has also pushed Solana’s price above the 20-period exponential moving average (EMA)—an important indicator for trend strength. Typically, crossing above this EMA is seen as a sign that the bullish trend is resuming.
However, the last time SOL broke above this EMA in early February, the rally was short-lived, and the price fell nearly 12% shortly afterward.
Additionally, a hidden bearish divergence is forming between February 2 and February 21. During this period, SOL’s price made lower highs, while the relative strength index (RSI) made higher highs.
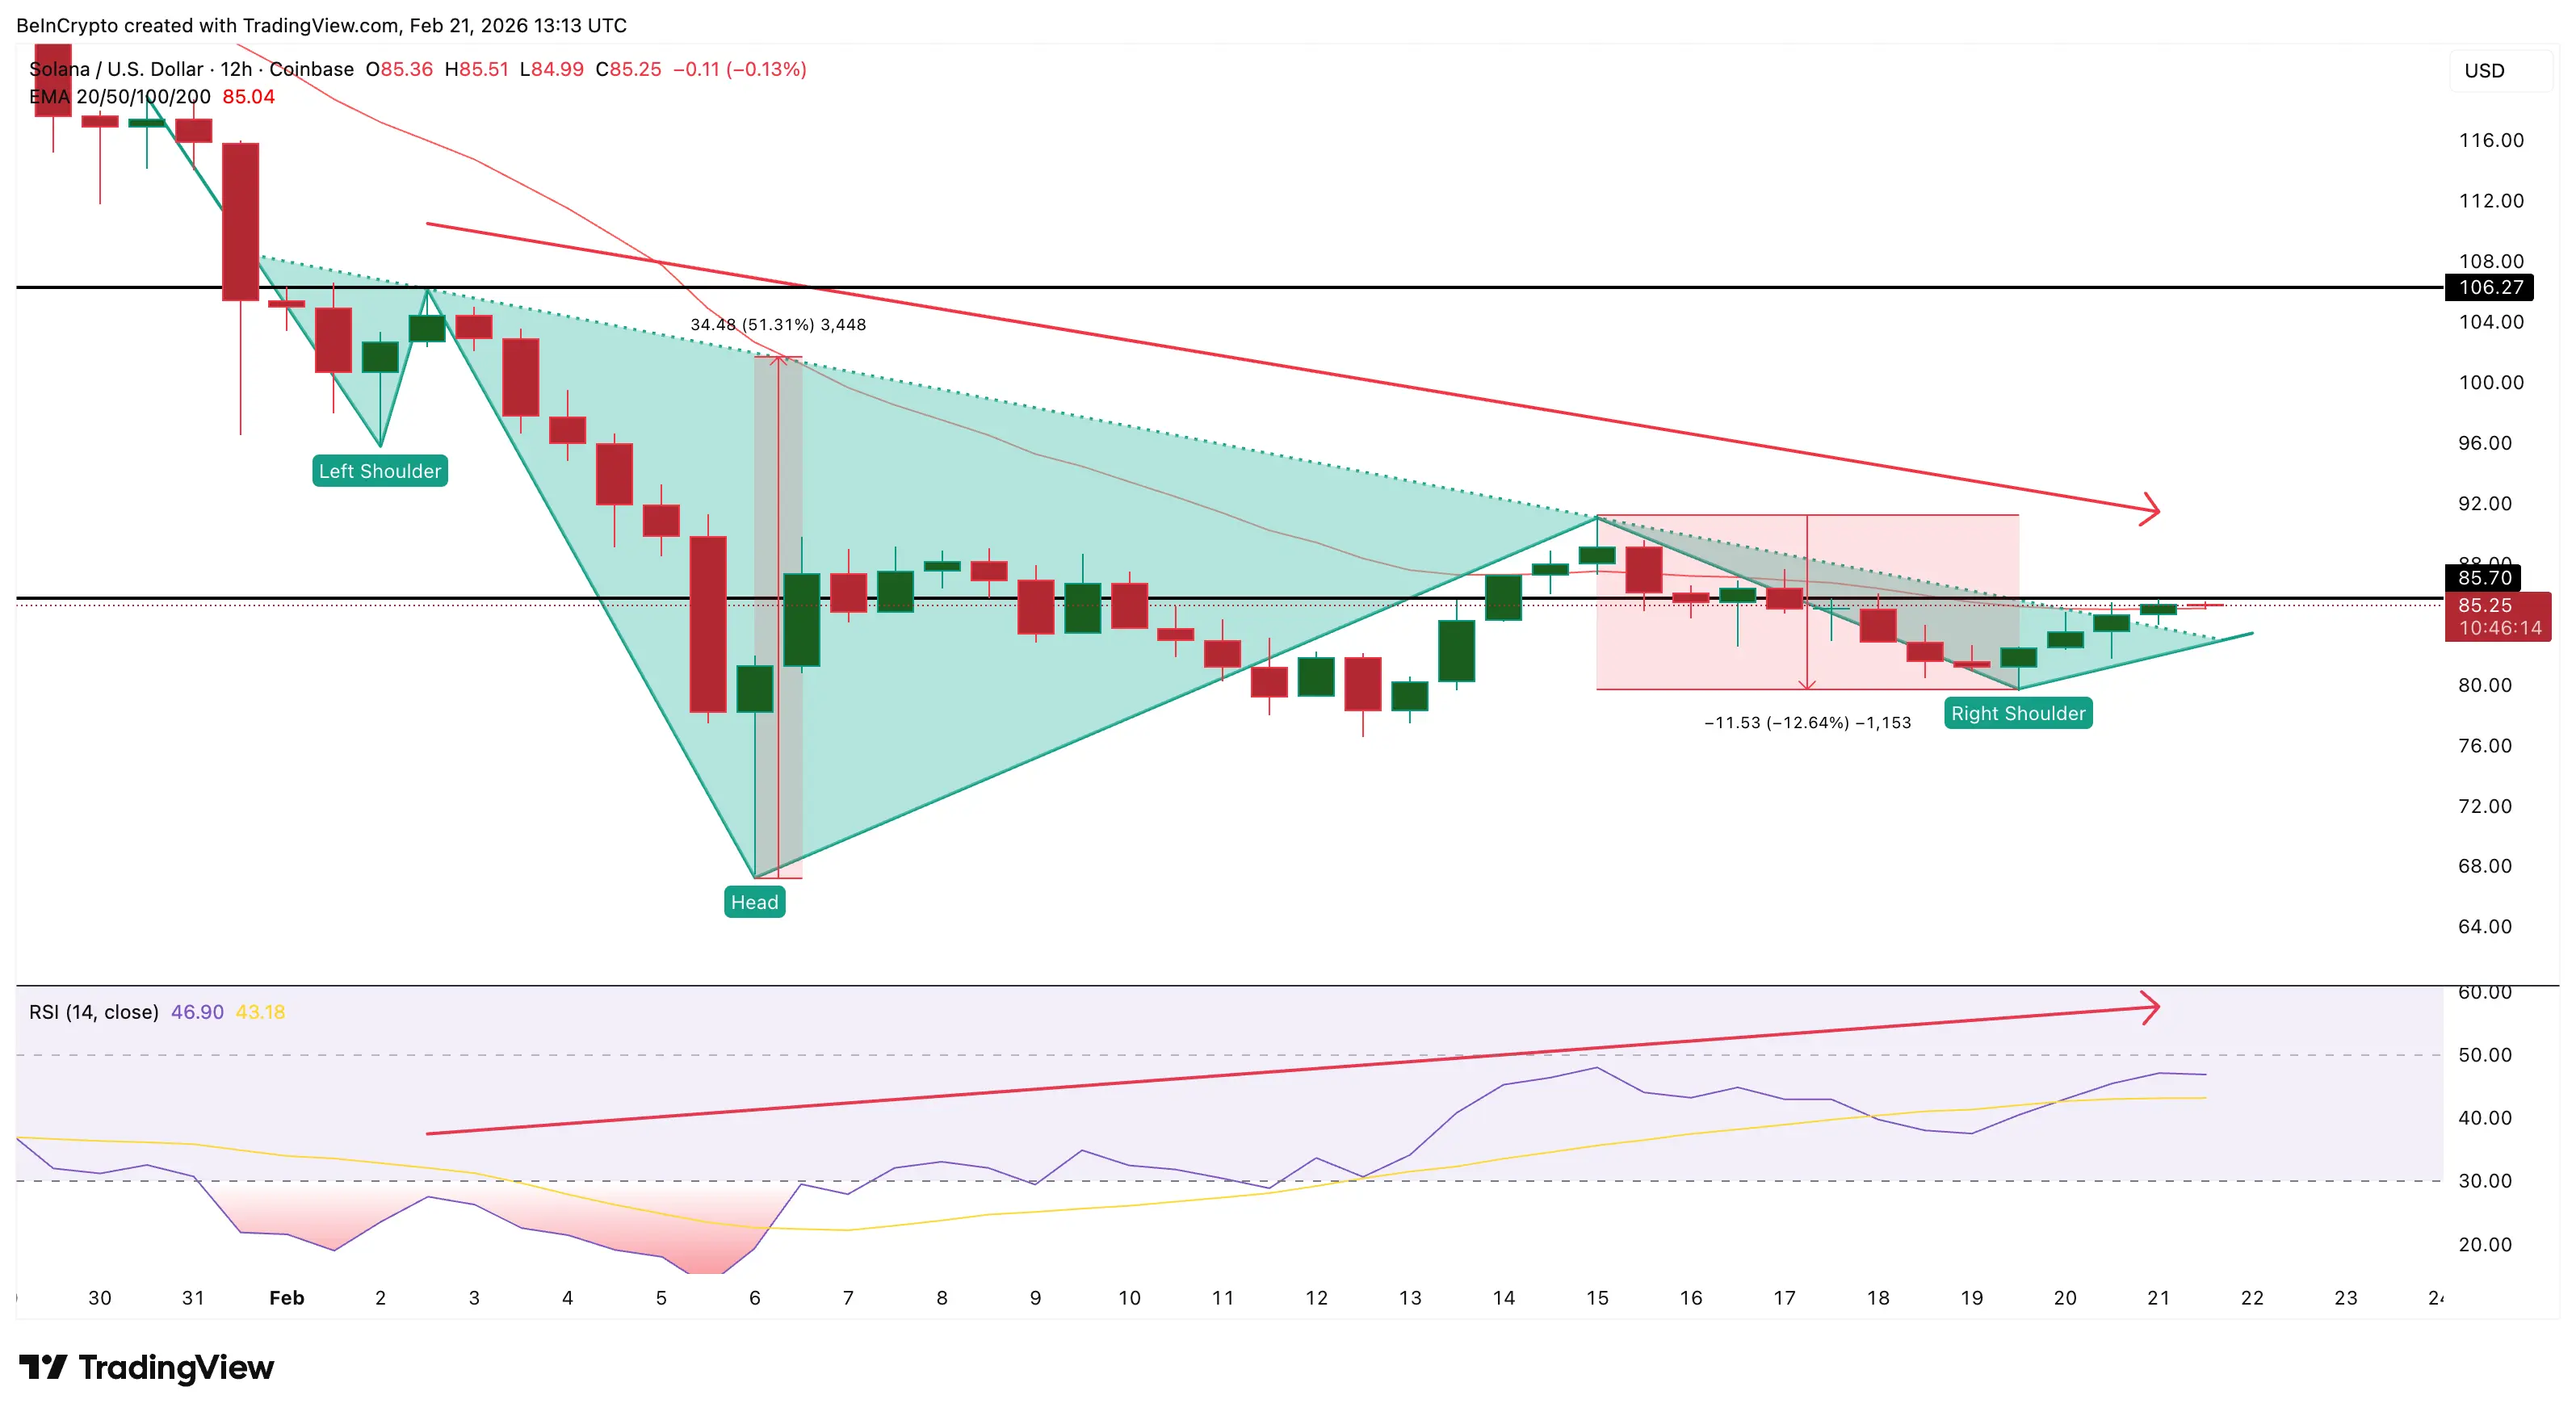 Solana Price Structure | Source: TradingView This divergence often signals weakening momentum, even when momentum indicators are rising. A similar pattern occurred from February 2 to February 15, leading to a 12% correction.
This bearish divergence will likely persist unless SOL can break above $85.70. Surpassing this level would temporarily weaken the divergence signal. However, the long-term bullish trend remains at risk until other key resistance levels are broken.
Derivatives Data Indicate Bull Trap Risks
Data from the derivatives market show traders are reacting positively to the breakout. Total open interest (OI) in active futures contracts increased from $1.96 billion on February 20 to $2.08 billion on February 21—a 6.1% rise in just one day. This suggests traders are opening new positions rather than closing existing ones.
Meanwhile, the funding rate has shifted from negative to positive, reaching 0.0016%. This metric reflects the balance between long and short traders. A positive funding rate indicates long traders are paying short traders, signaling market optimism.
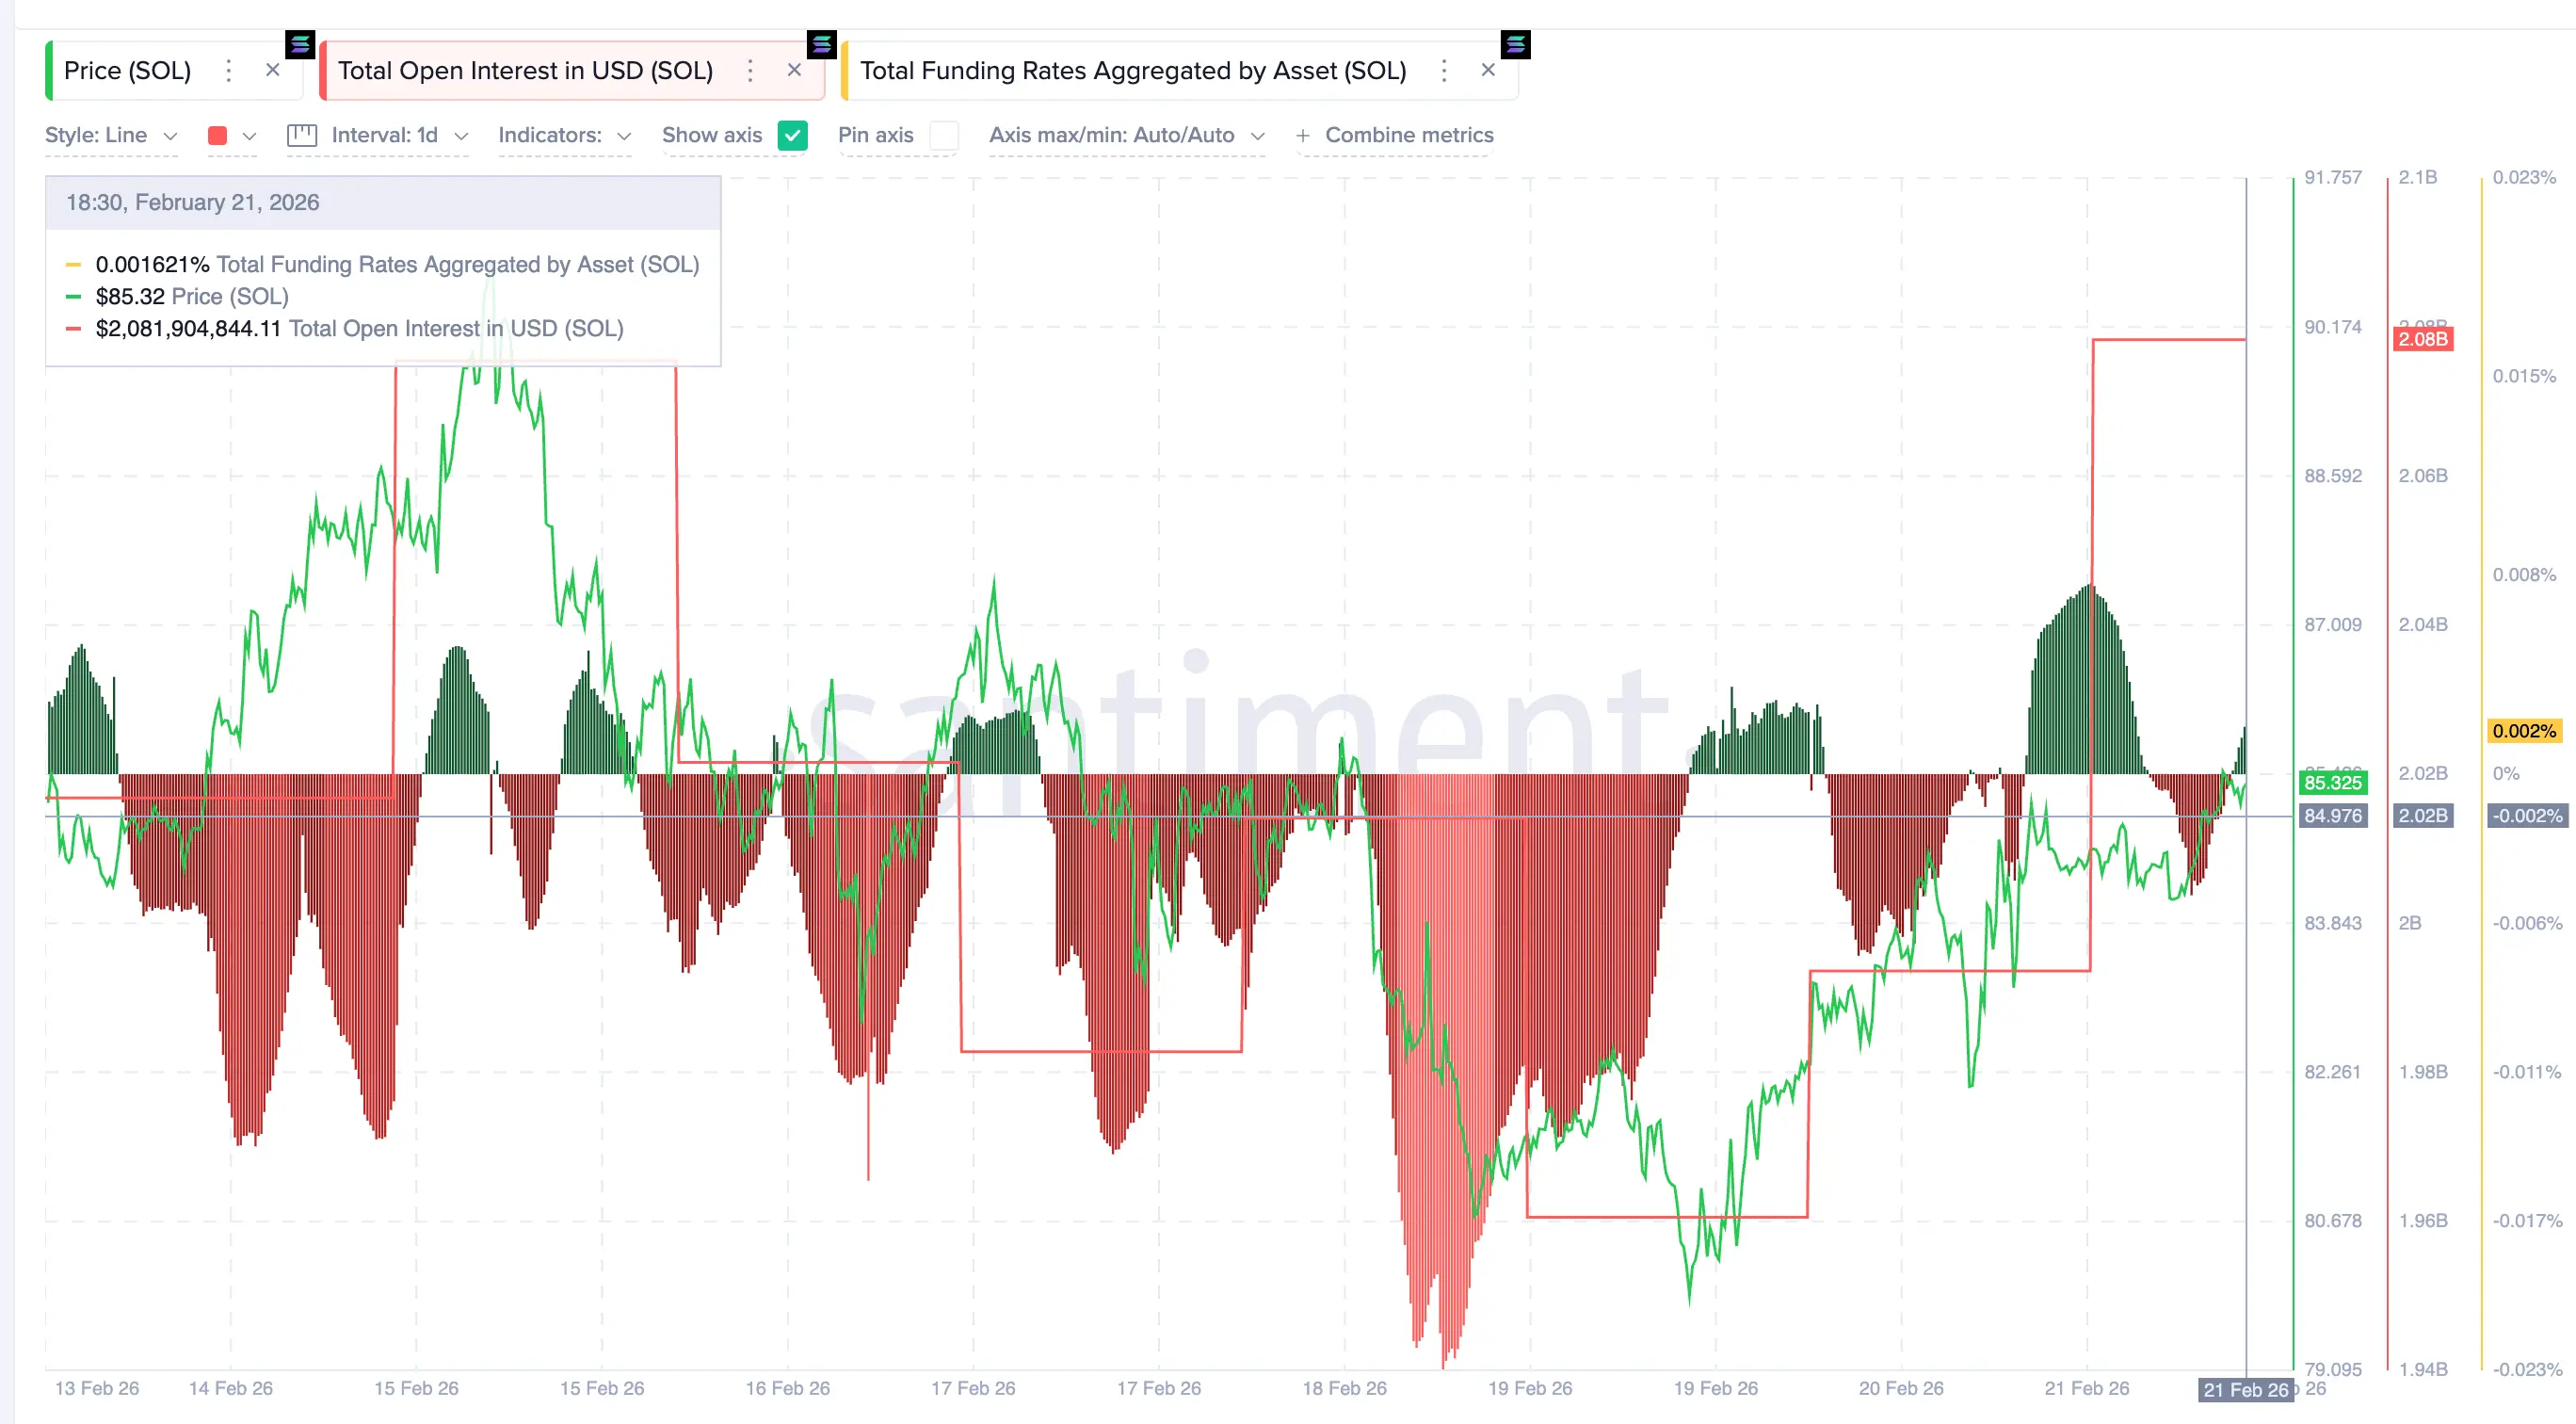 Open Interest Setup | Source: Santiment The combination of rising open interest and positive funding rate confirms traders are betting on continued price increases. However, if the breakout fails, highly leveraged investors may be forced to sell, accelerating a rapid price decline.
Long-term Holders Reduce Buying: A Critical Warning
Another notable signal comes from long-term holder behavior. The Hodler Net Position Change indicator—tracking the net change in supply held by long-term holders (over 155 days)—shows these investors are reducing their accumulation.
Specifically, on February 8, long-term holders added nearly 1.98 million SOL. By February 20, this had decreased to about 0.99 million SOL—a nearly 50% reduction.
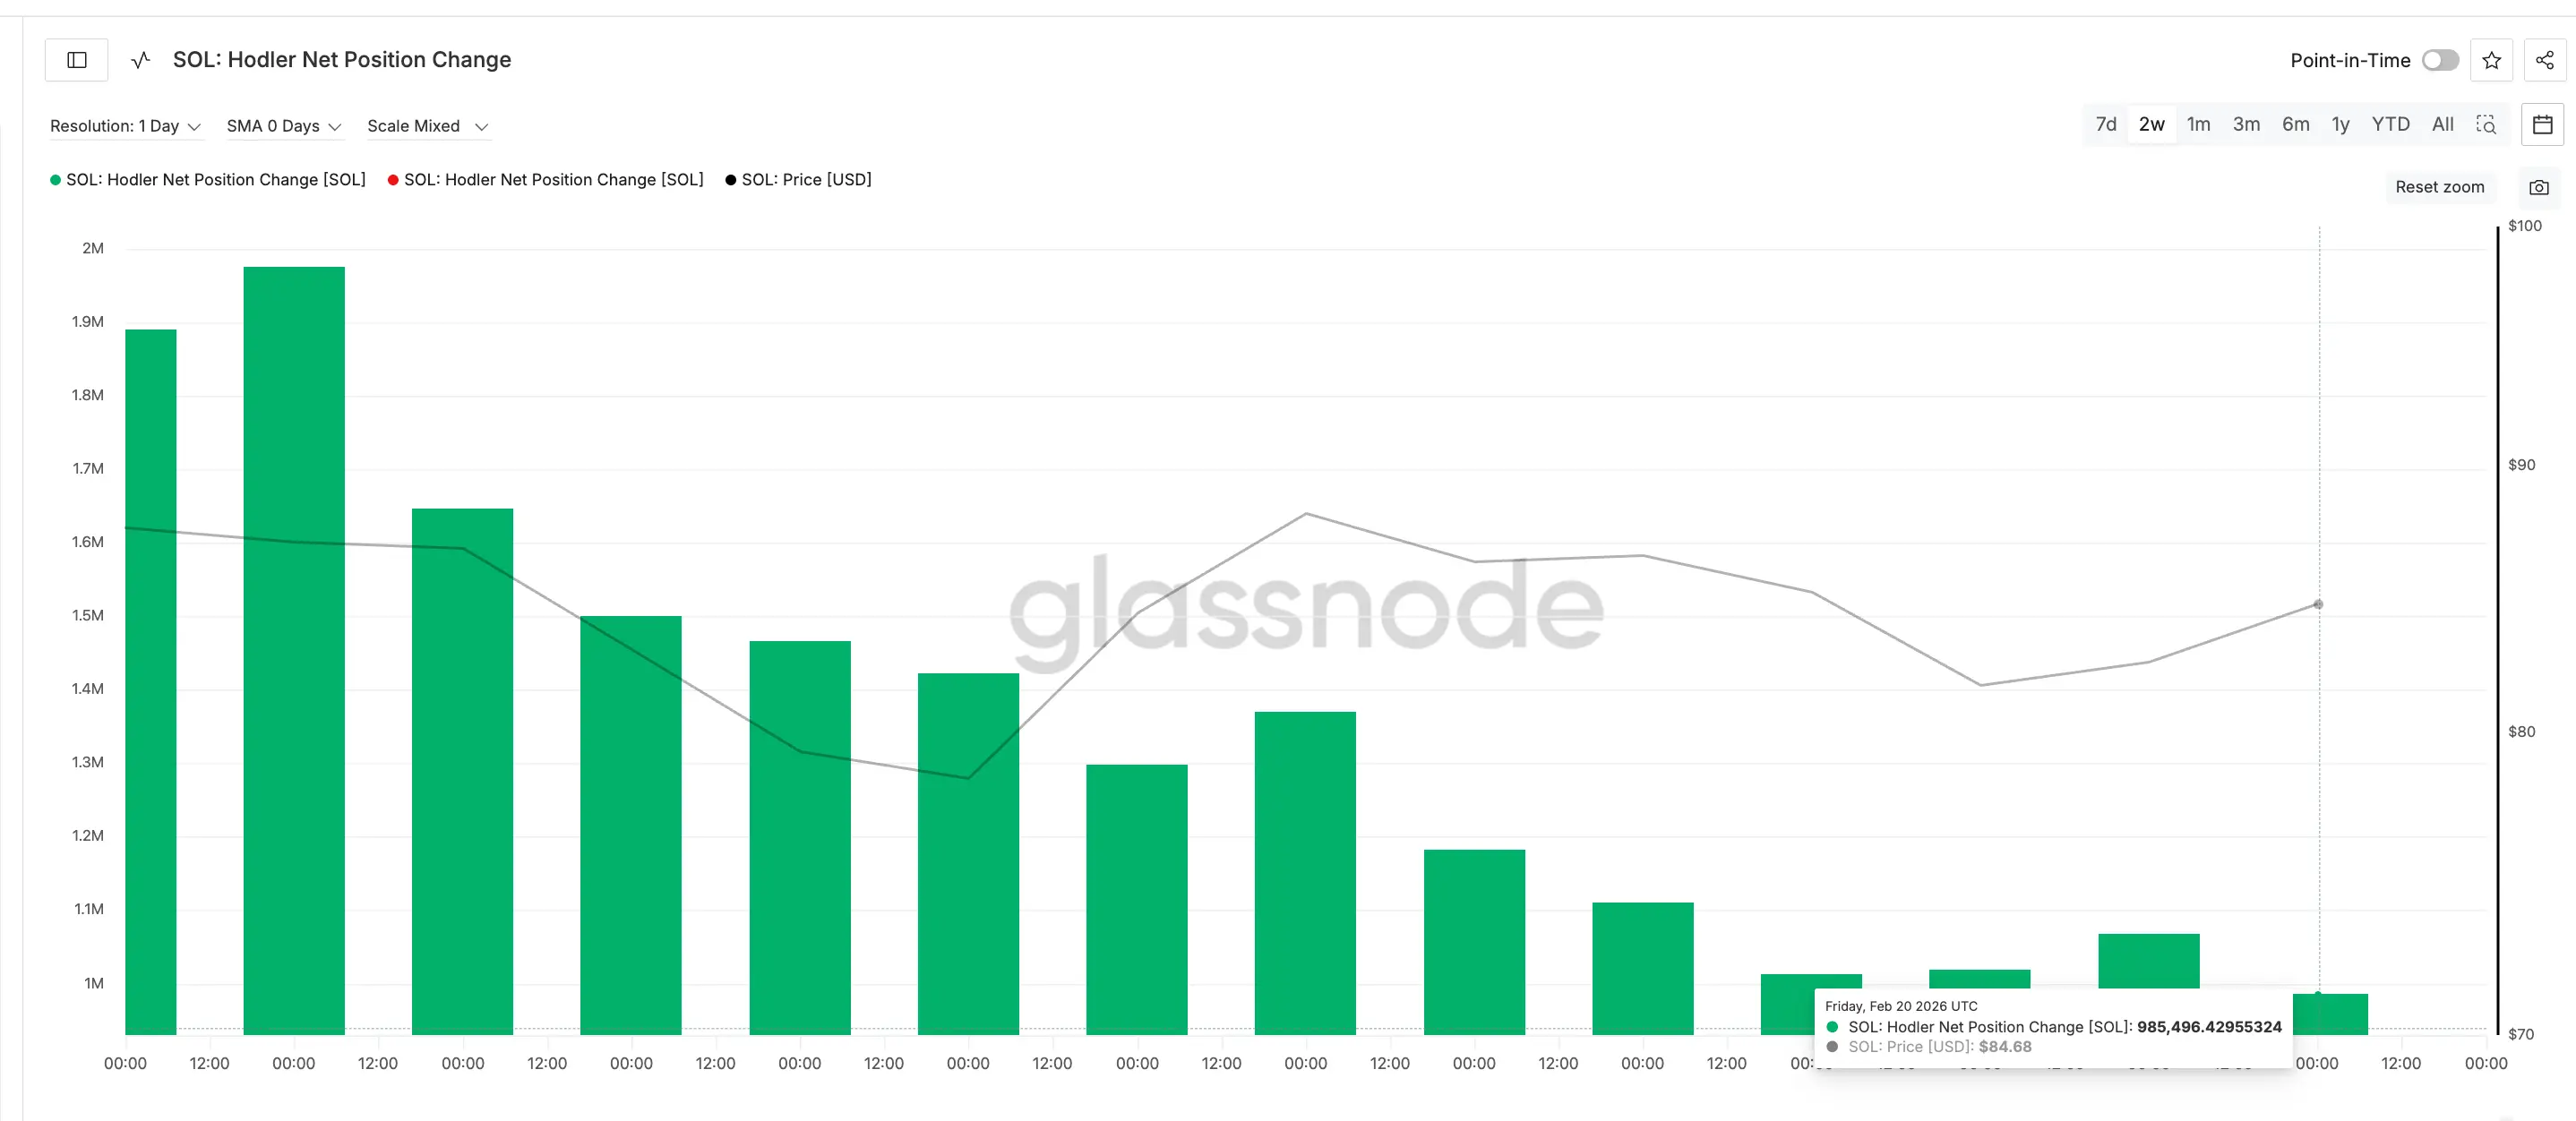 Long-term Holders Offload | Source: Glassnode This indicates long-term holders are slowing their accumulation or even beginning to sell, even as the inverse head and shoulders pattern is forming. Typically, long-term holders tend to accumulate before rallies and sell at local peaks. Their reduced accumulation or liquidation during this phase weakens the sustainability of the breakout.
Key Resistance at $91
Data from the Cost Basis Heatmap shows the price levels where investors previously bought Solana. These zones often act as strong resistance because investors tend to sell when the price reaches their break-even point.
The strongest cluster currently lies between $87 and $88, where approximately 9.12 million SOL have been accumulated. This creates immediate resistance.
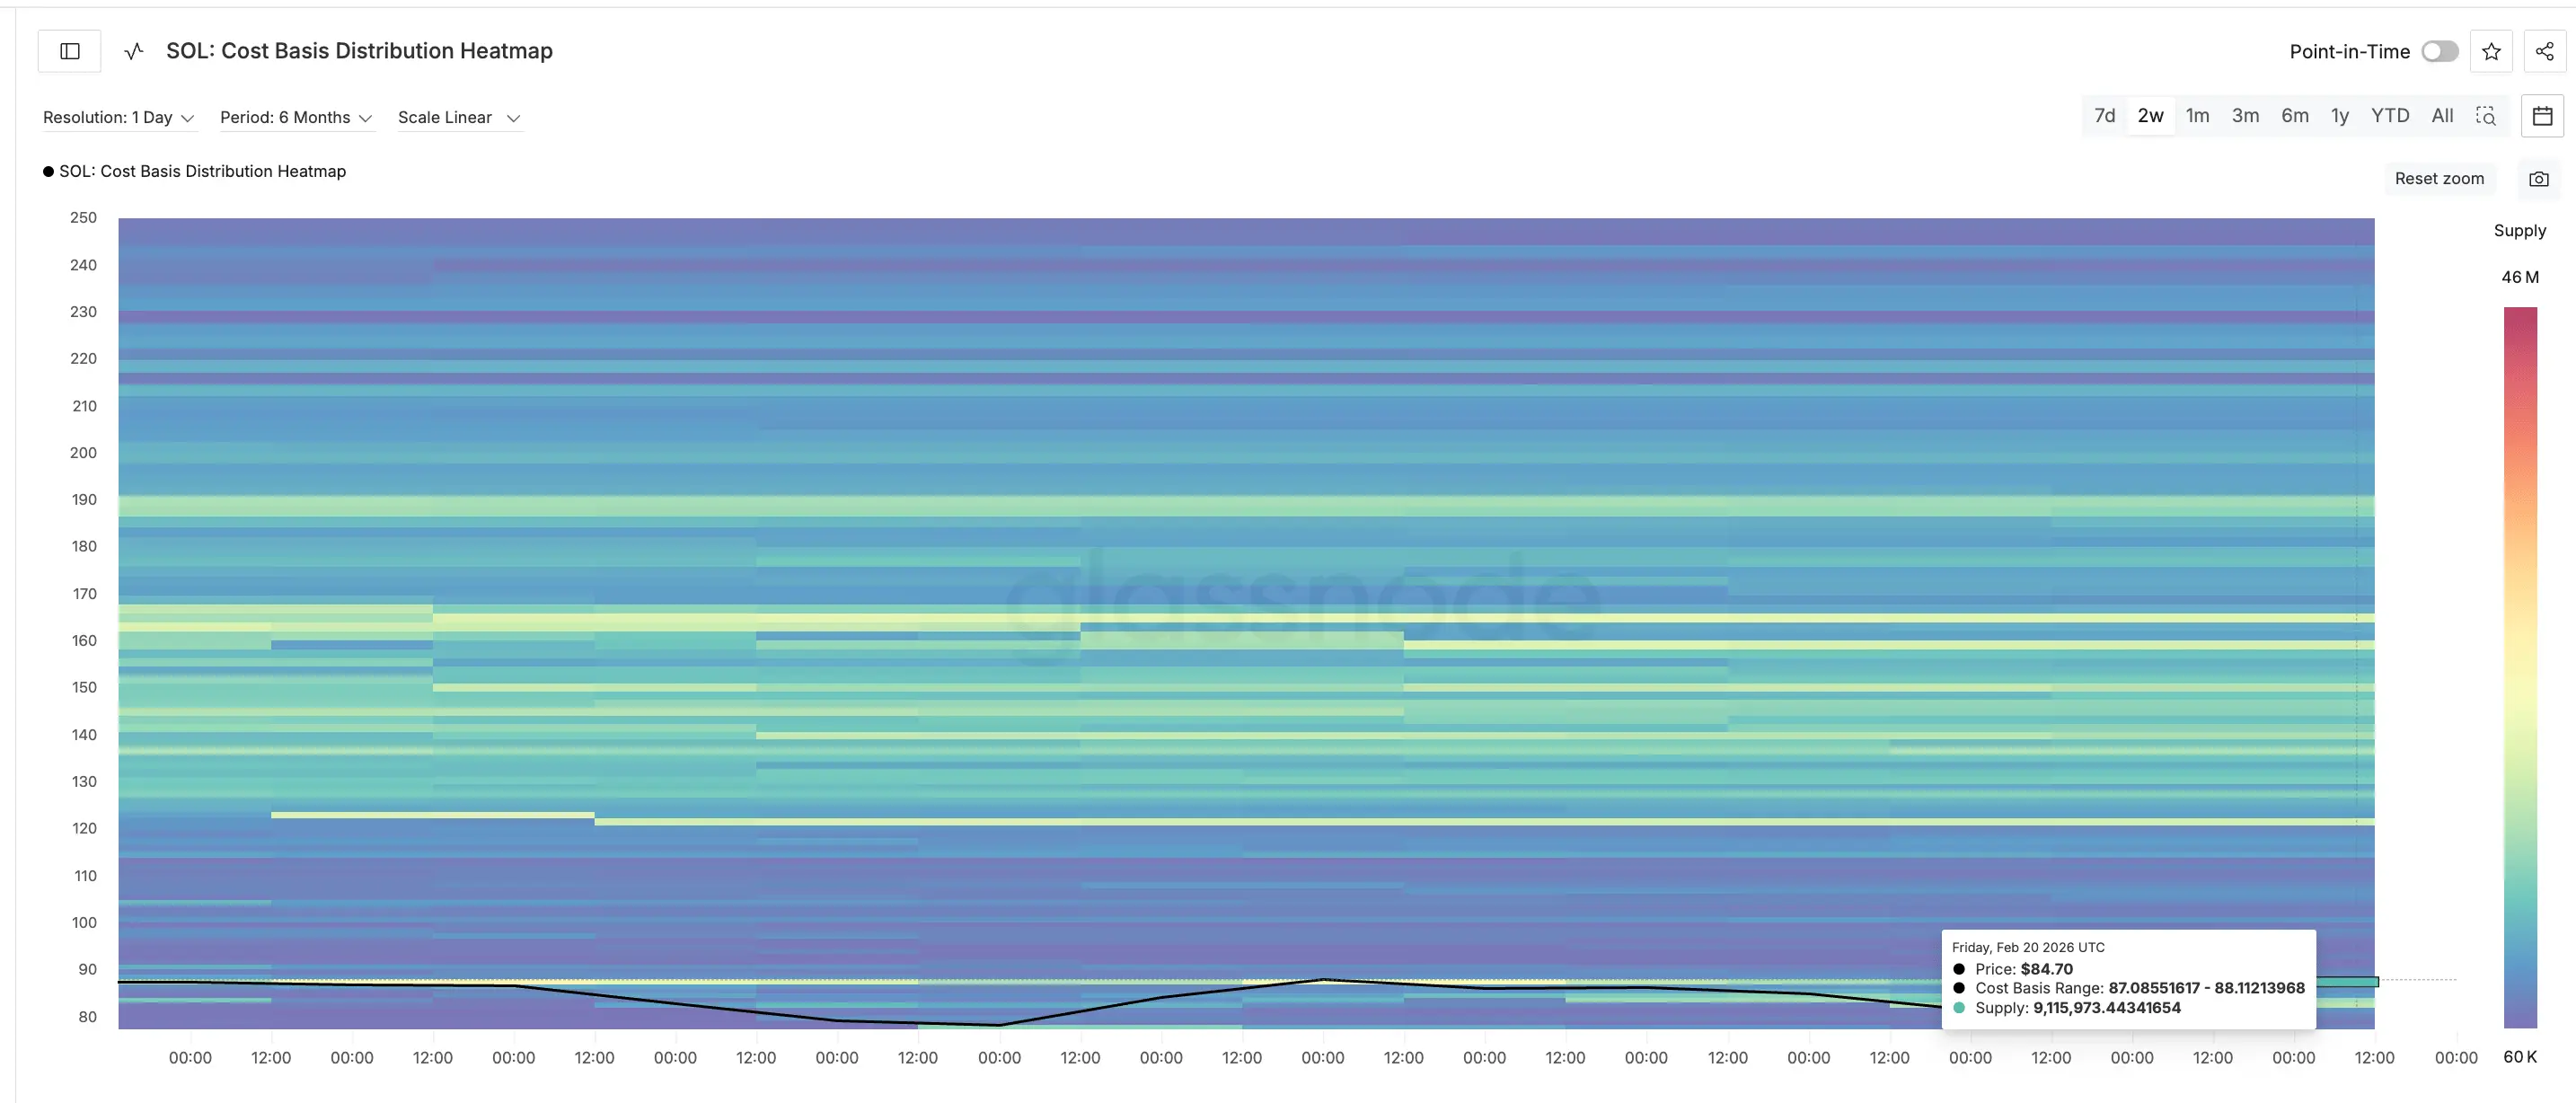 Cost Basis Heatmap | Source: Glassnode Surpassing the $85.70 threshold is an important first step, weakening the hidden bearish divergence and confirming the breakout. However, a more significant resistance level is at $91.09. If SOL can break above this, it will absorb excess supply and confirm that buyers are strong enough to sustain the rally, avoiding profit-taking at break-even levels.
If SOL surpasses $91.09, the next target for the inverse head and shoulders pattern is $129.78—about a 50% increase from the current breakout level.
Risks and Opportunities
While SOL’s upside potential is substantial, downside risks are also significant. If the price drops below $78.88, the inverse head and shoulders pattern will weaken, and the breakout will likely fail. A further decline below $67.24 would invalidate the pattern entirely, potentially triggering large liquidation events due to increased leverage.
 Solana Price Analysis | Source: TradingView Currently, SOL is at a critical juncture. The 6.1% rise in OI, shift to positive funding, and 50% reduction in long-term supply all point to conflicting market signals.
Breaking above $91 confirms a breakout and opens the path toward $129. Falling below $78 increases the risk of a bull trap. Falling below $67 confirms the breakout has completely failed.
Related Articles
X Product Manager: Will utilize all tools to combat bots and undisclosed AI accounts, ensuring the authenticity of the "Global Square"
Solana at risk of a plunge: Why hasn't SOL's bottom yet revealed itself?
A whale sold 50,000 SOL in the past 7 hours and exchanged 44,805 SOL for XAUT.
Data: SOL spot ETF had a net inflow of $14.31 million last week
DFlow Launches Universal MCP – Bridging AI Agents and Solana’s High-Performance Trading Infrastru...