Here’s Why Pippin (PIPPIN) Price Pumped 30%

Pippin is seeing a strong move today. The PIPPIN price is up more than 30% at writing, trading around $0.6649. Trading volume has jumped over 80%, and the token is the top gainer in the market. This is not a quiet move, it came with strong activity behind it.
The main driver appears to be heavy capital inflow. Volume surged to roughly $73.3 million in 24 hours, up more than 92%. That kind of turnover, nearly 11% of its market cap, shows real money stepped in.
This was not a low-volume spike. This jump wasn’t empty. Real buying showed up in the spot market, and that’s what pushed price higher. When price and volume rise together, it shows that traders are actually stepping in, not just watching from the sidelines.
If this run is going to hold, activity needs to stay strong. If trading slows down, the momentum can fade just as quickly.
If trading activity holds above the $50 million range, it would show that interest is still there. If volume fades quickly, the rally could cool just as fast.
What the PIPPIN Chart Is Showing
On the 4H chart, PIPPIN had been trading sideways for weeks after pulling back from its previous highs.
The PIPPIN Price built a base in the lower range before breaking out sharply. The recent move pushed it back toward the $0.66–$0.68 area, which is close to prior local highs.
Price spent weeks moving sideways, then suddenly broke out of that range. After the drop near $0.30 earlier this month, buyers came in hard and haven’t really stepped away.
Since then, the move has been building step by step. The latest breakout looks like the next leg of that recovery.
_****Here are 6 Ultra Growth Stocks for 2026**
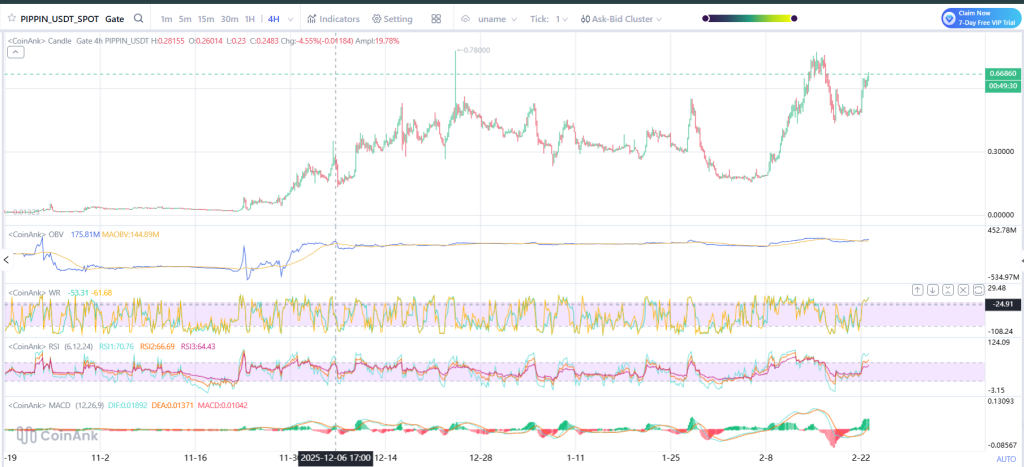
Source: Coinank
What the Indicators Say
OBV is rising, which means buying pressure has increased compared to earlier weeks. That supports the price action.
The RSI is now elevated, sitting in the higher range, which shows strong momentum. At the same time, it warns that the token may be stretched in the short term.
MACD has flipped positive with green histogram bars printing again. That shows upward momentum is gaining pace. If these indicators stay aligned and volume remains strong, the PIPPIN price could try to hold its breakout.
For now, this rally is backed by real activity. The next few sessions will show whether buyers keep control or if traders start taking profits after the sharp 30% run.
Related Articles
PIPPIN Surges Past $0.76 — $0.8472 Break or Pullback to $0.6715 Next?
PEPE Holds $0.053796 Support After 12% Drop Amid $580M Trading Spike
VIRTUAL Surges 23% After Channel Break — Can $0.7168 Turn Support?
Breakout Pushes $0.09656 DOGE Above Converging Trendlines as Price Trades Between Key Levels
HBAR Consolidates at $0.095 as Critical $0.094–$0.096 Zone Draws Focus