Top 3 altcoins with notable trends today - February 25
Over the past 24 hours, altcoins like Morpho (MORPHO), Ether.fi (ETHFI), and Pippin (PIPPIN) have led the market rally despite overall cryptocurrency market pressures. From a technical perspective, the rebound of MORPHO, ETHFI, and PIPPIN is signaling positive momentum, with increasing buying activity and hopes for an upward trend in the near future.
Morpho Extends Gains After Breaking Trendline
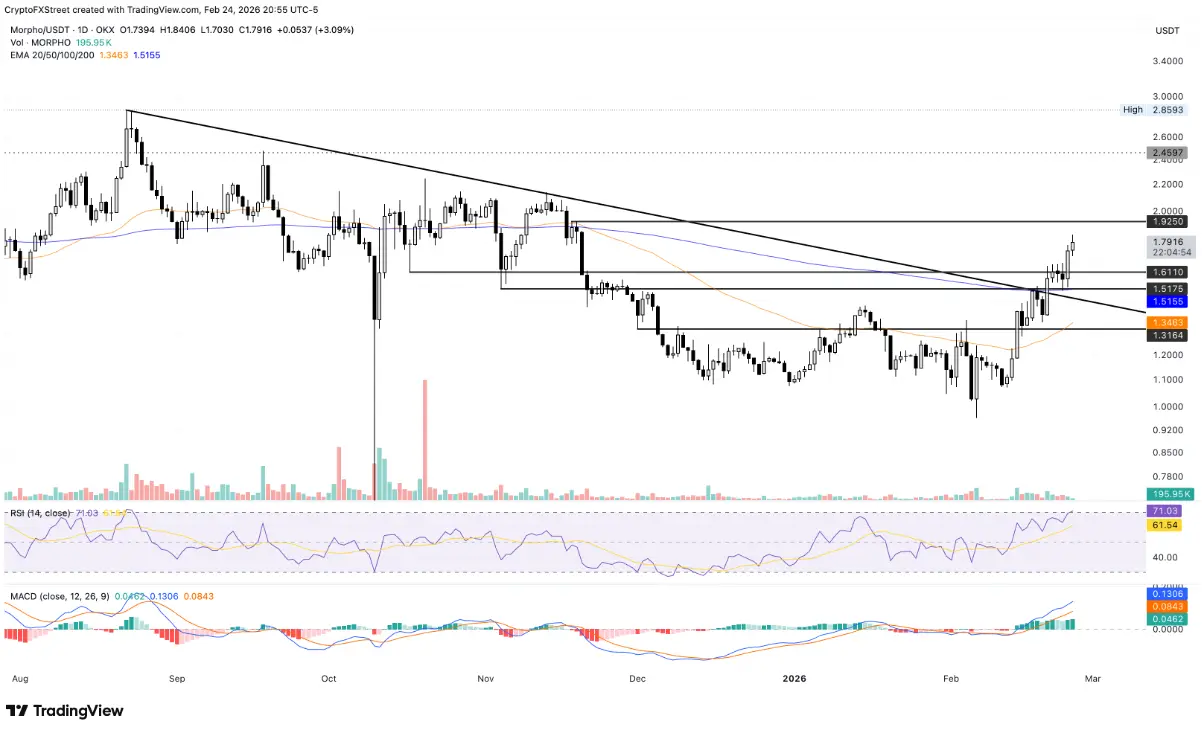
Morpho maintains impressive bullish momentum after successfully breaking above a resistance line on the daily logarithmic chart — connecting two significant peaks formed on 8/22 and 11/13. At the time of writing, Morpho’s price increased by 3% on Wednesday, following a strong 10% recovery from the 200-day exponential moving average (EMA) in the previous session.
The current rally is heading directly toward the resistance zone at $1.9250, matching the peak set on 11/18. If the price can decisively close above this level, a bullish extension toward the $2 psychological level — a key resistance — is highly plausible.
Notably, Morpho is trading well above both the 50-day and 200-day EMAs. The upward slope of these moving averages suggests the potential formation of a Golden Cross — a technical signal often confirming a bullish trend when short-term momentum surpasses long-term trends.
 Daily MORPHO/USDT Chart | Source: TradingView
Technical indicators on the daily chart continue to favor the bulls. The RSI has risen to 71, entering overbought territory amid increased buying pressure. Meanwhile, the MACD remains in an upward trend relative to its signal line, with the histogram expanding positively, reflecting strengthening bullish momentum.
Daily MORPHO/USDT Chart | Source: TradingView
Technical indicators on the daily chart continue to favor the bulls. The RSI has risen to 71, entering overbought territory amid increased buying pressure. Meanwhile, the MACD remains in an upward trend relative to its signal line, with the histogram expanding positively, reflecting strengthening bullish momentum.
On the downside, the October 17 low at $1.6110 and the 200-day EMA around $1.5152 serve as important support levels, acting as a “shield” for the current uptrend.
Ether.fi Rebounds After Short-Term Accumulation
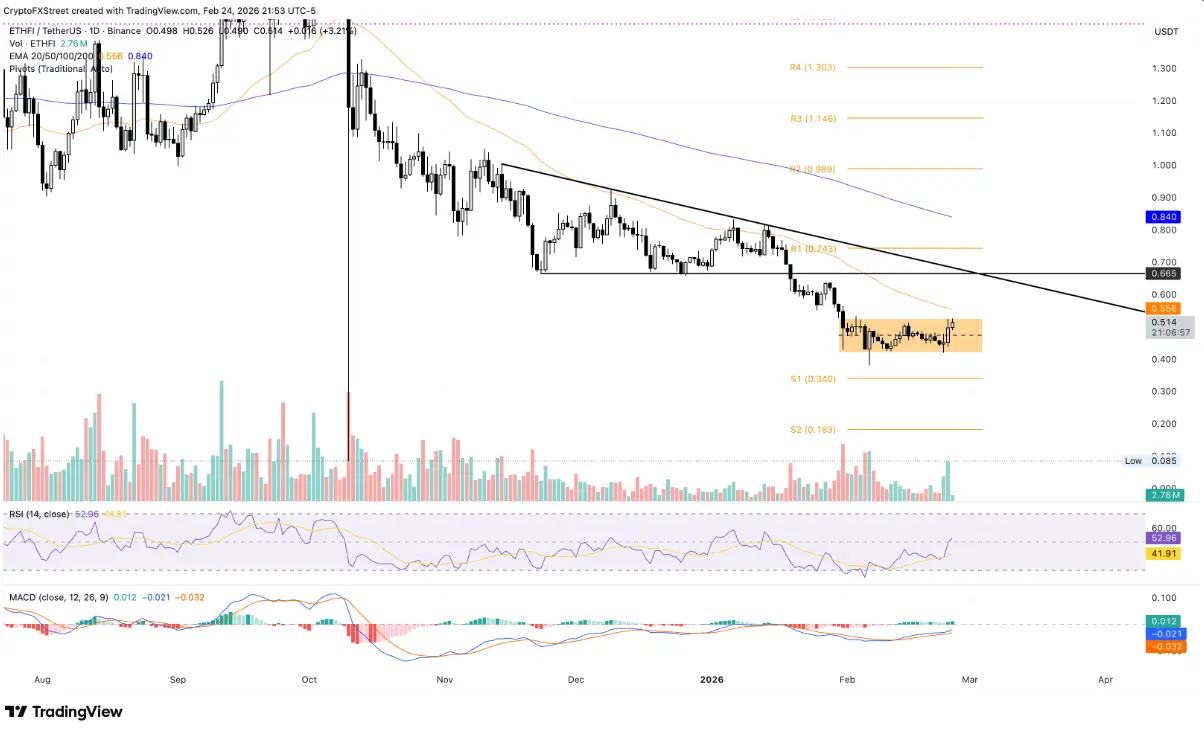
ETHFI has surged by 3%, breaking above the psychological $0.500 mark as of Wednesday, marking three consecutive days of gains. The recovery is approaching the upper resistance of the short-term accumulation zone, defined between $0.420 and $0.527.
If the price can decisively close above $0.527, the breakout of the accumulation zone will be confirmed, paving the way for ETHFI to target the 50-day EMA at $0.556. Successfully crossing this moving average could push the price toward the $0.665 zone — a former support now turned resistance, coinciding with the downward trendline connecting peaks formed on 11/14 and 1/14.
 Daily ETHFI/USDT Chart | Source: TradingView
Momentum-wise, the daily RSI is at 52, crossing above the neutral line, indicating buying pressure is gradually gaining strength. Simultaneously, the MACD is showing a bullish divergence from its signal line, with the histogram expanding positively, reinforcing the upward trend.
Daily ETHFI/USDT Chart | Source: TradingView
Momentum-wise, the daily RSI is at 52, crossing above the neutral line, indicating buying pressure is gradually gaining strength. Simultaneously, the MACD is showing a bullish divergence from its signal line, with the histogram expanding positively, reinforcing the upward trend.
In a negative scenario, a daily close below the support at $0.420 would suggest persistent selling pressure, increasing the likelihood of ETHFI retreating back into the critical support zone.
Pippin’s Recovery Stalls Near Key Resistance
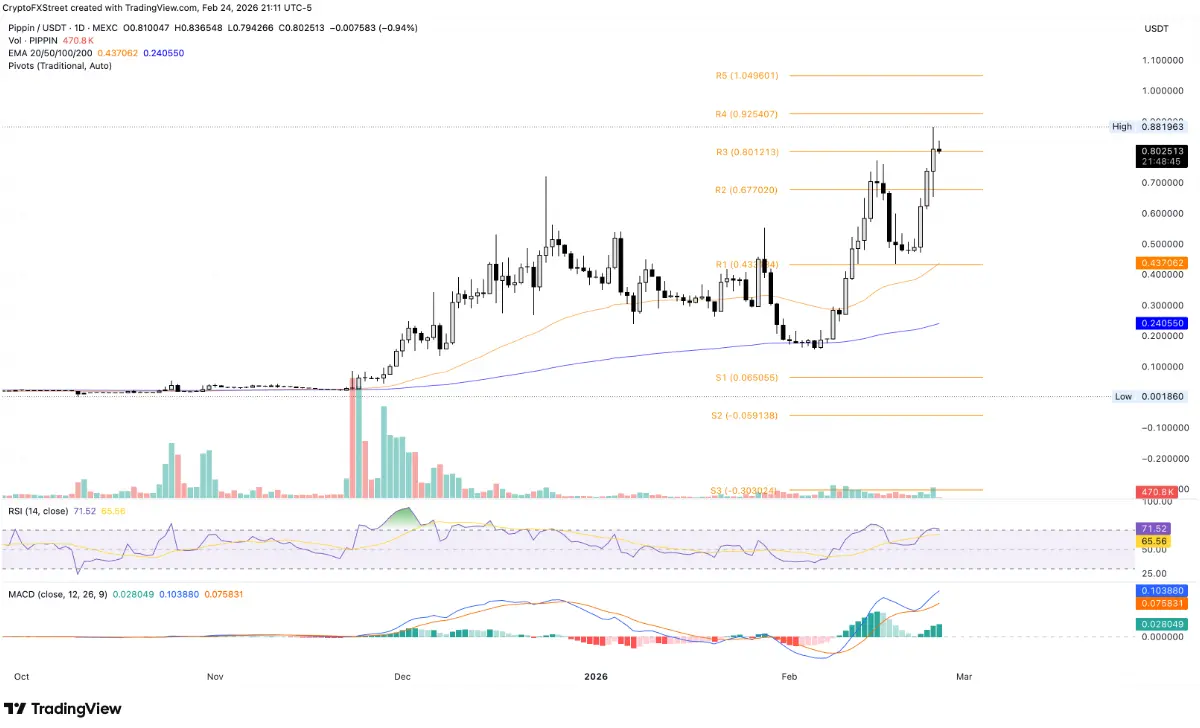
PIPPIN has completed a U-shaped reversal pattern on the daily timeframe, originating from the R1 pivot at around $0.4331. This signals a strong rally over four consecutive sessions since Saturday, with a cumulative increase of approximately 70%. Currently, PIPPIN’s price is holding firmly above the R3 pivot at $0.8012.
The steady recovery provides a foundation for potential upward movement toward the next target at the R4 pivot near $0.9250, and possibly challenging the important psychological level at $1.
 Daily PIPPIN/USDT Chart | Source: TradingView
In terms of trend, both the 50-day and 200-day EMAs are clearly rising, supporting the view that the bullish trend remains dominant. The RSI is at 71, in overbought territory but still reflecting strong buying interest. The MACD continues to stay above its signal line, with the histogram expanding positively, indicating sustained bullish momentum.
Daily PIPPIN/USDT Chart | Source: TradingView
In terms of trend, both the 50-day and 200-day EMAs are clearly rising, supporting the view that the bullish trend remains dominant. The RSI is at 71, in overbought territory but still reflecting strong buying interest. The MACD continues to stay above its signal line, with the histogram expanding positively, indicating sustained bullish momentum.
However, investors should remain cautious: if the daily candle closes clearly below $0.8012, selling pressure could re-emerge, potentially pulling PIPPIN back toward the nearest support at the R2 pivot around $0.6770.