Analyst: Bitcoin Hash Ribbon Rebound "Bottom Signal Emerges," Longest Miner Capitulation in History Nears the End
CoinDesk senior analyst James Van Straten points out that Bitcoin has experienced the longest miner capitulation in history. As the Hash Ribbon approaches a golden cross, multiple indicators suggest the market has entered a deep value zone, and the darkest decline may be over.
(Background: Michael Saylor: Bitcoin’s 45% retracement is like Apple’s “Valley of Despair”)
(Additional context: Female investor Cathie Wood: Bitcoin is “undoubtedly” superior to gold and has more structural advantages in the modern financial system)
After a three-month period of volatility and decline, Bitcoin (BTC) is showing key reversal signals. According to data from on-chain analytics firm Glassnode, cited by CoinDesk senior analyst James Van Straten, the Hash Ribbon indicator is recovering, indicating that the longest miner capitulation phase since November last year may be ending. Historical data shows that such signals often precede market bottoms.
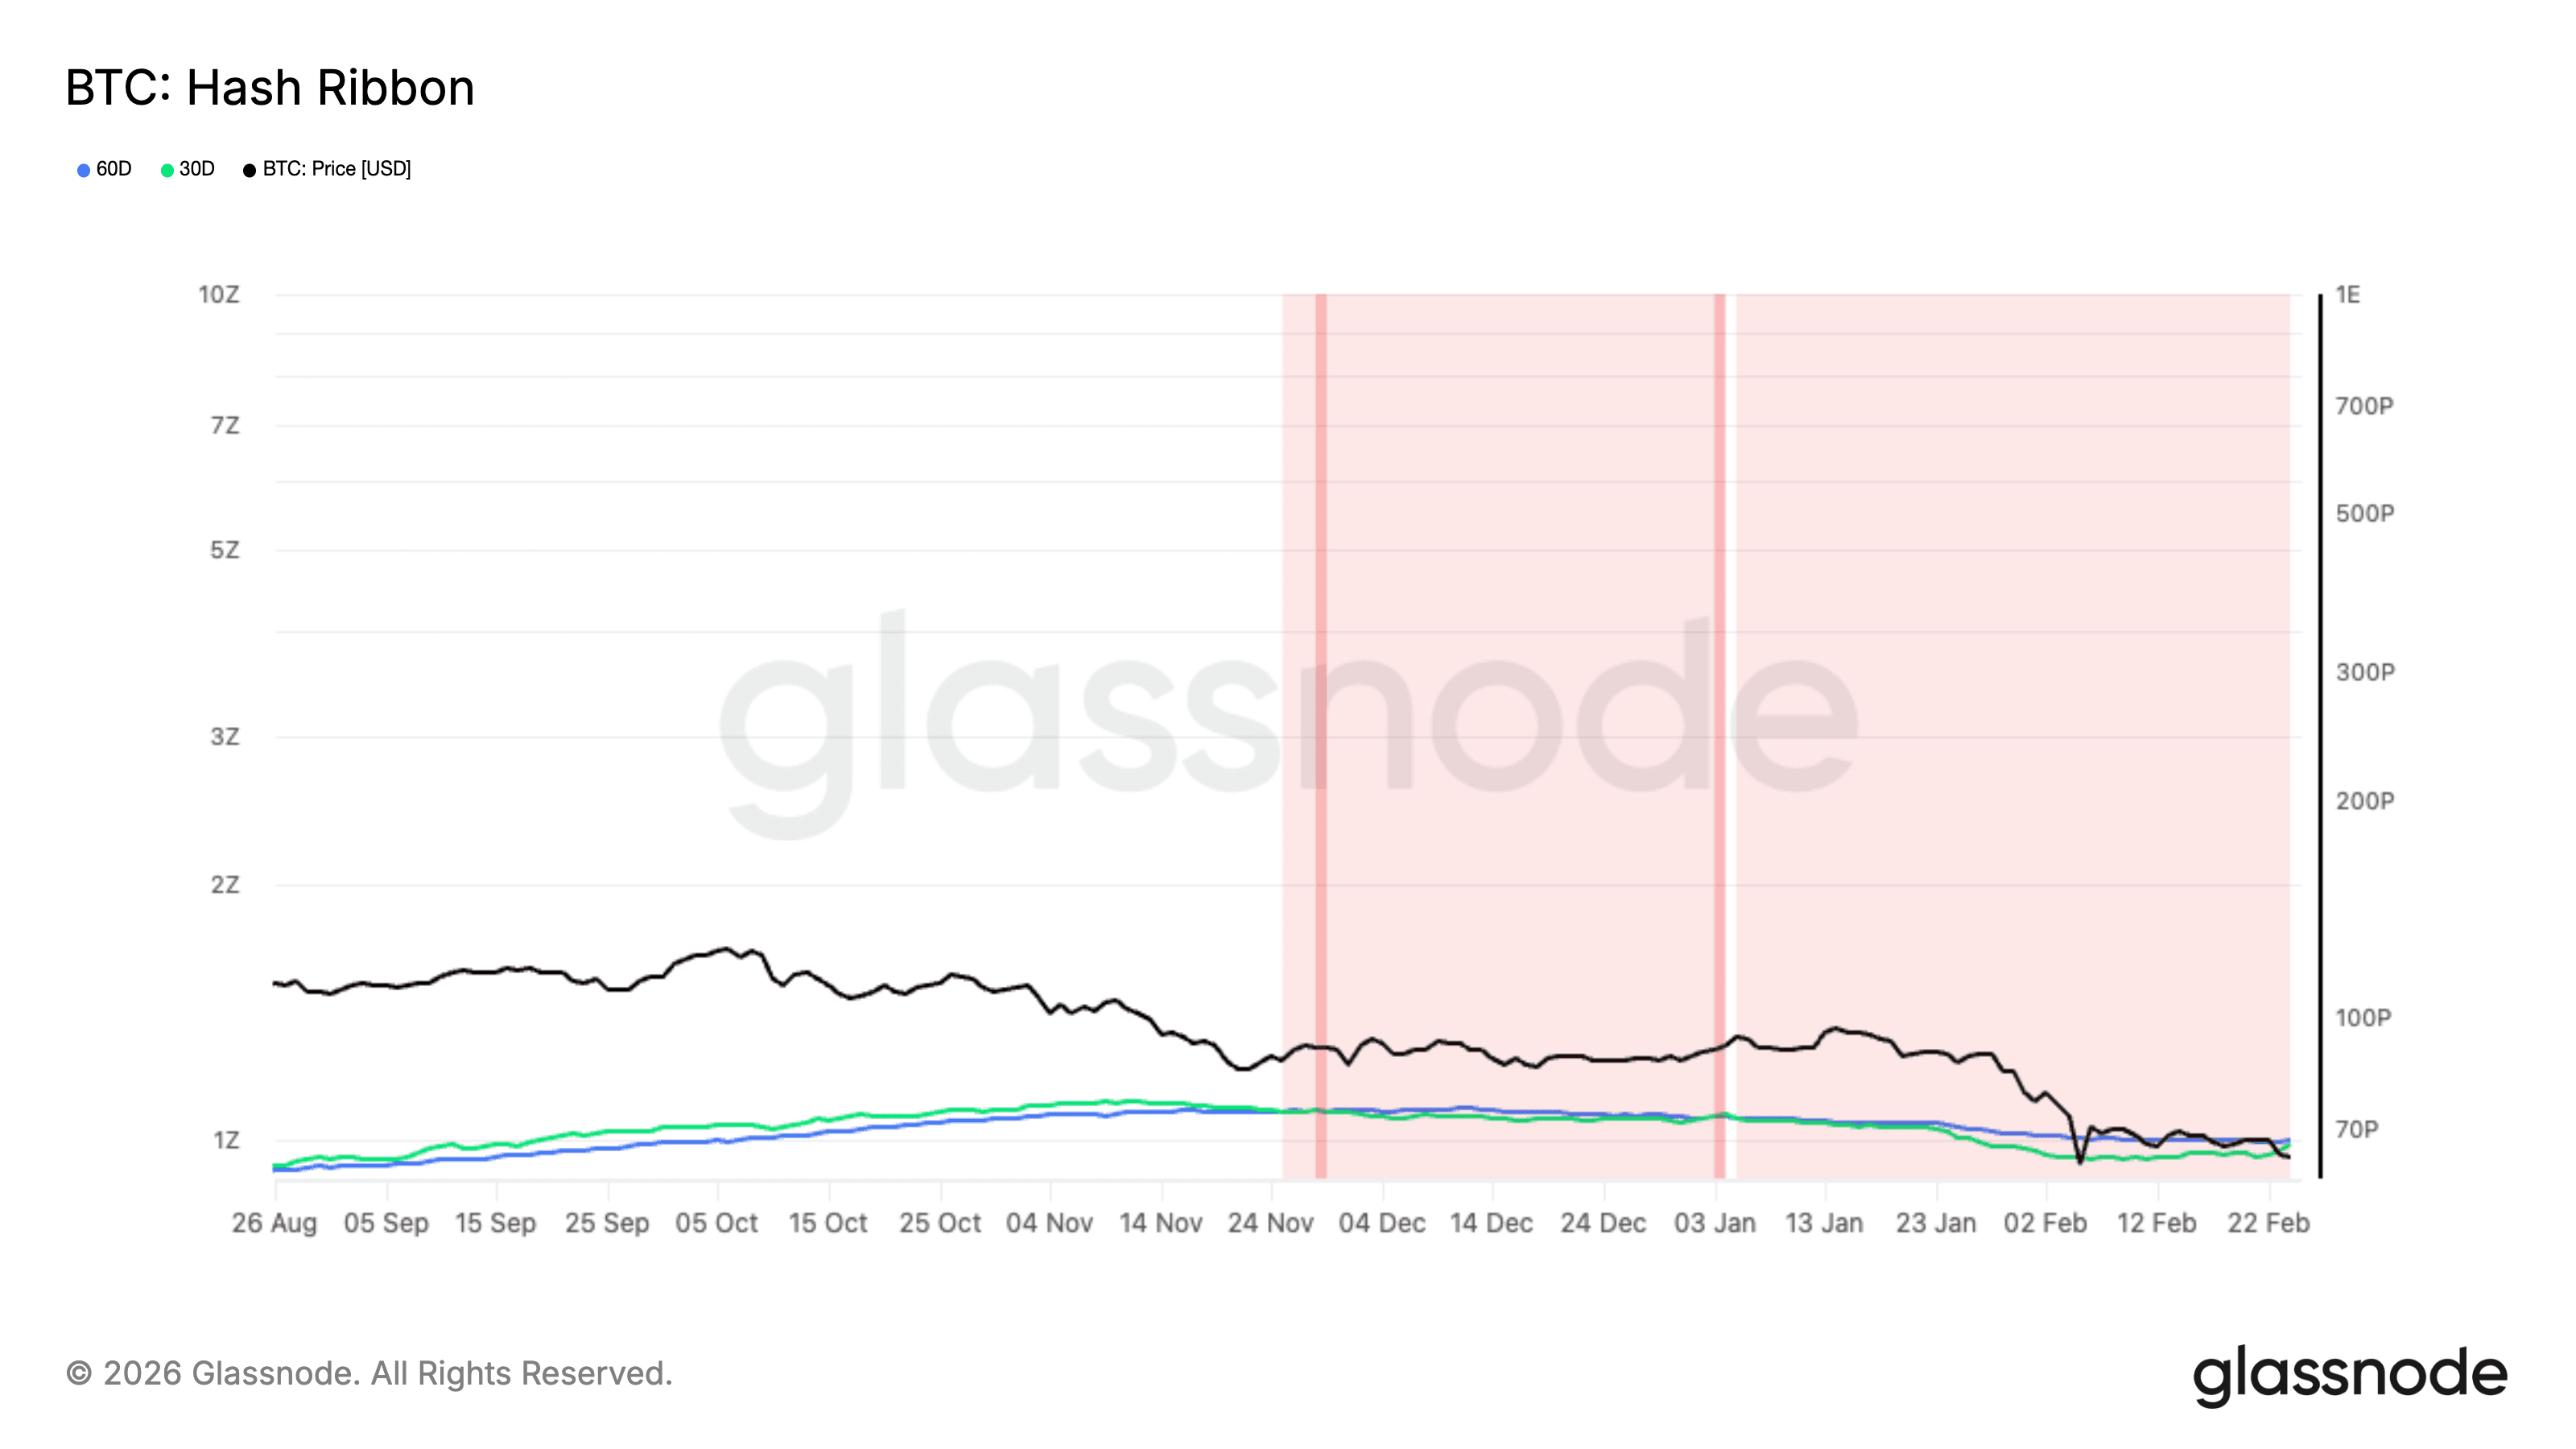
Image source: James Van Straten
What is “Miner Capitulation” and Why Is It Related to Price Bottoms?
In the cryptocurrency market, “miner capitulation” occurs when mining revenues are insufficient to cover electricity and operational costs, forcing inefficient miners to shut down equipment and sell their Bitcoin holdings to stay afloat. This collective selling pressure often causes the network’s hash rate to temporarily decline.
The Hash Ribbon indicator tracks the 30-day and 60-day moving averages (MA) of hash rate to assess market stress. When the 30-day MA crosses above the 60-day MA, it signals miners are coming back online, easing network pressure. Over the past decade, such crossovers have accurately marked important market lows, including those at the end of 2018 and 2022.
Data Analysis: Price Has Fallen Below “Average Production Cost”
In addition to the hash rate indicator, another piece of evidence supporting a bottom is Bitcoin’s production cost. Van Straten cites data from checkonchain, indicating that Bitcoin’s current trading price (around $65,000–$66,000) is below the estimated average production cost of $66,000.
When Bitcoin’s price drops below production costs, the market is generally considered to be in a “deep value zone.” This phenomenon is rare; the last time it occurred was in November 2022, when Bitcoin hit a cycle low of $15,500. Currently, the price falling below the cost line will further shake out the last weak holders, completing the capitulation process.

Related Articles
PEPE Jumps 2.3% With $337M Volume Surge — Is $0.054135 the Next Breakout Trigger?
Dogecoin Price Compresses Near $0.10 as Open Interest Drops
NEAR Surges 14.5% — Will a Break Above $1.25 Ignite a Run Toward $3–$4?
SHIB Tests $0.0560 Resistance as Broader Altcoin Cycle Extends Toward 2026
PIPPIN Surges Past $0.76 — $0.8472 Break or Pullback to $0.6715 Next?
PEPE Holds $0.053796 Support After 12% Drop Amid $580M Trading Spike