The Bitcoin bottom fractal pattern signals a 130% increase, but will it still be valid in 2026?
Bitcoin’s bottom formation signal that appeared in 2023—just before a 130% rally in 2024—has reactivated this week, raising the possibility that the price is approaching a new bullish reversal point. However, the current liquidity environment, ETF capital flows, and macroeconomic data have changed significantly compared to two years ago, indicating that the upcoming cycle may not follow the same pattern.
Bottom signals appear but lack breakout momentum
According to Swissblock data, Bitcoin has recorded 25 consecutive days in the “extreme risk” zone— the longest streak ever recorded, surpassing the 23 days in 2023. Historically, maintaining this state for an extended period often coincides with the final correction phase or the formation of a mid-term bottom.
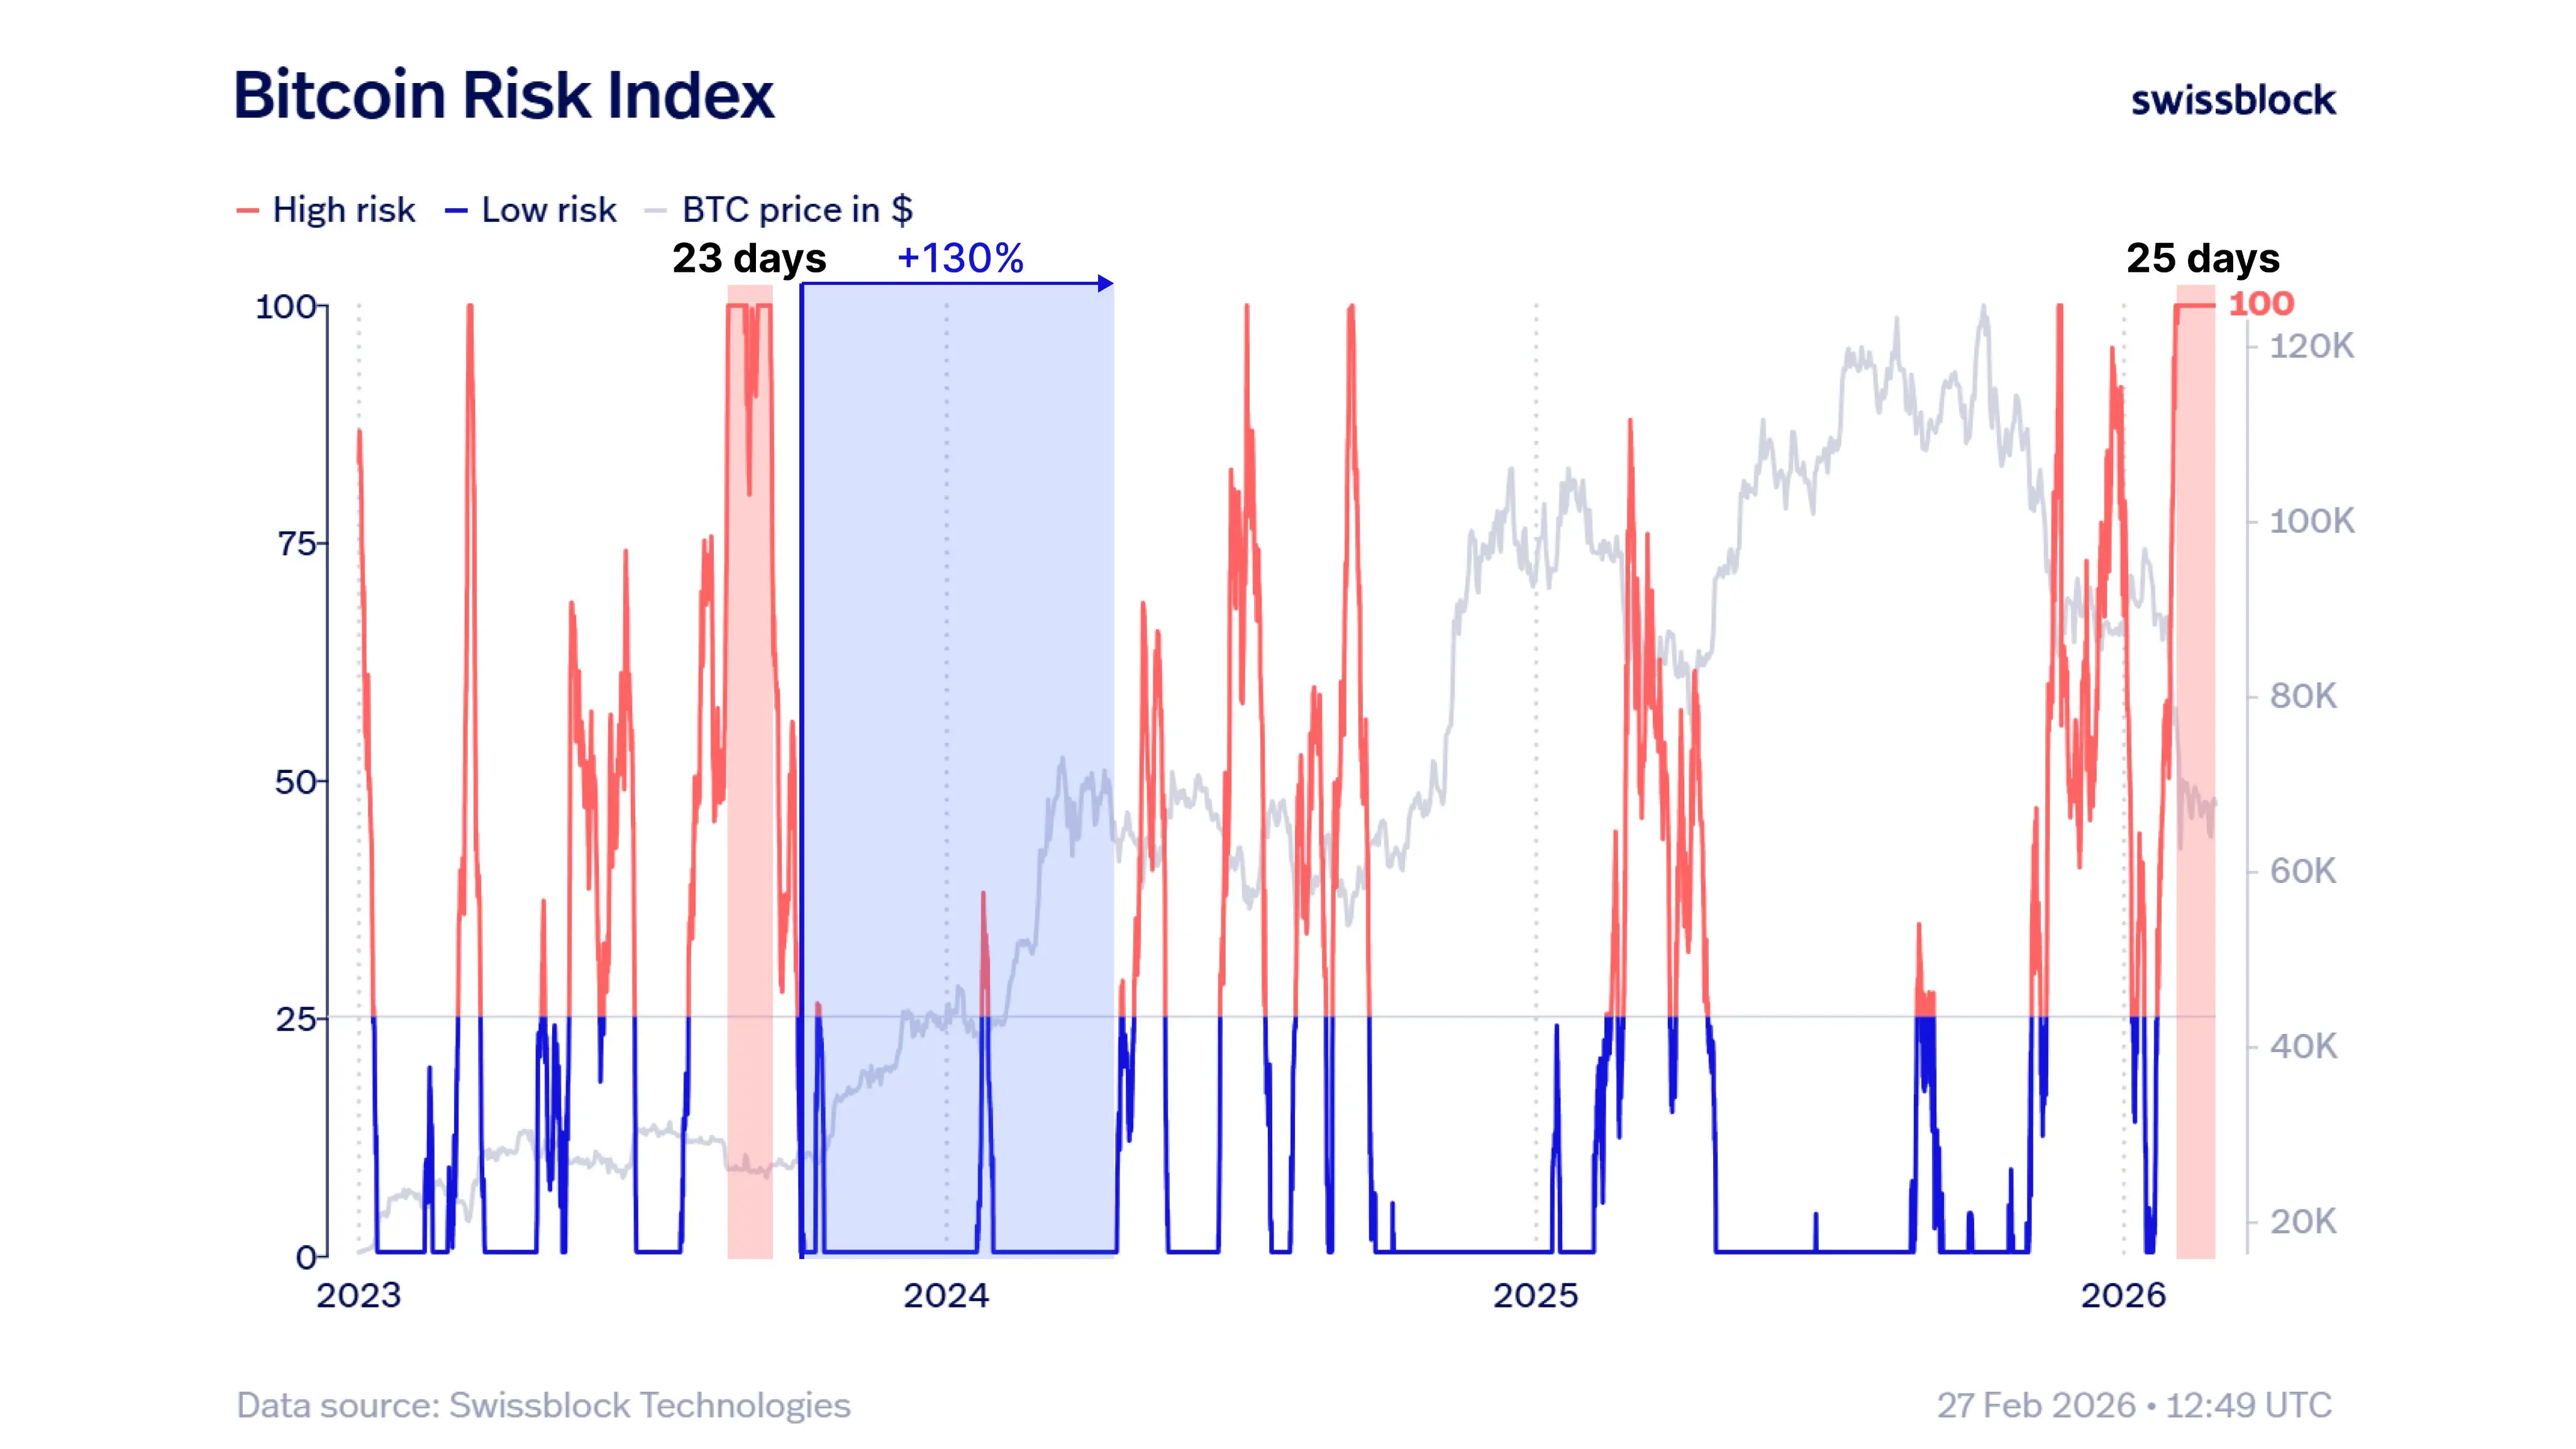 Bitcoin Risk Index | Source: Swissblock/X MN Capital founder Michaël van de Poppe also pointed out that comparing BTC’s chart with supply in profit/loss states shows the price interacting with regions that previously marked bottom formation phases. In 2023, the shift from high risk to low risk zones initiated a strong bullish expansion.
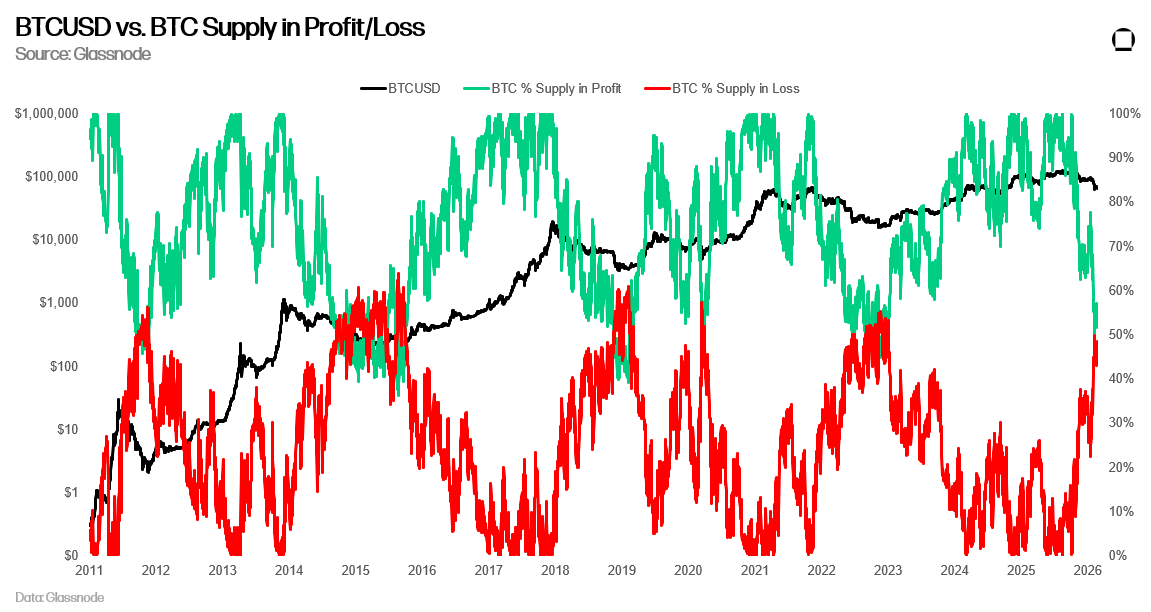 Comparison of BTCUSD exchange rate and BTC supply in profit/loss | Source: Michael van de Poppe/X However, traders’ positioning currently does not agree with a sustainable rally scenario. Data from RugaResearch shows that apparent demand has oscillated between positive and negative over the past 30 days. Selling pressure has weakened, but buying strength is not yet stable enough to dominate long-term.
Deep corrections often require time
The macroeconomic newsletter Ecoinometrics emphasizes that deep declines of around 50% in BTC rarely end quickly. Except for the 2020 recovery supported by ultra-loose monetary policy during the pandemic, previous recovery cycles tended to be prolonged and occurred in phases of accumulation.
ETF capital flow data also supports a cautious outlook. Since August, total inflows into gold ETFs have exceeded those into spot Bitcoin ETFs over the 90-day moving average. During the same period, Bitcoin funds have recorded an average 90-day outflow, currently at -$2.06 billion.
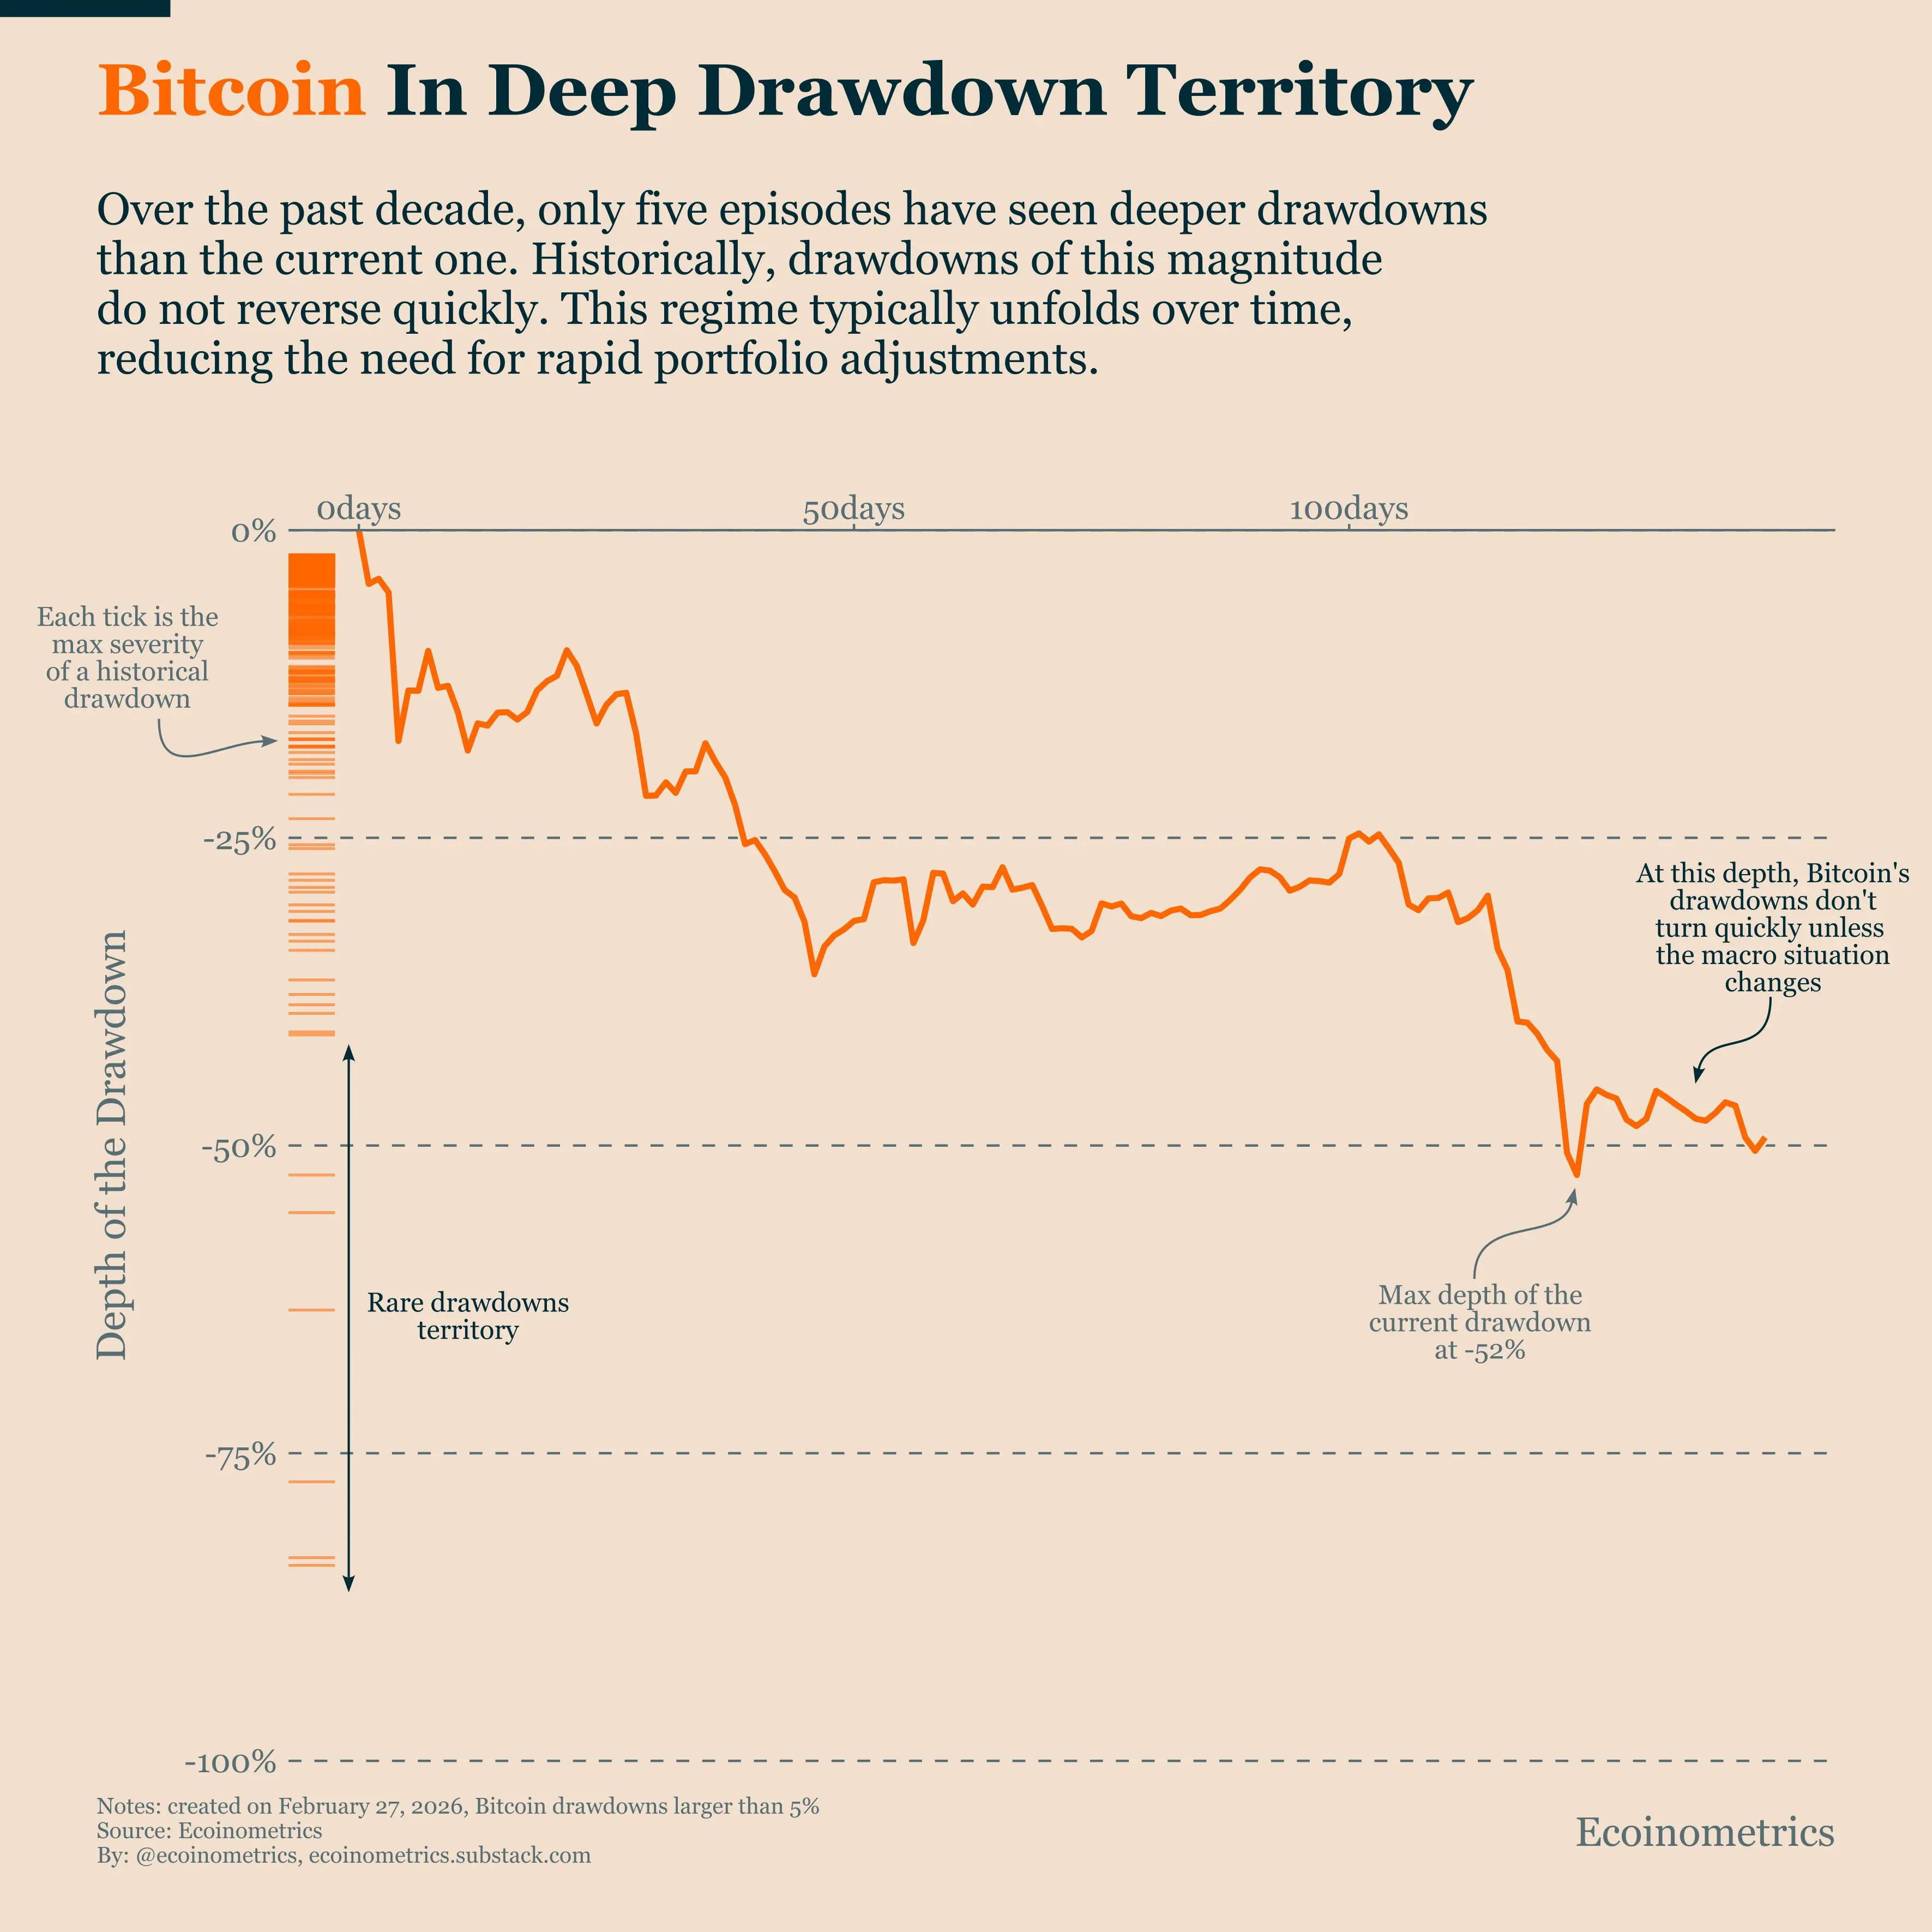 Bitcoin is in a strong downtrend. Source: Ecoinometrics Inflation dynamics further clarify the picture. According to Ecoinometrics, the overall Personal Consumption Expenditures (PCE) index is around 2.9% year-over-year; core PCE is nearly 3.0%, and core services above 3.4%. These are the Federal Reserve’s target indicators, and recent trends have not shown clear signs of decline. With limited expectations for policy easing, liquidity expansion prospects remain less optimistic.
Key price levels ahead
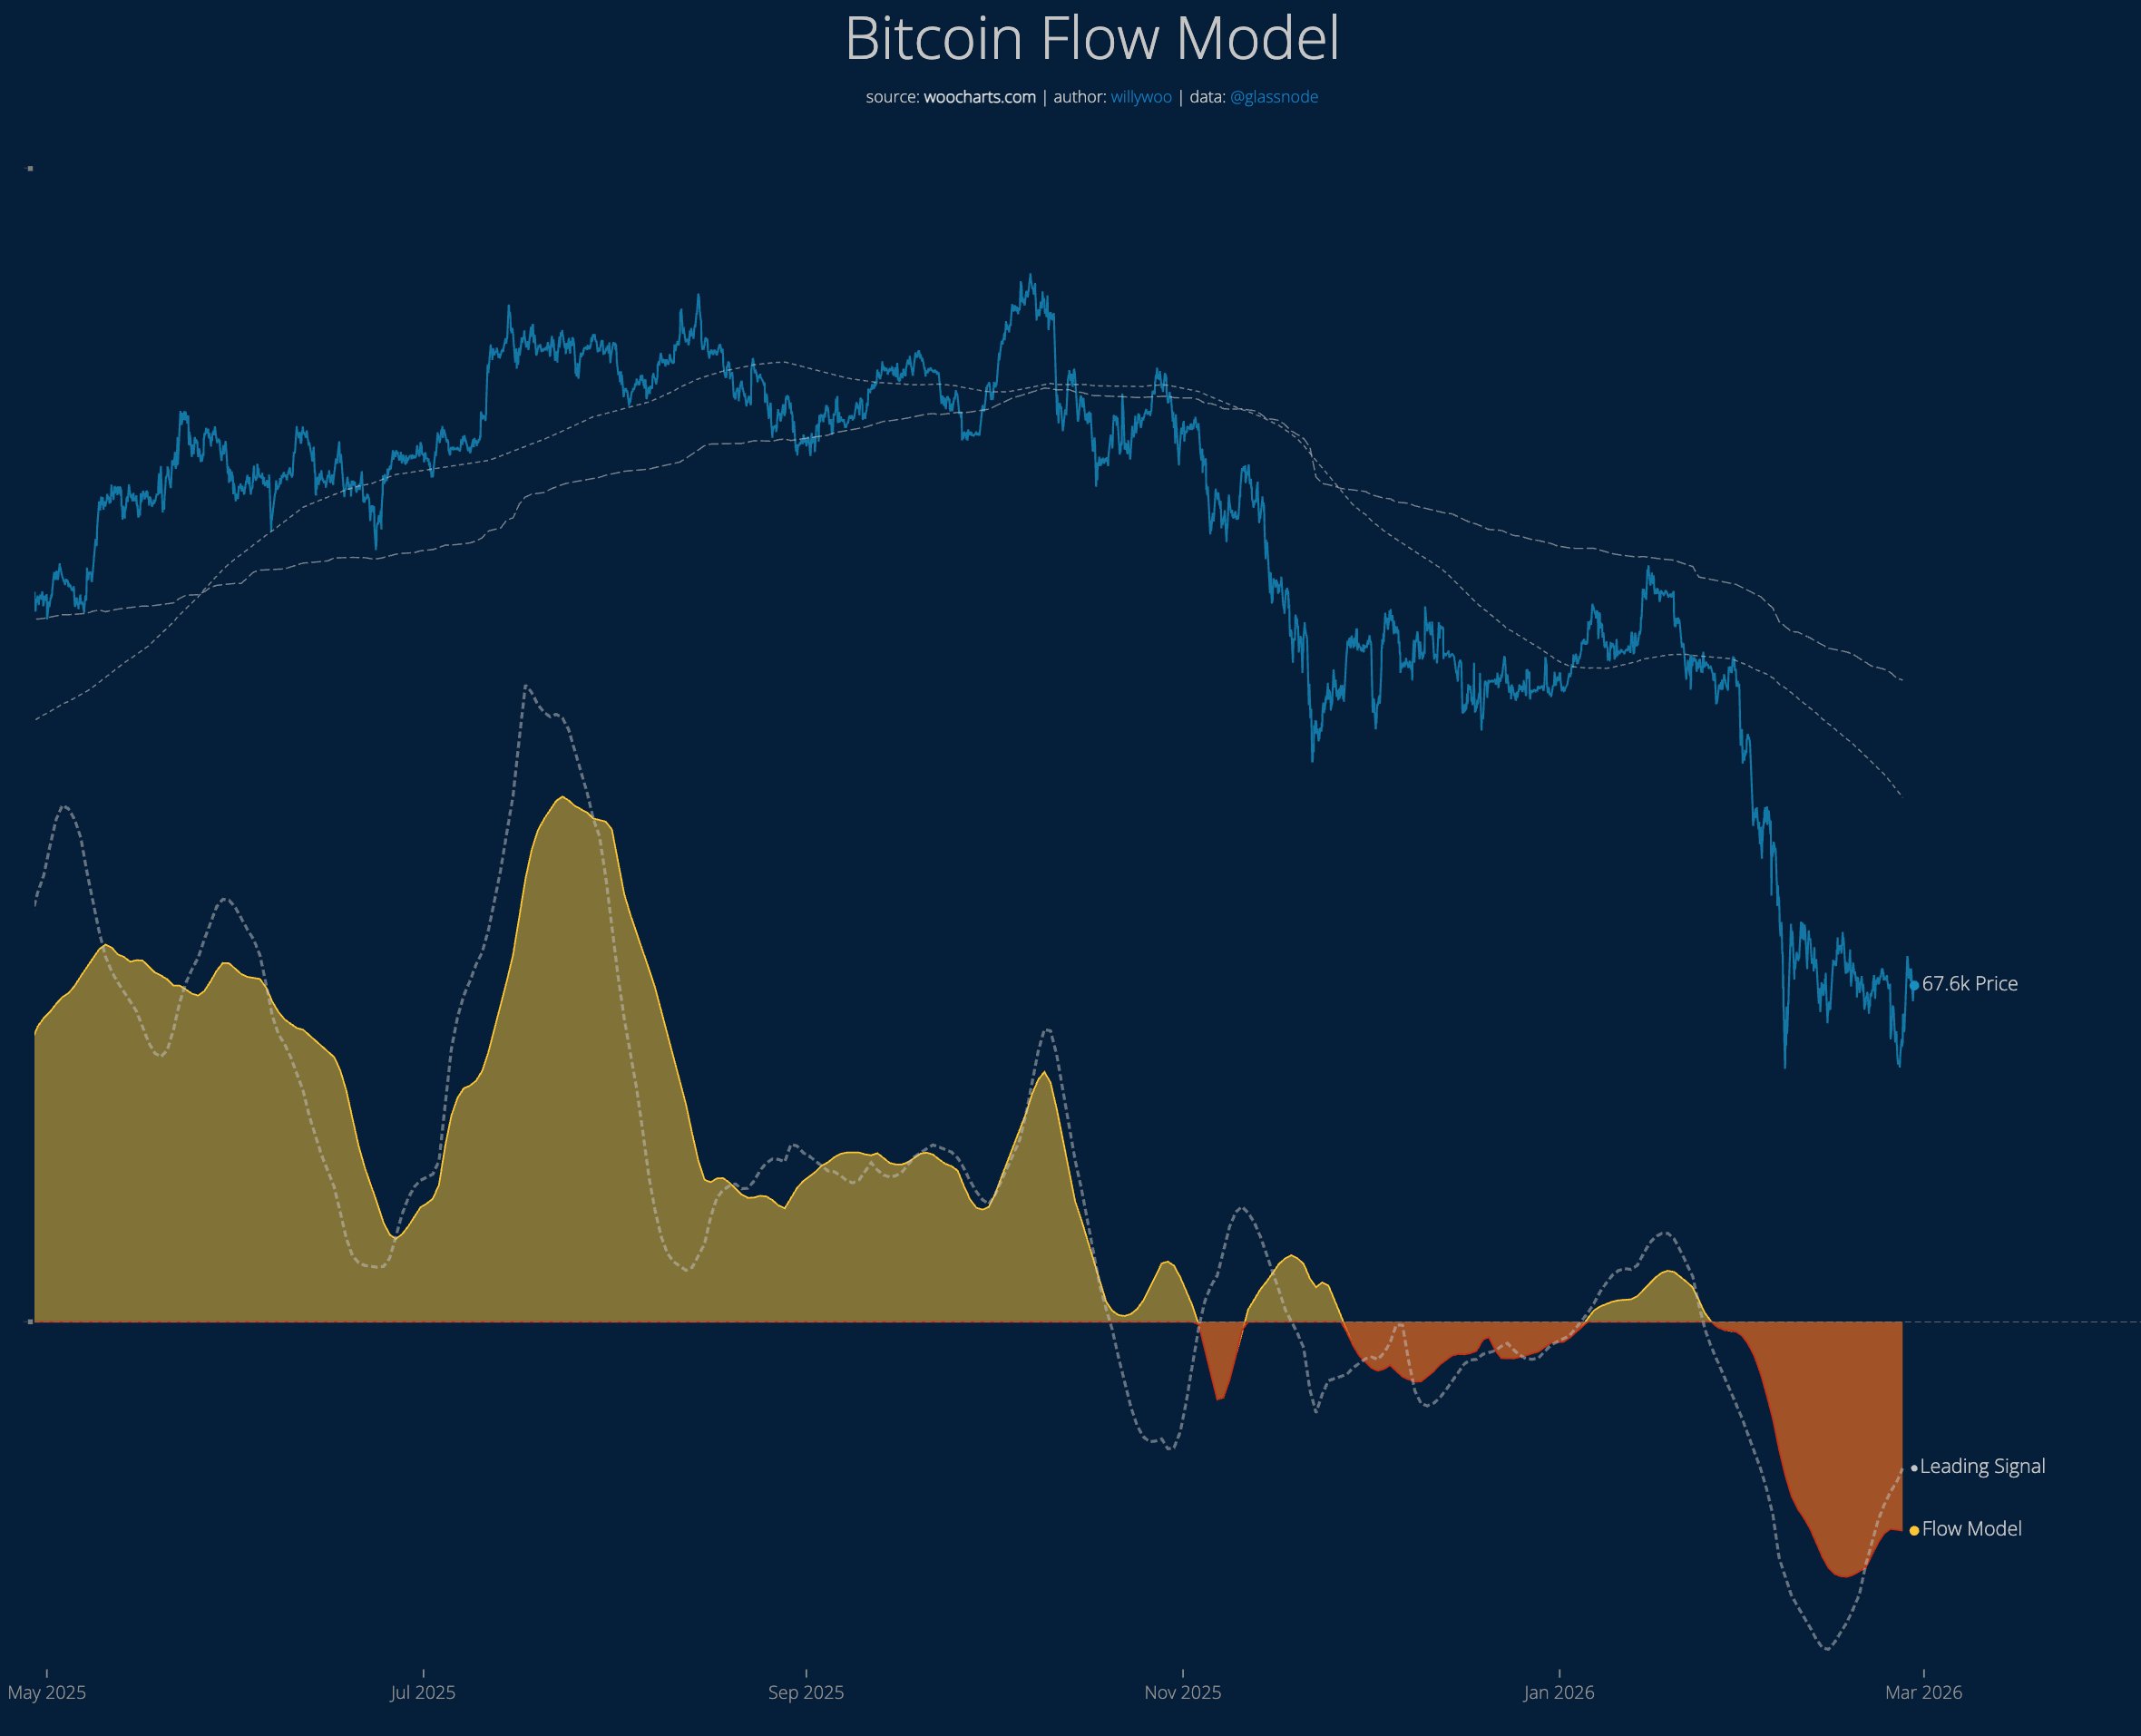
Partner manager at CMCC Crest, Willy Woo, states that any technical rebound toward the 70,000–80,000 USD range is likely to face new selling pressure, as “the overall market regime remains strongly bearish, with liquidity on both spot and derivatives markets weakening.”
Related Articles
Bitwise: Bitcoin investors need to hold for at least 3 years to avoid losses, with nearly a 50% chance of loss from short-term trading
Bitcoin Did Not Crash Because of Jane Street, Galaxy Research Says - U.Today
Ethereum's first-quarter return is currently -32.17%, and Bitcoin's is -23.21%.
Bitcoin on-chain NFT transactions sharply contracted, with February sales dropping below $25 million, marking the lowest record since March 2023.
Whale "pension-usdt.eth" Closes BTC Long Position with $466K Profit
Bitwise Backtesting: The probability of Bitcoin holding for 3 years resulting in a loss is only 0.7%, short-term trading carries high risk