Why is Bitcoin increasingly no longer considered a safe-haven asset? You might be asking the wrong question.
Bitcoin has plummeted 50% from its all-time high of $126,210 in October last year, while gold surged over 25% during the same period. As the narrative of “digital gold” once again fails, data shows BTC is following the trend of software stocks more closely than ever before, with a 30-day rolling correlation coefficient reaching 0.73. This article is based on Machines and Money research analysis “The Real Connection Between BTC and Software Stocks,” compiled and written by Dongqu.
(Previous summary: MicroStrategy has issued $6 billion in perpetual preferred stock to raise funds for Bitcoin purchases)
(Additional background: Willing to sell a kidney rather than sell Bitcoin—Genius or complete scammer, Michael Saylor?)
Table of Contents
Toggle
- How tight is the correlation? How long has it lasted?
- Stress test for safe haven in 2025
- Why is this happening: three structural drivers
- Institutional portfolio channel effects
- Shared macro factor sensitivities
- MicroStrategy’s reflexive loop
- Three competing frameworks: what’s next?
- Framework 1: Bitcoin as leveraged software exposure (structural identity reshaping)
- Framework 2: Both as expressions of global liquidity (systemic convergence)
- Framework 3: Bitcoin co-moves with stocks during stress periods (behavioral convergence)
- Scenario analysis: what can unravel this puzzle
- Conclusion: Bitcoin’s identity has never been fixed
Since October last year, Bitcoin has fallen 50% from its peak of $126,210, while gold hit a new record of $5,595 during the same period. Since BTC’s peak, gold has gained over 25%. The Crypto Fear & Greed Index hit a record low of 5 on February 6—more extreme than during the COVID crash and FTX collapse—and has only recovered to the teens so far.
Crypto commentators habitually raise the old question: Is Bitcoin truly digital gold? But this question presupposes a nonexistent “fixed identity.” Historically, BTC was highly correlated with gold in 2017, shifted to tracking tech stocks in 2021, and since late 2024, its movements have almost mirror-imaged software stocks.
For institutional allocators, a more constructive question is: under current liquidity conditions, which risk factors dominate Bitcoin’s return structure?
The answer—based on empirical data up to February 2026—is that Bitcoin is trading as a substitute for high-beta software stocks. Whether this is a temporary synchronization under shared macro sensitivities or a permanent reclassification in portfolio construction remains an open empirical question. But the data is increasingly hard to ignore.
How tight is the correlation? How long has it lasted?
The correlation between Bitcoin and IGV (iShares Expanded Tech Software ETF) has strengthened progressively across three phases.
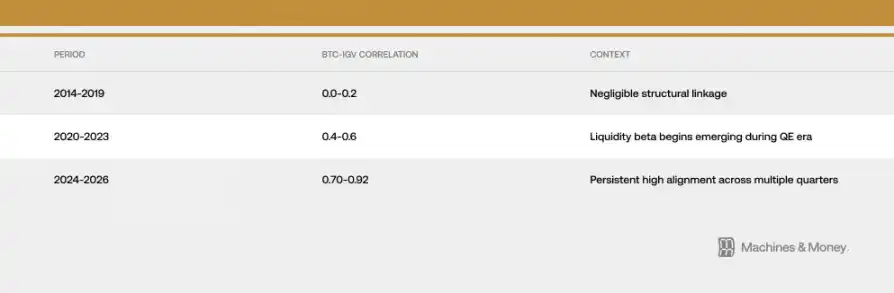
As of late February 2026, the 30-day rolling correlation is approximately 0.73. More importantly, this high correlation has persisted above 0.5 for over 18 months—far longer than typical short-term regime shifts (usually 3 to 6 months), but still short of the 4-7 year full liquidity cycle needed to confirm a comprehensive structural reclassification.
Recent pullbacks have made this relationship more evident. From early 2026 to late February, IGV declined about 23%, while Bitcoin fell roughly 19-20%. The iShares Expanded Tech Software ETF is heading into its worst quarterly performance since the 2008 financial crisis. One- and three-month tracking ratios hover around 1.0, indicating Bitcoin’s percentage moves are nearly in lockstep with the software sector. During this correction, observed beta values ranged from 1.1 to 1.3—significantly lower than many analysts’ assumptions of 2 to 3 times leverage relative to stocks.
However, an important caveat: short-term correlations tend to spike during volatile periods because risk appetite contracts across markets, causing assets to move in unison. The fact that this synchronized trend has lasted over 18 months suggests some deeper structural factors, but alone it cannot establish causality or confirm permanence.
Stress test for safe haven in 2025
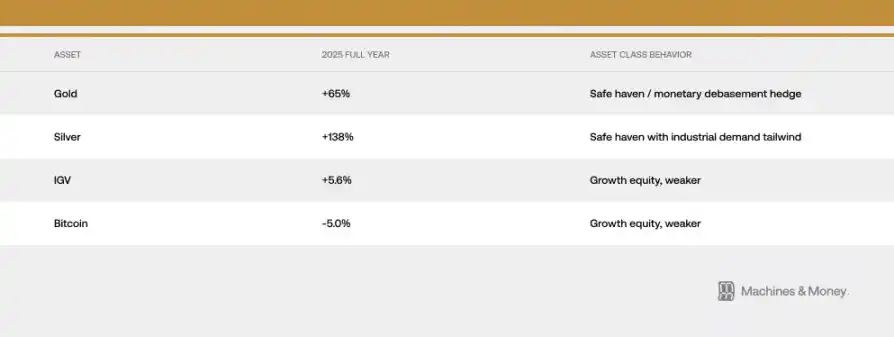
If we were to design a yearly test to see whether Bitcoin functions as a hedge against currency depreciation, 2025 would be an ideal candidate. Accelerating fiscal expansion, a weakening dollar, rising geopolitical risks, persistent inflation above the Fed’s 2% target, and expectations of rate cuts throughout the year—these are environments where “digital gold” should shine.
Yet, since October 2025, the trend tells a different story: gold soared from $4,400 to a new high of $5,595, while Bitcoin plunged from $126,210 to mid-$60,000s. Assets believed to serve as currency hedges moved in opposite directions under the most favorable conditions.
On January 29, 2026, gold hit a record of $5,595. Central banks bought 863 tons of gold in 2025—marking the third consecutive year of large-scale sovereign reserve accumulation. Central banks buying Bitcoin? Zero.
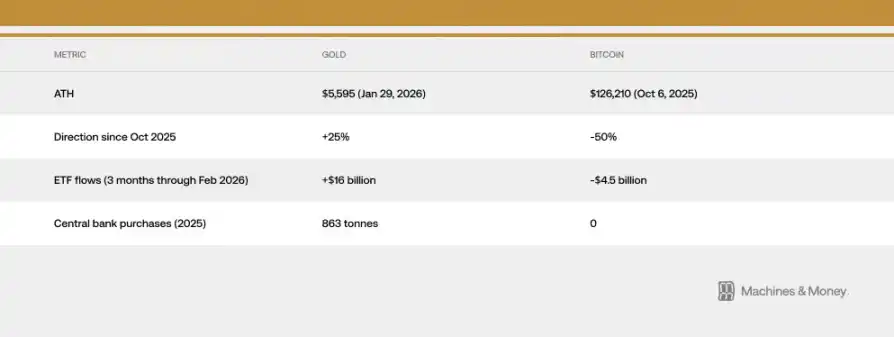
This divergence in capital flows is the most damaging counterexample to the “digital gold” narrative: when institutions and sovereign allocators seek safe havens in an environment where Bitcoin should be protective, they chose gold over Bitcoin by more than a 3-to-1 dollar ratio.
This does not mean Bitcoin will never exhibit safe-haven properties; rather, it indicates that under current investor composition, market structure, and liquidity regimes, it simply cannot. In 2025, both Bitcoin and software stocks delivered low single-digit returns, while traditional hard assets posted generational gains. The overlapping behavior during this stress test is one of the strongest pieces of evidence supporting the “convergence thesis.”
Why is this happening: three structural drivers
Institutional portfolio channel effects
ETF packaging has fundamentally changed how Bitcoin is traded at the institutional level.
Mechanically, Bitcoin is now embedded in the same portfolio construction frameworks as software stocks. Risk management systems treat both assets similarly; rebalancing decisions impact both simultaneously; performance attribution uses tech benchmarks as reference. When a multi-asset fund needs to reduce growth risk, it sells both IGV components and Bitcoin in the same transaction.
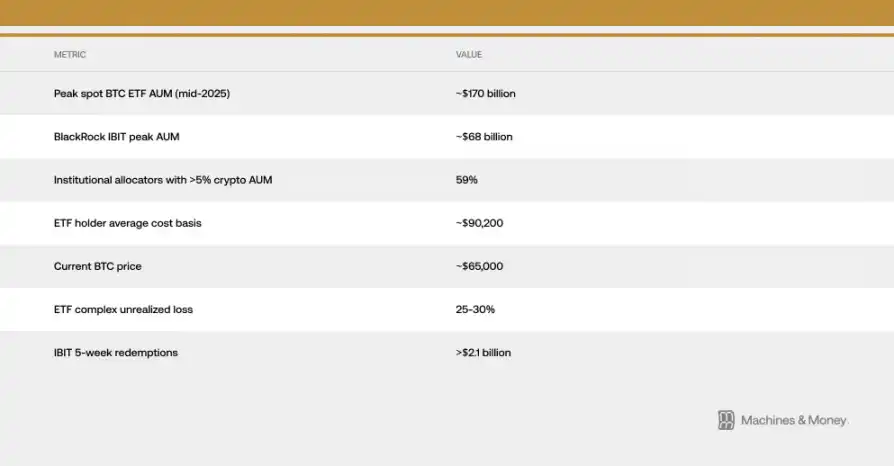
This creates a self-reinforcing correlation loop: institutional classification drives related capital flows, which in turn reinforce classification. According to analysis by Investing.com, the average cost basis for U.S. spot Bitcoin ETF holders is around $90,200. At current prices near $64,000, the entire institutional ETF universe is roughly 25-30% underwater.
This cost gap is critical because it transforms what might have been patient institutional holdings into persistent selling pressure. Those who bought ETFs expecting diversification or hedging now face deep losses while watching gold ETFs appreciate. The feedback loop between ETF redemptions and spot price declines was clearly visible in early 2026, with the longest net outflows since ETF inception. For example, BlackRock’s IBIT saw over $2.1 billion in redemptions in just the past five weeks.
Shared macro factor sensitivities
Bitcoin and software stocks respond to the same macro inputs: real yields, M2 money supply dynamics, Fed balance sheet operations, dollar strength, and risk appetite (proxied by VIX and credit spreads). Both are long-duration assets that rise when real yields fall and decline when yields rise; benefit from liquidity expansion and suffer during tightening.
The core interpretive question: Is Bitcoin specifically correlated with software stocks, or is it linked to a broader set of “liquidity-sensitive growth assets”? Evidence supports the latter. Bitcoin’s declines are not due to disappointing software profits; they are driven by the same liquidity environment that compresses software multiples and drains speculative capital. Correlation reflects shared macro sensitivities, not intrinsic equivalence.
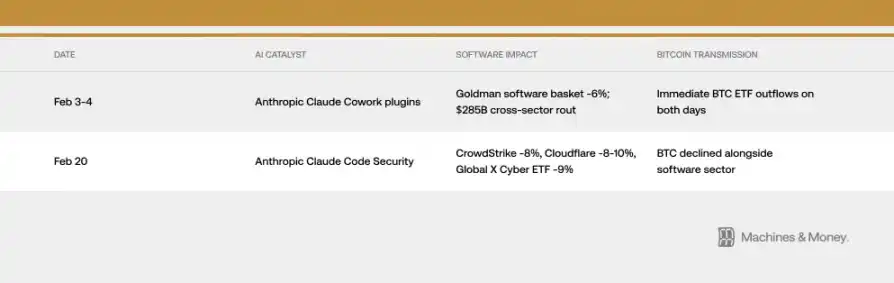
Yet, the transmission mechanisms can sometimes be surprisingly direct. For instance, in February 2026, two AI product launches via the same institutional channels impacted Bitcoin prices—completely unrelated to fundamentals. A single AI product announcement can move BTC through institutional pipelines—an illustration of the correlation mechanism in action.
The VIX index mostly stayed between 19 and 20 in February, then spiked above 21 due to stubborn inflation data, adding risk-off context. Both Bitcoin and software stocks react negatively to rising VIX, but this sensitivity is asymmetric: when VIX continues to decline from already low levels, neither asset gains significantly. This aligns with the behavior of high-beta growth assets rather than safe havens.
MicroStrategy’s reflexive loop
Strategy (formerly MicroStrategy) is the world’s largest corporate Bitcoin holder, classified within Nasdaq as a software/tech sector. This creates a direct mechanical link between software sector performance and Bitcoin market sentiment.
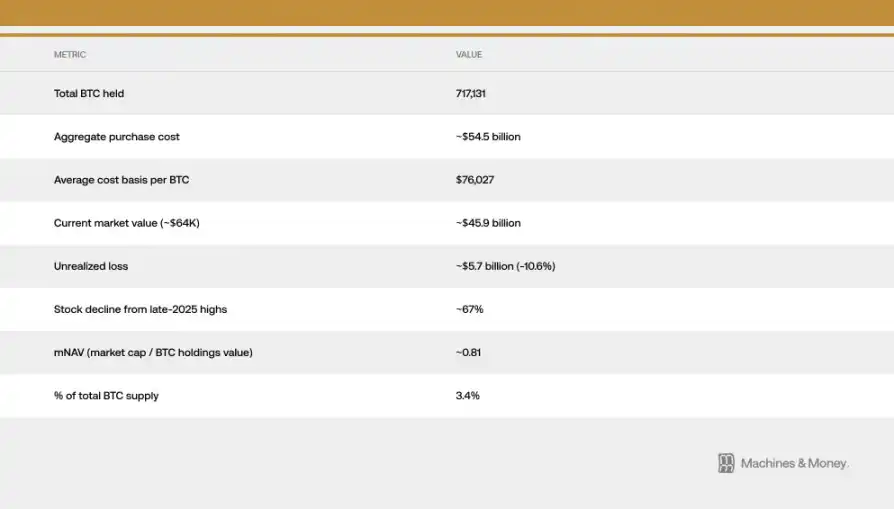
The reflexive loop operates bidirectionally: weak software sector performance drives Strategy’s stock price down, which amplifies Bitcoin bearish sentiment and can even induce actual selling pressure. During corrections, this loop intensified the correlation between Bitcoin and the software index. Since late 2025, Strategy’s stock has fallen about 67% from its high, underperforming IGV and Bitcoin itself.
The company’s market value relative to net asset value (mNAV) has dropped to about 0.81, meaning the stock trades below its Bitcoin holdings’ value. This suggests an overlay of company-specific amplification on the underlying correlation.
In January 2026, MSCI proposed removing companies with over 50% digital asset holdings from certain indices—estimated by JPMorgan to trigger about $8.8 billion in forced outflows—highlighting the fragility of Bitcoin treasury models in traditional finance classifications. MSCI ultimately maintained the current treatment but signaled future review, leaving the risk unresolved.
Three frameworks: what’s next?
Framework 1: Bitcoin as leveraged software exposure (permanent identity reshaping)
The case for permanent reclassification rests on a correlation of 0.73, a 0.82 year-to-date tracking ratio, synchronized ETF flows, and shared institutional investor bases. Under this view, the ETF era has permanently embedded Bitcoin into tech portfolios. Correlation is expected to persist across liquidity cycles.
But history is the Achilles’ heel of this framework. Bitcoin’s protocol has never changed. The same asset was nearly uncorrelated with software from 2014 to 2019. Past high-correlation periods (2017–2018 with alternative tech stocks, 2021–2022 with Nasdaq) proved temporary. Confirming a permanent structural shift requires sustained correlation over an entire Fed easing-tightening cycle, which has yet to occur.
Framework 2: Both as expressions of global liquidity (systemic convergence)
A simpler explanation: both Bitcoin and software stocks are high-duration, liquidity-sensitive assets that are highly correlated under the current tight liquidity regime. This correlation emerged during 2020 QE, intensified during 2022 QT, and has persisted through 2024–2026 tightening.
In this view, when a new easing cycle begins and capital flows shift, correlation could break. Historically, Bitcoin tends to lead stocks by 1–3 months when Fed policy shifts, and supply-side dynamics (like the April 2024 halving, with price gains typically 12–18 months post-halving) could create differentiated returns in late 2026.
Framework 3: Bitcoin co-moves with stocks during stress (behavioral convergence)
Bitcoin behaves as a highly volatile risk asset that, during downturns, moves in tandem with stocks regardless of fundamentals. Risk appetite shifts dominate short-term price movements. Rising VIX compresses both assets. Narratives—such as AI disruption fears simultaneously depressing software valuations and risk appetite—generate additional synchronization.
The crypto fear & greed index hit a record low of 5 on February 6—more extreme than during FTX or COVID crashes—driven not by crypto-specific disasters but by broad macro and sector-wide sell-offs of growth assets. The worst sentiment readings in Bitcoin history stem from the same factors that crushed software stocks.
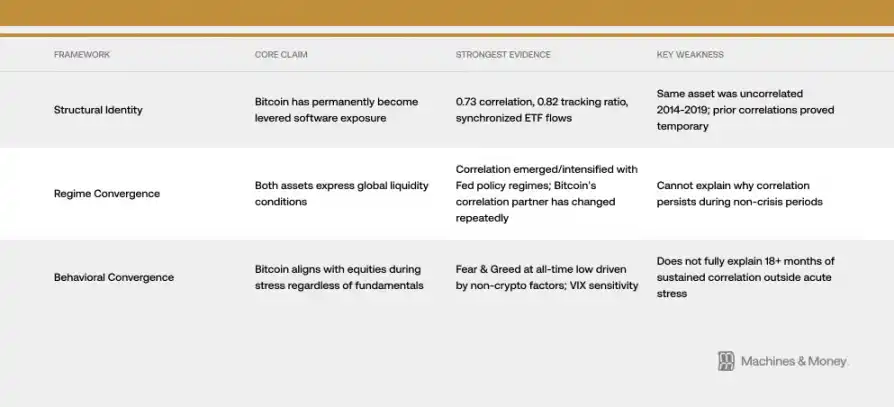
The strongest current evidence supports Framework 2, while the mechanism in Framework 1 (especially institutional portfolio channel effects) continues to amplify correlation within the current regime.
Scenario analysis: what can unravel this puzzle
Frankly, we lack sufficient data to assign credible probabilities to any outcome. What we can do is define scenarios clearly and identify signals that could confirm or disprove each.
Scenario 1: Correlation persists (baseline). Liquidity remains tight throughout 2026. Bitcoin continues trading as a high-beta growth asset, with correlation to IGV between 0.5 and 0.8. Identity remains unresolved. If Fed policy, institutional holdings, or Bitcoin-specific dynamics do not change structurally, this is the default.
Scenario 2: Decoupling. The Fed shifts to easing, combined with supply-side effects from the 2024 halving and fading AI fears, leading Bitcoin to outperform IGV significantly in late 2026. Correlation drops to 0.3–0.5. This would validate the systemic convergence interpretation and suggest the current synchronization is temporary.
Scenario 3: Permanent convergence. Correlation rises above 0.8 and remains high through the next easing cycle. Bitcoin is officially reclassified as a tech sector exposure by major index providers. This would confirm a structural identity shift.
Key test: if correlation breaks during Fed easing, systemic convergence is validated; if it persists through full cycles, structural reclassification becomes the dominant narrative.
Until empirical evidence from the 2026–2027 easing cycle emerges, this remains an open question.
Conclusion: Bitcoin’s identity has never been fixed
Bitcoin has never had a fixed identity. It is always what marginal buyers need it to be—and right now, the dominant marginal buyers are institutional allocators viewing it as a growth stock proxy. That may change. The asset’s underlying properties remain unchanged.
But markets price based on “who holds it, and why,” not what it was designed for. Before the next liquidity regime provides a natural experiment, correlation is the reality—and for anyone trying to understand Bitcoin’s current role in portfolios, reality is all that matters.