Hyperliquid’s native token $HYPE recently attempted a rebound from lows, but Coinglass’s liquidation map shows approximately $28.9 million in short positions concentrated above the $35 level. Meanwhile, the MACD indicator experienced a bullish crossover on Sunday, signaling a potential technical trend reversal.
Liquidation Map Analysis: The $35 Key Breakout Point
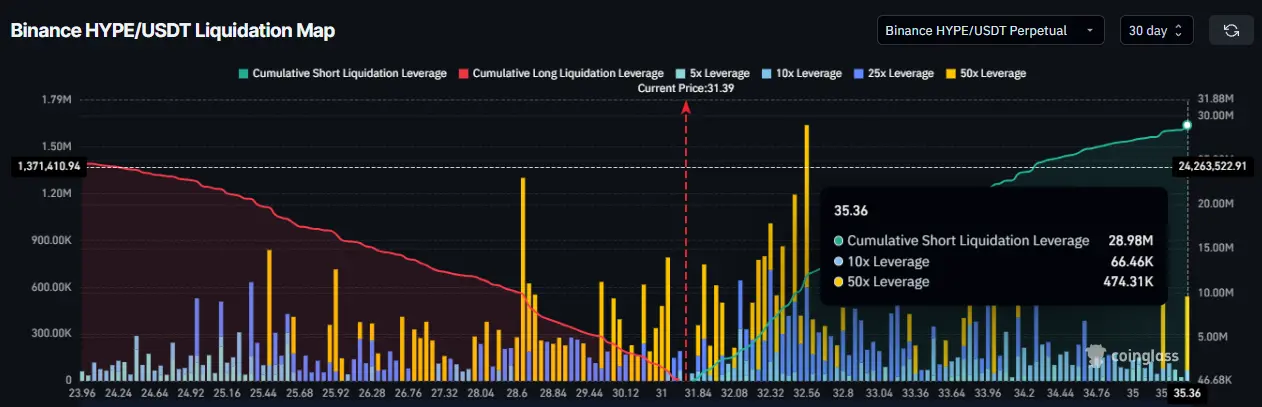
(Source: Coinglass)
Hyperliquid’s liquidation structure exhibits a clear directional asymmetry: currently, high-liquidity contracts are dominated by short positions, with over $28.9 million in shorts heavily concentrated around the $35 price level.
This concentration of shorts can be interpreted from two perspectives:
On one hand, the large number of short positions reflects market expectations that $HYPE will continue its downtrend, creating technical selling pressure. On the other hand, the dense cluster of shorts also sets the stage for a potential upward catalyst—if buying momentum drives $HYPE to decisively break through $35, forced short covering will trigger a chain reaction, amplifying the upward move. This “short squeeze” could push the price rapidly toward the $38 region, as technical analysis suggests.
At around $38, the distance between the 50-day and 200-day moving averages may narrow further. If, after short liquidation, these moving averages form a golden cross, it would serve as a stronger confirmation of a medium-term bullish structure.
Technical Signals and Key Price Levels
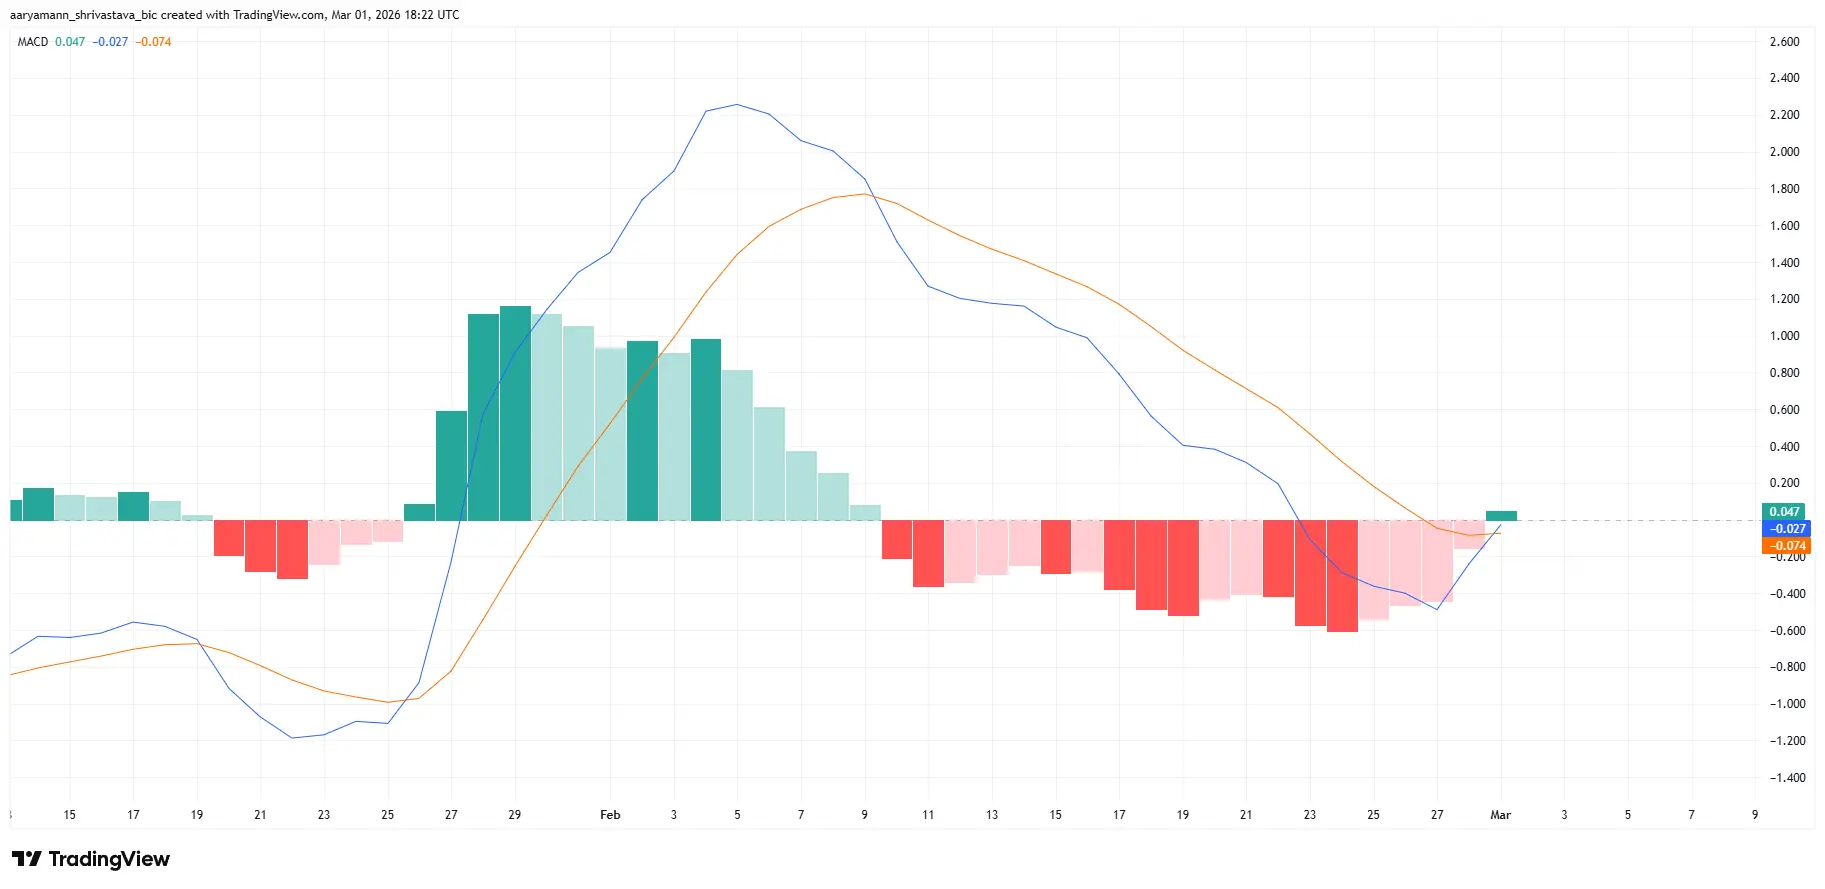
(Source: TradingView)
Beyond the liquidation structure, technical indicators provide initial positive signals for short-term momentum.
The MACD (Moving Average Convergence Divergence) experienced a bullish crossover on Sunday, with the DIF line crossing above the DEA line, a common short-term buy signal in technical analysis. The narrowing and turning positive of the histogram suggest that selling momentum may be weakening. If spot buying demand aligns with these technical signals, $HYPE could gradually establish a stable upward trend in the near term.
Key technical levels to watch are:
- First Resistance: $34 — immediate overhead pressure for spot price
- Core Liquidation Trigger: $35 — short position concentration zone; breaking through could trigger a chain reaction
- Short Squeeze Target: $38 — price target after $28.9 million short liquidation
- First Support: $30 — critical bottom line protecting the bullish structure
- Secondary Support: $26 — next major support if $30 fails
Frequently Asked Questions
Q: Why does the $HYPE short liquidation at $35 amplify the price movement?
In futures markets, traders holding short positions typically set stop-loss orders just above key resistance levels. When the price breaks above $35, many stop-loss orders are triggered automatically, forcing traders to buy back (cover) their shorts. This forced buying adds to the upward momentum, accelerating the price increase—creating a short squeeze. The $28.9 million concentrated liquidation can generate significant volatility in a short period.
Q: Is the MACD bullish crossover enough to confirm a trend reversal for $HYPE?
A MACD crossover is a short-term bullish signal indicating increasing buying momentum, but it alone is insufficient to confirm a trend reversal. Analysts usually recommend combining it with volume analysis, spot market strength, and other momentum indicators like RSI. Given the current macro environment—geopolitical tensions and overall market risk appetite—this initial technical signal needs macro confirmation to be reliable.
Q: If $HYPE falls below $30 support, what signals should investors watch?
$30 is the current structural support that has maintained the upward trend for over a month and a half. A breakdown below this level would shift the focus to the next support at $26, and the bullish structure would be invalidated. Investors should monitor whether volume increases during the decline (confirming genuine selling pressure) and whether spot funds are flowing out (net outflows), which would indicate the breakdown’s sustainability.
Disclaimer: The information on this page may come from third parties and does not represent the views or opinions of Gate. The content displayed on this page is for reference only and does not constitute any financial, investment, or legal advice. Gate does not guarantee the accuracy or completeness of the information and shall not be liable for any losses arising from the use of this information. Virtual asset investments carry high risks and are subject to significant price volatility. You may lose all of your invested principal. Please fully understand the relevant risks and make prudent decisions based on your own financial situation and risk tolerance. For details, please refer to
Disclaimer.
Related Articles
Did Kaspa (KAS) Price Just Hit Its Cycle Low? Analyst Breaks Down What Could Happen Next
Kaspa (KAS) may be nearing a price bottom as it approaches key technical indicators like Fibonacci levels and a long-term trendline. Analysts suggest the cryptocurrency could stabilize around $0.24, potentially paving the way for a future upward move towards $1, contingent on market conditions.
CaptainAltcoin2h ago
Polkadot to Reset Tokenomics on March 12 With Major DOT Supply and Staking Changes
Polkadot will introduce a new monetary framework on March 12 that sets DOT’s supply cap at 2.1 billion and lowers emissions by 53.6%.
The overhaul will also create a Dynamic Allocation Pool and shorten the DOT unbonding period from 28 days to 24–48 hours.
On March 12, Polkadot will reset
CryptoNewsFlash3h ago
Solana Eyes $90.6 Trigger Point as $83 Support Holds and Liquidation Pressure Builds
A large cluster of short positions faces liquidation if SOL reaches $90.6, potentially increasing volatility.
SOL trades between $83.00 support and $89.58 resistance, keeping price action compressed in the short term.
SOL posts a 0.8% daily gain and rises 0.7% against BTC, holding
CryptoNewsLand4h ago
Will XRP Hold $1.33 or Extend Toward $1.30 Before Rebound?
XRP is currently trading at $1.35, experiencing a 1.3% decline. Key support is at $1.34, while resistance is at $1.40. The price is testing around the Fibonacci levels of $1.33 and $1.30, crucial for potential upward movement or deeper decline.
CryptoNewsLand4h ago
Solana Nears $95 Resistance With $17B Volume Surge
Solana approaches a key resistance level near $95, with increased trading volume and open interest signaling active trader interest. The token is currently at $90.20, facing potential upward movement if it surpasses $95, but may test $85 if rejected.
CryptoFrontNews4h ago

