Tezos, Toncoin, Polkadot reach danger zone as US–Israel–Iran conflict escalates
Altcoins like Tezos, Toncoin, and Polkadot are among the most heavily sold cryptocurrencies in the past 24 hours, as geopolitical tensions escalate following military actions by the US and Israel against Iran. In this context, Tezos and Toncoin have retreated to important technical support levels, reflecting a clear cautious sentiment among investors. Conversely, Polkadot remains oscillating near a key trend resistance line, indicating a relatively stronger price foundation compared to the overall market. From a technical perspective, the entire cryptocurrency market is currently overshadowed by concerns over geopolitical risks, and downward pressure is likely to persist for some time.
Tezos Under Pressure, Facing the Risk of Further Decline
Tezos experienced a decline of over 3% on Sunday, as its recovery during the day was halted by the 50-day Exponential Moving Average (EMA). As of Monday, XTZ is still trading below the $0.40 level, approaching the February 6th low of around $0.3582.
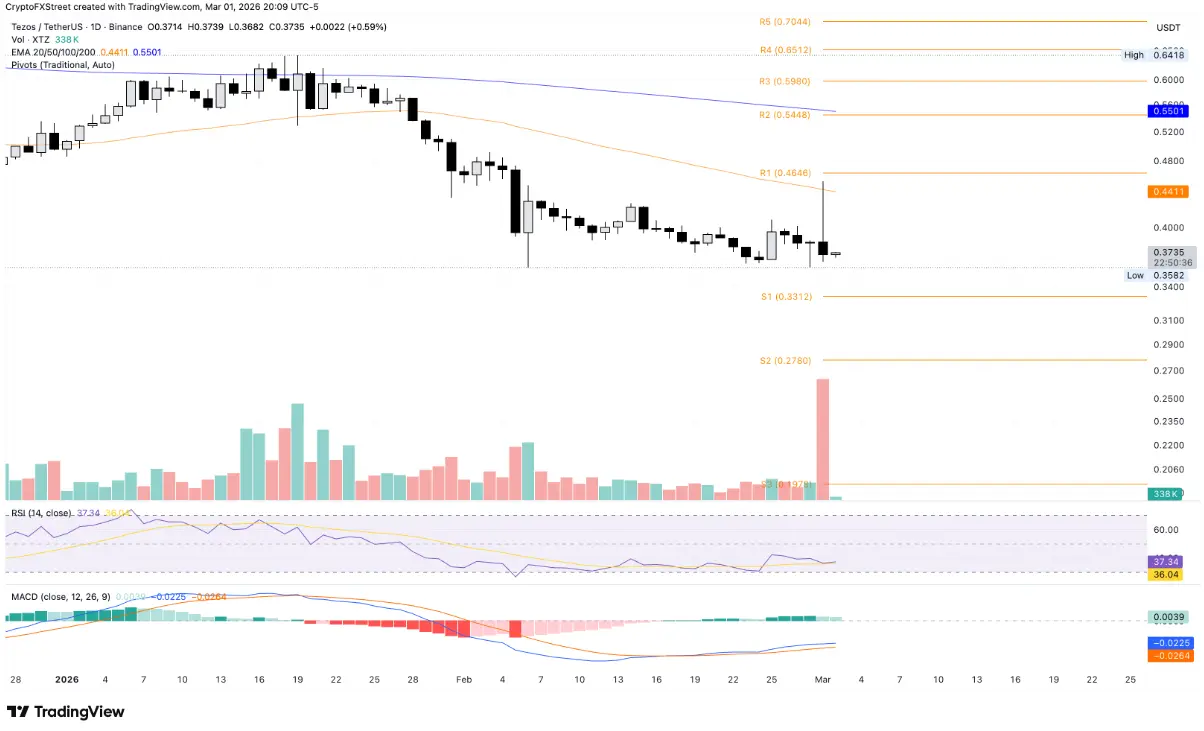 Daily XTZ/USDT Chart | Source: TradingView
On the daily chart, the MACD indicator remains in positive territory but has started to flatten, indicating weakening bullish momentum and an increasing risk of a bearish crossover with the signal line. Meanwhile, the RSI is at 37 and continues below the neutral level, suggesting that the bears still hold dominance in the market.
If XTZ loses the critical support zone near the recent low of $0.3582, the price is likely to fall further toward the Pivot S1 level around $0.3312.
On the upside, the nearest resistance is identified at the 50-day EMA, approximately at $0.4411.
Toncoin Signals Downside Risks
Toncoin continues its bleak streak, extending its decline into the second week, dropping more than 6% just on Sunday. On Monday, bargain hunters helped the price inch up by about 1%, temporarily stabilizing around $1.20 but not enough to change the overall picture.
From a technical standpoint, the short-term trend remains firmly bearish. The price stays below the 50-day EMA at around $1.43 and is well below the 200-day EMA, which is trending downward at around $1.96, indicating that downward pressure still dominates the overall trend.
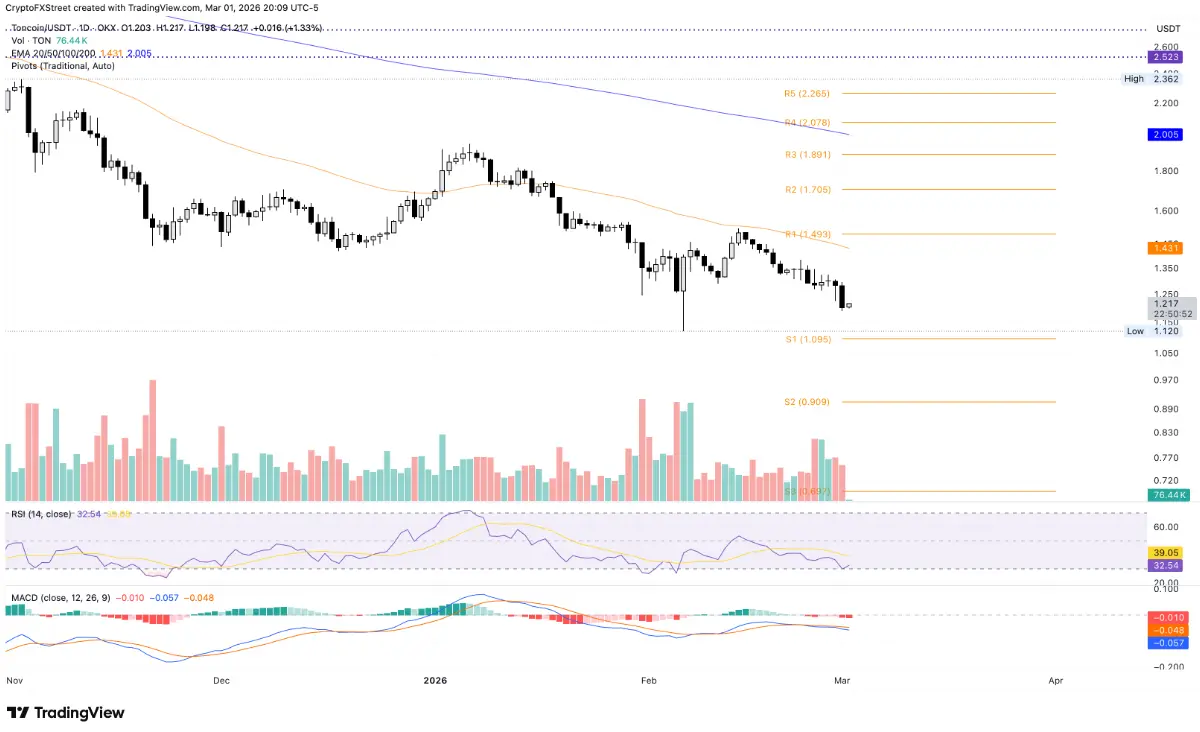 Daily TON/USDT Chart | Source: TradingView
Momentum indicators continue to signal negative outlooks. The MACD line has fallen further below the signal line and widened in the negative zone, reflecting accelerating downside momentum. Additionally, the RSI has dropped to 32, reinforcing the view that selling pressure has not yet eased.
In a negative scenario, the nearest support zone the price could test is the Pivot S1 level around $1.095.
Conversely, to establish a more sustainable recovery, Toncoin needs to regain the $1.30 level soon, opening the possibility to test the 50-day EMA at around $1.431.
Polkadot Holds Steady Near a Key Resistance Trend Line
Polkadot has gained about 3% at the time of writing on Monday, marking a notable rebound after nearly an 8% decline in the previous session. Currently, DOT is oscillating around the 50-day EMA at approximately $1.603, approaching the downward trend line connecting the highs on October 6 and January 13. This structure is part of a broadening wedge pattern on a higher timeframe, indicating the market remains in a consolidation phase.
 Daily DOT/USDT Chart | Source: TradingView
In terms of momentum, the MACD line remains above the signal line and above zero, while the RSI is around 55 — suggesting moderate buying strength and a slight upward short-term trend remains intact.
However, if a negative close occurs during the day, selling pressure could return, pushing the price toward the important support at Pivot S1 near $1.258.
In a more optimistic scenario, a decisive breakout above the upper trend line near $1.705 could open room for further gains, with the next target around $1.909.