Chiliz faces the "resistance wall": What internal strength keeps the rhythm for CHZ?
Chiliz (CHZ) makes an impressive surge in the past 24 hours, becoming one of the two assets to record double-digit growth, second only to Near Protocol (NEAR).
On the surface, the market is sending quite optimistic signals. Trading volume skyrocketed by 80%, reaching $80.41 million, while market capitalization also quickly approached the $400 million mark. These figures partly reflect a return of capital flow and significant interest in the token.
However, behind this enthusiastic rally, core technical indicators are warning that the current recovery could just be a misleading bounce, with short-term correction risks lurking.
Understanding Market Structure
On the weekly timeframe, the technical picture becomes clearer and more in-depth. At the time of writing, CHZ is still moving within a descending channel — a structure often seen as a precursor to a potential bullish reversal if confirmed signals appear.
Typically, this pattern only triggers a bullish scenario when the price decisively breaks above the upper boundary of the channel. After the breakout, the market tends to retest the breakout zone before establishing a more sustainable new trend.
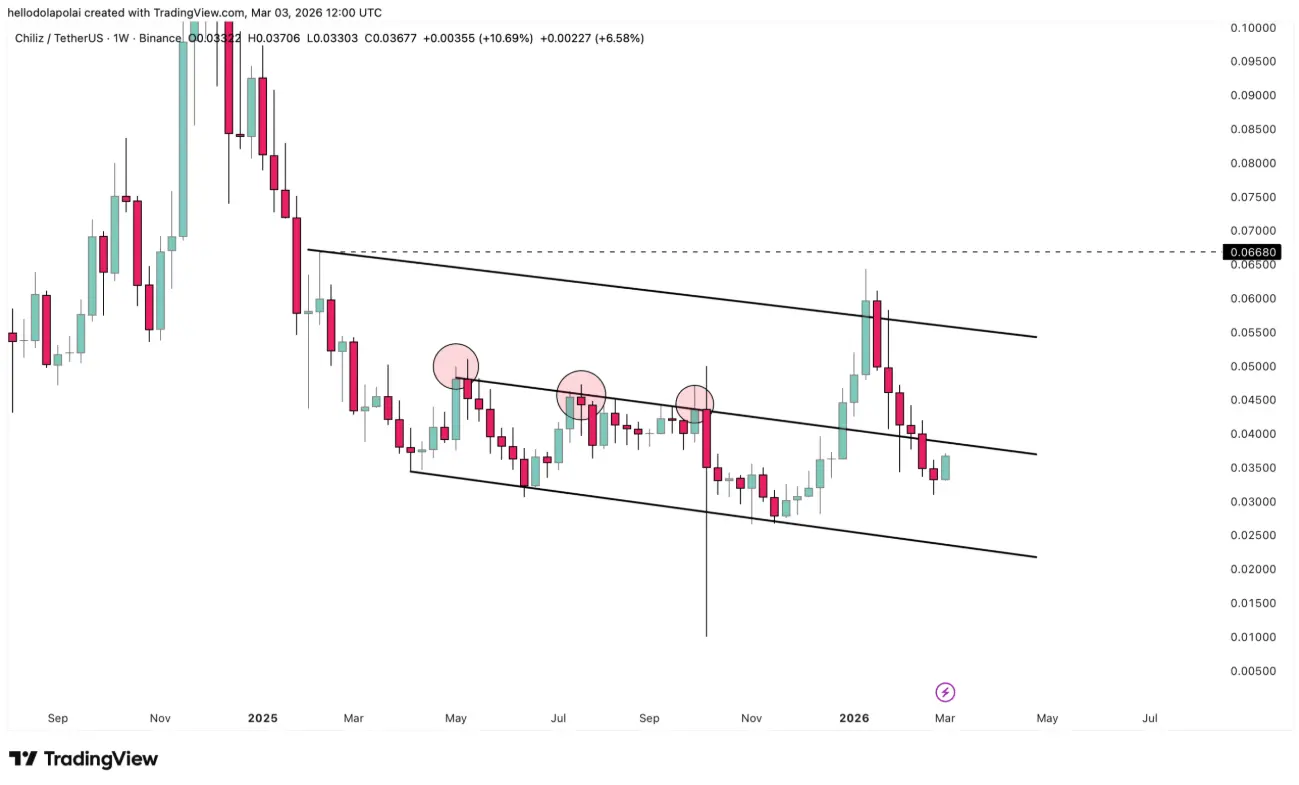 Weekly CHZ/USDT chart | Source: TradingView
For CHZ, the price has repeatedly approached the upper edge of the channel but continues to be blocked at the central resistance zone — an area that has repeatedly suppressed upward momentum. This is a critical “bottleneck” that will determine the next trajectory of the price.
Weekly CHZ/USDT chart | Source: TradingView
For CHZ, the price has repeatedly approached the upper edge of the channel but continues to be blocked at the central resistance zone — an area that has repeatedly suppressed upward momentum. This is a critical “bottleneck” that will determine the next trajectory of the price.
If buying pressure is strong enough to sustain momentum, CHZ could break through this barrier and move toward the upper boundary of the channel. Conversely, the repeated rejections in the past indicate ongoing risks of correction unless bulls demonstrate clear dominance in upcoming trading sessions.
Momentum Indicators Signal Caution
Weekly momentum indicators still do not fully support a sustainable breakout.
The MACD (Moving Average Convergence Divergence) indicator is signaling weakness with a bearish crossover, reflecting a clear decline in bullish momentum. Specifically, the MACD line has crossed below the signal line — a sign that bears are regaining control.
Historically, such crossovers often lead to prolonged corrections, especially when they occur near important resistance levels. The fact that CHZ is testing the upper resistance zone makes the negative MACD signal even more concerning.
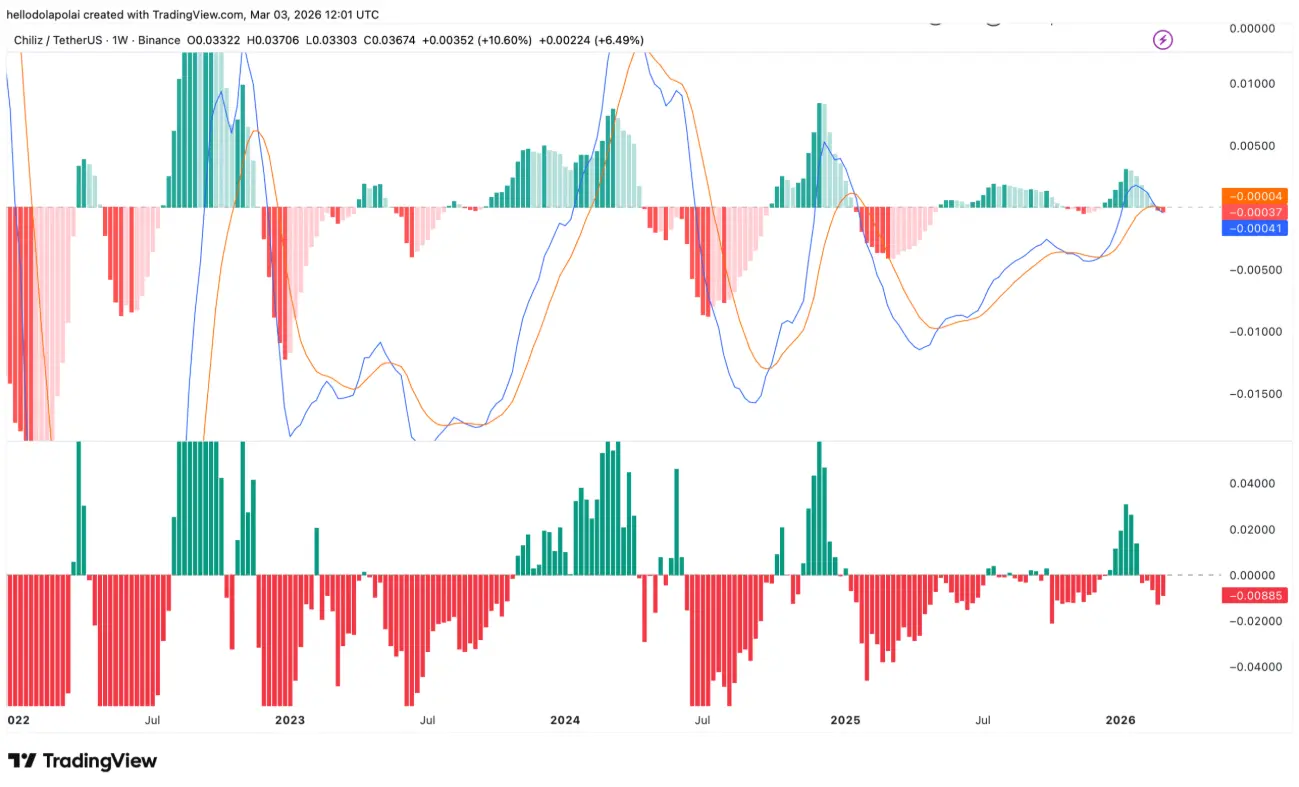 Weekly MACD and Bull Bear Power indicators for CHZ/USDT | Source: TradingView
Furthermore, the Bull Bear Power indicator shows consecutive red histogram bars, reinforcing the view that bears are in control. Continued selling pressure over multiple sessions increases the likelihood of a more pronounced correction.
Weekly MACD and Bull Bear Power indicators for CHZ/USDT | Source: TradingView
Furthermore, the Bull Bear Power indicator shows consecutive red histogram bars, reinforcing the view that bears are in control. Continued selling pressure over multiple sessions increases the likelihood of a more pronounced correction.
Overall, weakening momentum, resistance just above, and a short-term downtrend create risks of deeper correction for CHZ — despite its recent impressive gains.
Why the Rally Might Be a “Bull Trap”
CHZ’s rally is not solely driven by natural demand in the spot market. Derivatives data shows that most of the upward momentum stems from leveraged positions.
At the time of writing, open interest (OI) has surged to $44 million, indicating significant capital flowing into futures contracts. Notably, the volume of short positions liquidated in the past 24 hours has been high, suggesting many traders had to close their positions when the price moved against expectations — a factor that amplifies the rally.
The increase in OI alongside short liquidations typically signals that long positions are being heavily opened. In this context, new capital entering long contracts can create a “double leverage” effect, pushing buying pressure even higher.
The funding rate is currently at 0.0067%, meaning longs are paying fees to maintain their positions. This is clear evidence that market sentiment is leaning strongly toward short-term bullishness.
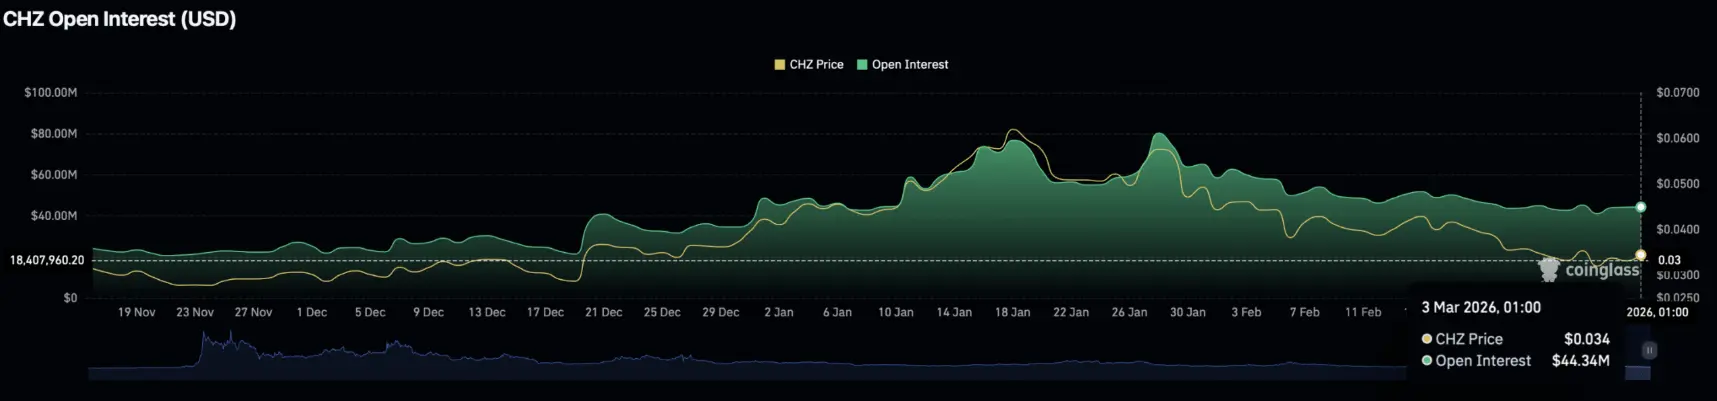 Open contracts of CHZ | Source: CoinGlass
However, when long positions become crowded near a key resistance zone, reversal risks also rise. If the price cannot decisively break through, the pressure from long liquidations could trigger a domino effect, leading to a rapid and sharp correction.
Open contracts of CHZ | Source: CoinGlass
However, when long positions become crowded near a key resistance zone, reversal risks also rise. If the price cannot decisively break through, the pressure from long liquidations could trigger a domino effect, leading to a rapid and sharp correction.
Overall, while CHZ shows short-term strength driven by derivatives market momentum, technical signals and resistance structures still call for caution. Without a clear breakout, the current rally could just be a “bull trap” rather than the start of a sustainable upward trend.