
Michael Saylor posted his signature “orange dot” buy-signal chart on the X platform on April 19, with the caption “Think Bigger.” MicroStrategy has raised $1.76 billion in reserve capital through financial instruments such as STRC preferred stock. The company’s treasury currently holds 780,897 bitcoins at an average cost of $75,577 per coin.
Decoding the Orange Dot Signal: “Think Bigger” Hints at the Largest Purchase Scale in History
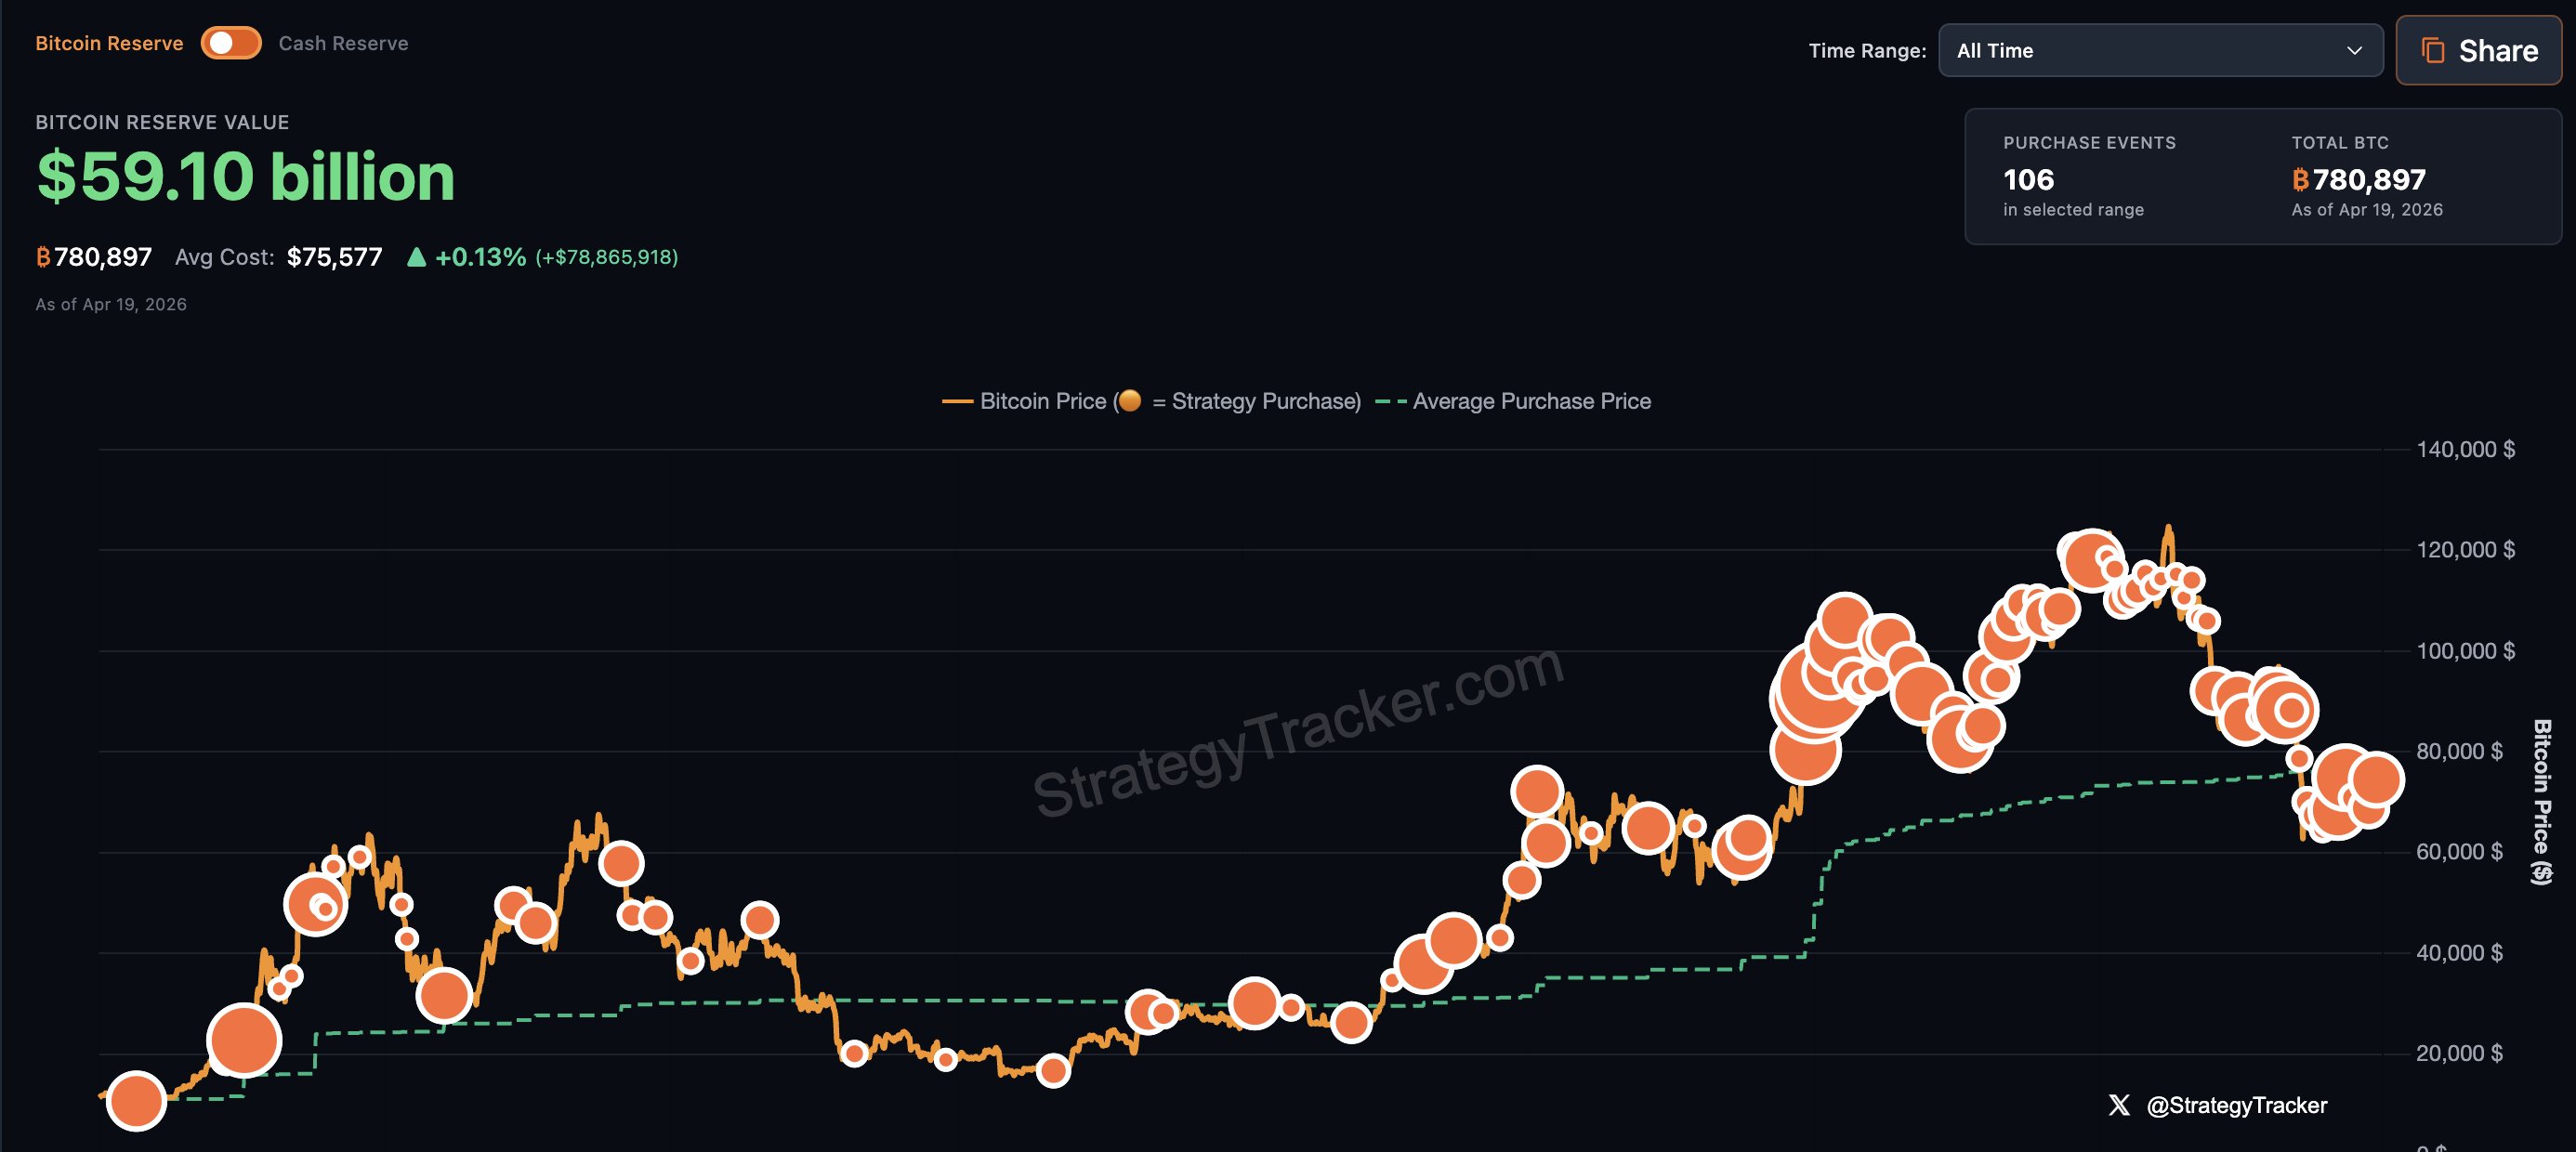
(Source: Strategy Tracker)
The reliability of the orange dot signal is built on a clear record of recent actions. On April 13, MicroStrategy bought $1 billion worth of bitcoin; just the week before, it spent $330 million again—both purchases were completed within 48 hours after the orange dot chart was published.
Saylor has never added any text commentary in his prior orange dot posts. The appearance of “Think Bigger” has led analysts to expect that the next purchase size will exceed any previous one. MicroStrategy’s purchase announcements are typically released on Mondays, so April 20 (Monday) has become a key point for the crypto market to watch.
Where the Funds Come From: STRC Tools and MicroStrategy’s Financing Flywheel
MicroStrategy’s bitcoin acquisition funding does not rely on business revenue, but instead uses leverage mechanisms in the capital markets. The company raises funds by issuing STRC preferred stock and other capital-market instruments, then deploys the proceeds directly into bitcoin purchases. According to financing-tracking data, it has already raised $1.76 billion in usable funds; Saylor calls it a “war fund,” ready to be deployed at any time. This model has been validated by the recent $1 billion purchase.
Bitcoin Market Backdrop: BTC’s Market Share Breaks Through Key Technical Resistance
Another market signal further reinforces the timing assessment. Bitcoin’s market capitalization share (BTC.D) broke through a key resistance level on the 3-day chart. Analysts note that such breakouts in BTC.D are typically accompanied by a rotation of capital flowing from altcoins into bitcoin—an advantageous timing backdrop for MicroStrategy, which is preparing for large-scale bitcoin buying.
Frequently Asked Questions
What is MicroStrategy’s “orange dot” signal, and how reliable is it historically?
The orange dot signal is a chart that Saylor has regularly posted on X since 2020, with each orange dot representing a bitcoin purchase record by MicroStrategy. The pattern of purchase announcements appearing within 48 hours after an orange dot chart is published has been verified multiple times, making it an important indicator for the crypto community to track MicroStrategy’s acquisition activity. The added “Think Bigger” commentary is the first time text has been attached since the orange dot signal began appearing.
How does MicroStrategy keep buying bitcoin without relying on business profits?
MicroStrategy uses a “bitcoin treasury company” model: it raises funds through the capital markets using instruments such as preferred stock (like STRC) and convertible bonds, and then deploys the funds into bitcoin purchases—without relying on traditional corporate operating cash flows. The treasury currently holds 780,897 bitcoins at an average cost of $75,577, for a total position value of about $58 billion, making it the largest institutional bitcoin holder in the world.
Why is April 20 a key checkpoint for the crypto market?
Historically, MicroStrategy typically announces its bitcoin purchase plan on Mondays. But on April 19 (Sunday), Saylor published the orange dot chart, aligning with the existing 48-hour pattern. If the purchase announcement appears as expected—combined with the unusual-scale implication of “Think Bigger”—it could generate a significant catalytic effect on the bitcoin spot market and institutional sentiment.
Disclaimer: The information on this page may come from third parties and does not represent the views or opinions of Gate. The content displayed on this page is for reference only and does not constitute any financial, investment, or legal advice. Gate does not guarantee the accuracy or completeness of the information and shall not be liable for any losses arising from the use of this information. Virtual asset investments carry high risks and are subject to significant price volatility. You may lose all of your invested principal. Please fully understand the relevant risks and make prudent decisions based on your own financial situation and risk tolerance. For details, please refer to
Disclaimer.
Related Articles
BTC rose 0.56% in 15 minutes: trading volume surges and buy-side dominance drives a spot rebound
From 07:15 to 07:30 on April 20, 2026 (UTC), BTC achieved a +0.56% short-term return in mainstream markets. The price range touched 74718.5 - 75568.1 USDT, and the 15-minute intraday swing reached 1.14%. In this phase, market attention warmed up, trading activity rose noticeably, and overall volatility increased.
The main driver behind this deviation is that for mainstream trading pairs such as BTC/USDT, the 15-minute trading volume increased month-over-month to +15%, forming a buy-side dominant pattern that pushed spot prices upward to break higher. Inflows directly drove the short-term upside. On-chain data shows that large BTC transfers were dispatched to new wallets in a structured, staged manner, with no concentrated sell pressure flowing to trading platforms. This releases a rebalancing signal rather than a sell signal, which helps ease short-term sell pressure. The chain
GateNews56m ago
ETH jumps 1.22% in 15 minutes: DeFi segment activity and trading volume surge resonate to drive the move
2026-04-20 07:15 to 07:30 (UTC), ETH’s short-term return reached +1.22%. The price range spanned from 2285.19 to 2332.62 USDT, with a 2.07% amplitude. During this period, market attention heated up, volatility noticeably intensified. On-chain transaction volume rose in tandem, and key mainstream on-chain activity indicators expanded significantly on a month-over-month basis.
The primary driver of this deviation was an increase in transaction activity related to DeFi protocols, which boosted the share of on-chain Gas consumption. At the same time, total on-chain transaction volume saw a sharp surge in a short time. DeFi scenarios such as decentralized exchanges and lending protocols led to a direct surge in demand for ETH, driving funds to flow quickly into the market. In addition, the average Gas fees and Gas prices on the ETH network continued to climb in this window, further validating that high-frequency trading and active capital were accelerating into the market and strengthening short-term bullish sentiment.
Second, on-chain data also showed an expansion in liquidity related to stablecoins and ERC20 assets, strengthening market buy-side power. Although historical large-wallets such as Wilcke still held a large amount of ETH after early March, this cycle did not trigger abnormal transfers or large-scale sell-offs. Meanwhile, the positioning structure of mainstream ETH did not show passive deleveraging or concentrated liquidation. Under the combined effects of multiple factors, global buy-side demand was amplified, and short-term ETH volatility was further elevated.
Be alert to the risk of capital sustainability after a surge in high-frequency trading volume and Gas fees. If subsequent incremental buying is lacking or on-chain attention cools down, ETH may face short-term pullback pressure. Monitor changes in large-holder positions, any abnormal shifts in network fees, and liquidity volatility on the DeFi protocol chain. While there have been no signs of security incidents involving major contracts and protocols so far, short-term liquidity disturbances still need close observation. Keep monitoring fund flows and on-chain structure to stay informed about subsequent market changes.
GateNews57m ago
Suspected RAVE Manipulation Address Deposits $10.67M to Major CEX in Latest Transfer
A suspected manipulation address transferred 20 million RAVE tokens, worth about $10.67 million, to a central exchange. Today, it has moved a total of nearly 43 million RAVE tokens, valued over $34.97 million.
GateNews57m ago
Stablecoin Liquidity Surge Signals Potential Bitcoin Rally, Analyst Says
Tether's market cap has increased by $40 million, reaching $187 billion, and recent stablecoin circulation has added $3 billion. This reflects improved liquidity conditions, potentially signaling a price rally for Bitcoin if the trend continues.
GateNews1h ago
Bitcoin ETFs posted net inflows for a third consecutive week; last week saw $996 million, the highest since January.
Last week, spot Bitcoin ETF net inflows reached $996 million, the highest level since 2026, marking net inflows for three consecutive weeks, which is related to easing tensions between the U.S. and Iran. BlackRock’s IBIT led the way, pulling in $906 million. Spot Ethereum ETFs also performed, with Fidelity’s FETH attracting $126 million. The market needs to watch how the U.S.-Iran agreement and the Federal Reserve’s rate cuts affect ETF capital flows to determine the direction of ETF fund flows.
MarketWhisper4h ago
LayerZero Strategic Partner Wallet Distributes 1.21M ZRO, with 855K Transferred to Major CEX
LayerZero's partner wallet recently distributed 1.21 million ZRO (around $1.97 million) to 52 addresses, with the largest transfer of 855,000 ZRO (about $1.42 million) to a significant centralized exchange.
GateNews4h ago
