The price of Solana (SOL) has been going through a challenging phase in recent weeks. The rise of Bitcoin (BTC) to the $76,000 mark on March 17 helped SOL break out of a sideways range that had lasted since early February, thus triggering expectations for a new upward trend.
This breakout was accompanied by a noticeable improvement in momentum and trading volume, reinforcing market confidence in the potential for continued gains. However, the subsequent developments showed conflicting signals: the inability to maintain above the peak of $89.9 of the range soon revealed underlying bearish pressure.
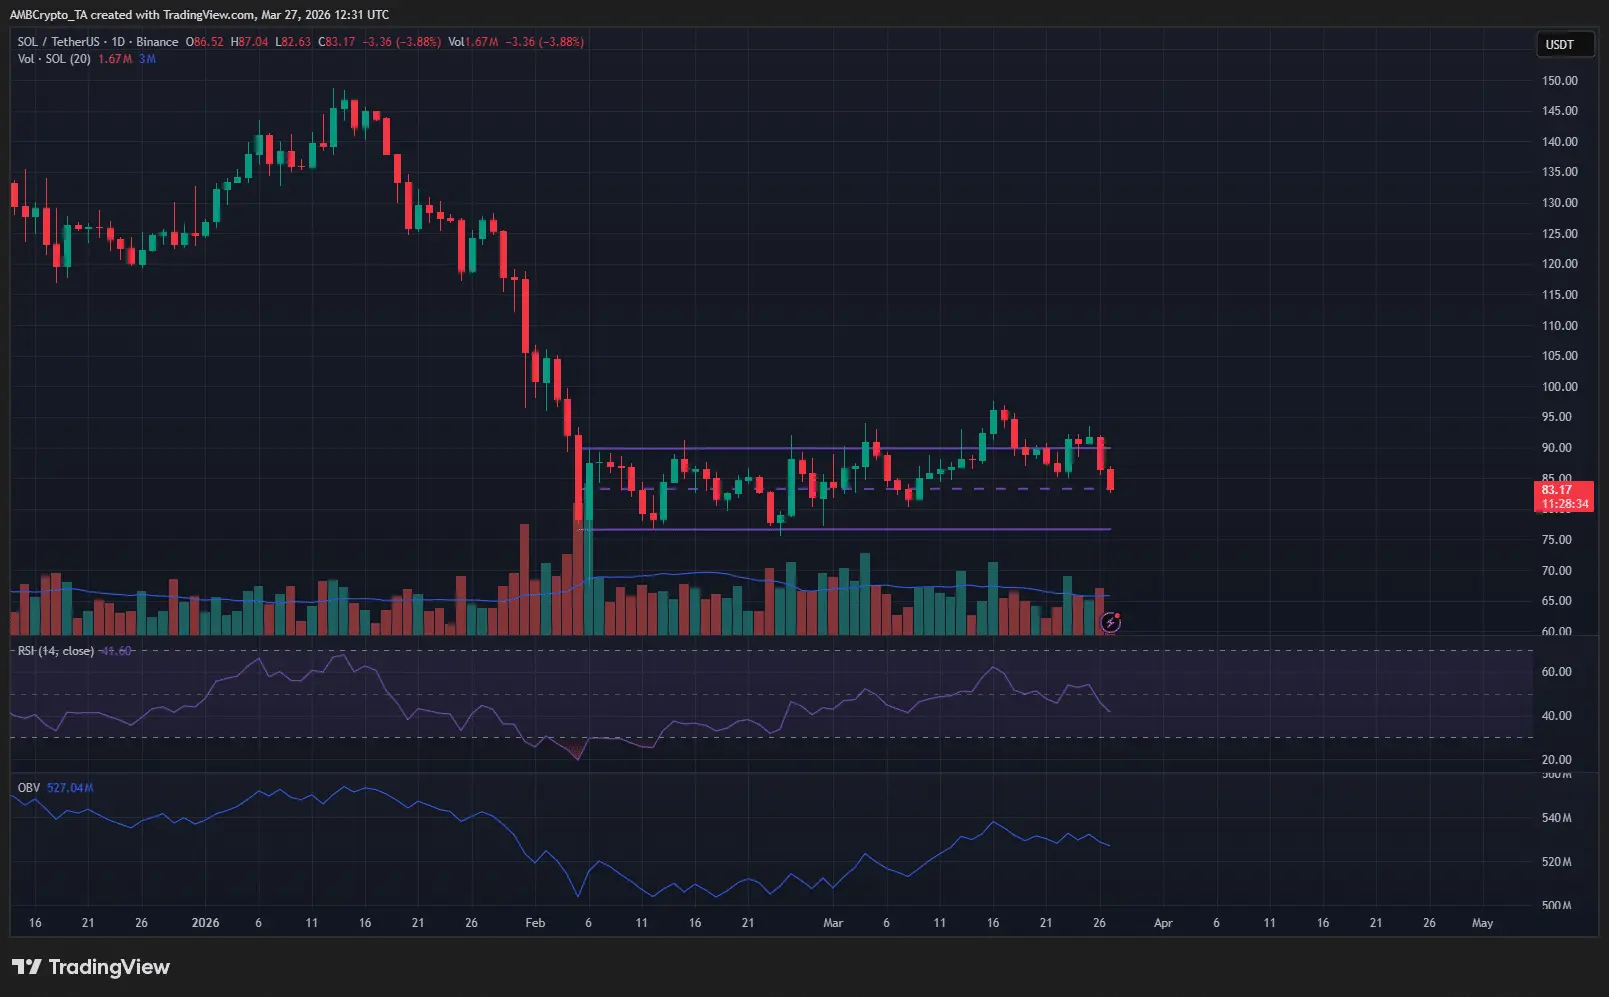 Source: TradingViewOn the daily timeframe, the previous sideways structure was confirmed to be merely an accumulation phase following a strong downtrend. Although the OBV recorded an upward trend – reflecting accumulation activity – and the RSI remained above the neutral threshold of 50, indicating that upward momentum has not completely weakened, the overall picture remains less than positive. Notably, the supply zone of $105–120 continues to be a major barrier to any recovery efforts.
In fact, the most recent upward move couldn’t even conquer the $100 mark before the price retraced back to the median area of the range. This raises an important question: can SOL bounce back from here, or is a deeper breakdown forming?
Currently, the sideways price range of SOL is identified between $76.6 and $89.9, with a balance point at $83.3. The price is trading slightly below this level, amidst a backdrop of technical indicators leaning toward a bearish trend.
Specifically, the DMI on the 4-hour chart shows that the bearish trend is dominant, while the RSI is approaching the oversold zone – a sign that selling pressure has yet to be alleviated. At the same time, the OBV is at risk of setting a new local bottom, reflecting continued outflows over the past 10 days.
While the possibility of a bounce from the support area within the range cannot be ruled out, according to trading principles in a sideways market, optimal entry points typically lie at the two extremes of the range to maximize the risk/reward ratio. Therefore, opening a buy position at the median area – especially in the context of weakened market sentiment – is a less convincing option.
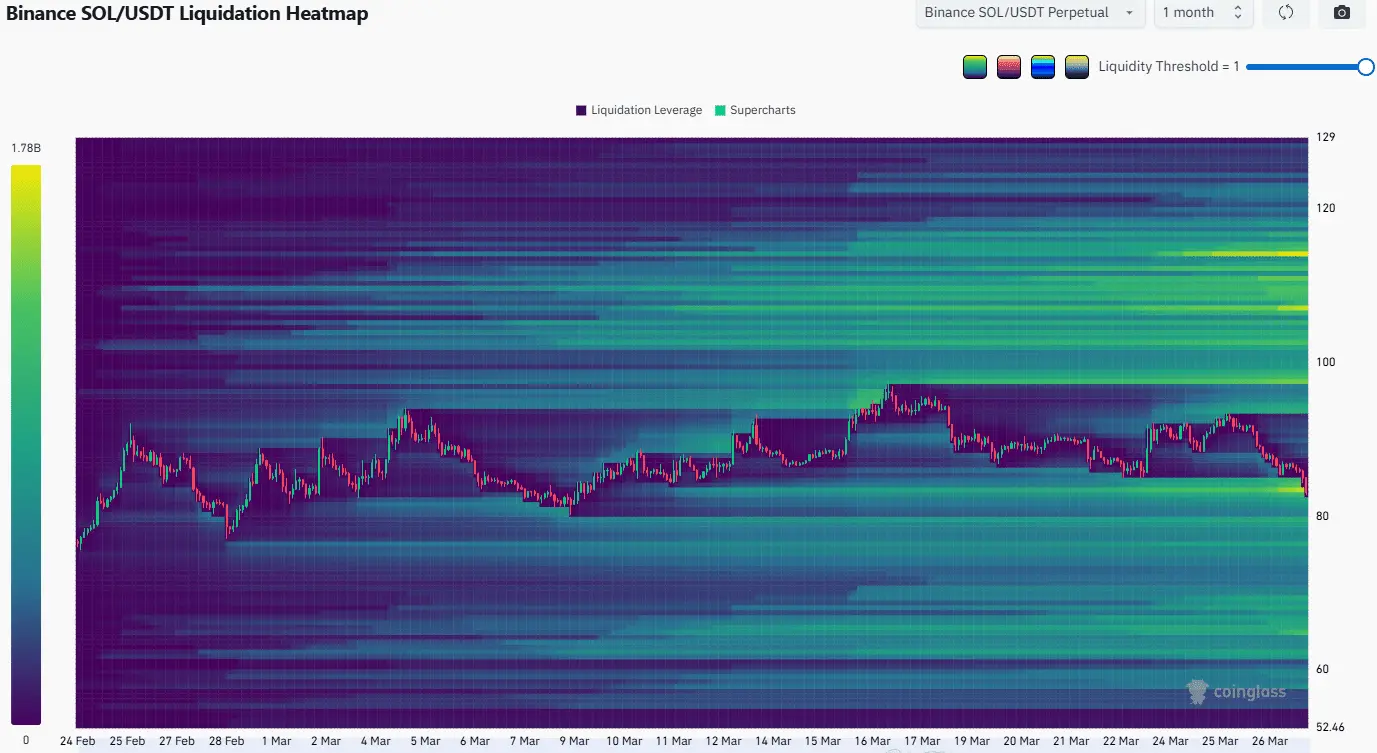 Source: CoinGlassNotably, Bitcoin’s “long squeeze” down to the $66,500 area pulled SOL into the liquidity zone around $83. Below, the $79 area – just beneath the bottom of $80.2 established on March 8 – continues to be a potential long liquidation cluster.
In the short term, the market needs to see the price recover and maintain above the $83–85 range to confirm the return of buying power. If this scenario occurs, SOL may extend the bounce to the $94–98 area, where liquidity for short positions is concentrated.
Disclaimer: The information on this page may come from third parties and does not represent the views or opinions of Gate. The content displayed on this page is for reference only and does not constitute any financial, investment, or legal advice. Gate does not guarantee the accuracy or completeness of the information and shall not be liable for any losses arising from the use of this information. Virtual asset investments carry high risks and are subject to significant price volatility. You may lose all of your invested principal. Please fully understand the relevant risks and make prudent decisions based on your own financial situation and risk tolerance. For details, please refer to
Disclaimer.
