Trade
Basic
Futures
Futures
Hundreds of contracts settled in USDT or BTC
Options
HOT
Trade European-style vanilla options
Unified Account
Maximize your capital efficiency
Demo Trading
Futures Kickoff
Get prepared for your futures trading
Futures Events
Participate in events to win generous rewards
Demo Trading
Use virtual funds to experience risk-free trading
Earn
Launch
CandyDrop
Collect candies to earn airdrops
Launchpool
Quick staking, earn potential new tokens
HODLer Airdrop
Hold GT and get massive airdrops for free
Launchpad
Be early to the next big token project
Alpha Points
NEW
Trade on-chain assets and enjoy airdrop rewards!
Futures Points
NEW
Earn futures points and claim airdrop rewards
Investment
Simple Earn
Earn interests with idle tokens
Auto-Invest
Auto-invest on a regular basis
Dual Investment
Buy low and sell high to take profits from price fluctuations
Soft Staking
Earn rewards with flexible staking
Crypto Loan
0 Fees
Pledge one crypto to borrow another
Lending Center
One-stop lending hub
VIP Wealth Hub
Customized wealth management empowers your assets growth
Private Wealth Management
Customized asset management to grow your digital assets
Quant Fund
Top asset management team helps you profit without hassle
Staking
Stake cryptos to earn in PoS products
Smart Leverage
NEW
No forced liquidation before maturity, worry-free leveraged gains
GUSD Minting
Use USDT/USDC to mint GUSD for treasury-level yields
More
January 21 | BTC Trend Analysis
Key Points
Current Price: $88,830 (as of January 21, 09:48)
Short-term Outlook: Technical indicators suggest a short-term bearish bias, but oversold signals are evident. There is a 60% probability of a rebound above $90,000 within 24-48 hours.
Key Support Levels:
Key Resistance Levels:
Market Background
Macro Environment
The current market is undergoing a risk-averse correction. Trump’s threat to impose a 10% tariff on 8 European countries (rising to 25% in June), along with geopolitical tensions in Greenland, has triggered a “sell US” trade, with funds flowing into gold safe-haven assets. The Japanese bond market’s 6-sigma volatility further amplifies global market volatility.
Despite short-term pressures, institutional interest remains strong. MicroStrategy recently purchased 22,305 BTC at an average price of $95,284, with a total holding of 709,715 BTC; US Treasury confirms plans to include BTC in government digital asset reserves; potential launch of Japanese ETFs could bring additional inflows.
Derivatives Market
Futures open interest totals $60.5B, down 0.97% in 24 hours, indicating reduced leverage. Funding rates are slightly positive (0.01%), with longs paying shorts modestly, suggesting limited leverage pressure.
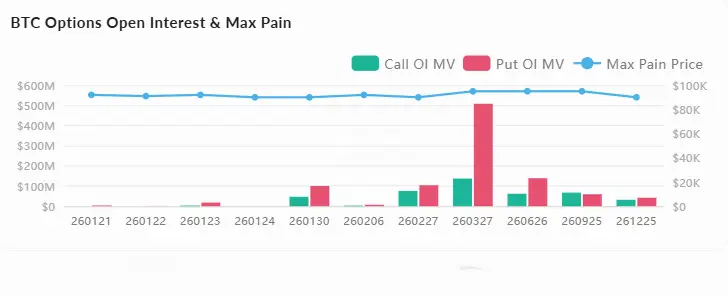
Total options open interest is $36.8B, up 3.72% in 24 hours. The maximum pain point for contracts expiring between January 21-30 is concentrated in the $90,000-92,000 range, exerting gravitational pull on the price.
24-hour liquidation volume is $440M, with longs liquidating $427M versus $13M for shorts, confirming downside pressure from long squeezes. Below current price, $88,615 sees $170M in long liquidations; at $86,077, over $700M. Above, $91,717 in short liquidation risk reaches $1.3B, indicating asymmetric downside risk.
On-chain Dynamics
On January 20, exchange net inflow was 9,867 BTC, indicating potential selling pressure concentrated on trading platforms. Exchange reserves decreased from 2,743K on January 14 to 2,728K on January 20, showing a downward trend and reflecting long-term holder accumulation.
Large transfers active: a wallet from the Satoshi era (cost basis $13-250) dormant for 12 years transferred out 909 BTC ($84.6M) on January 20; multiple unknown wallets transferred between 1,500-1,572 BTC, totaling over $400M, warranting follow-up.
Social Sentiment
Social media sentiment remains bullish overall, with discussions focusing on ETF inflows (BTC products continue to attract funds while ETH outflows), regulatory positives (US Congress advancing BTC tax legislation into strategic reserves), and institutional adoption (Fidelity and Schwarz providing BTC allocation services).
Opinion leaders like Michael Saylor continue to promote Bitcoin as the foundation of digital capital; CoinBureau cites Schwarz’s view that clarity in regulation and Fed easing by 2026 will pave the way for BTC. Mainstream narratives highlight the 2025 red line as a historic first but misaligned with liquidity cycles, expecting a reversal in 2026.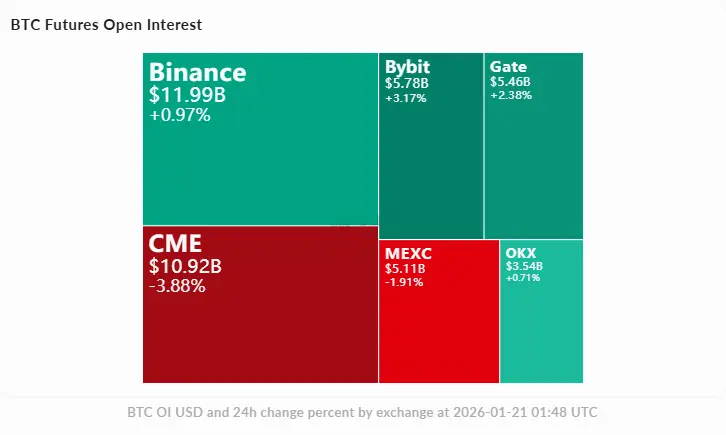
Multi-timeframe Indicators
1-Hour Level (Short-term trading reference)
4-Hour Level (Intraday trend assessment)
Daily Level (Medium-term direction)
Trading Strategy
Bullish Scenario (60% probability)
Bearish Scenario (40% probability)
Risk Warning