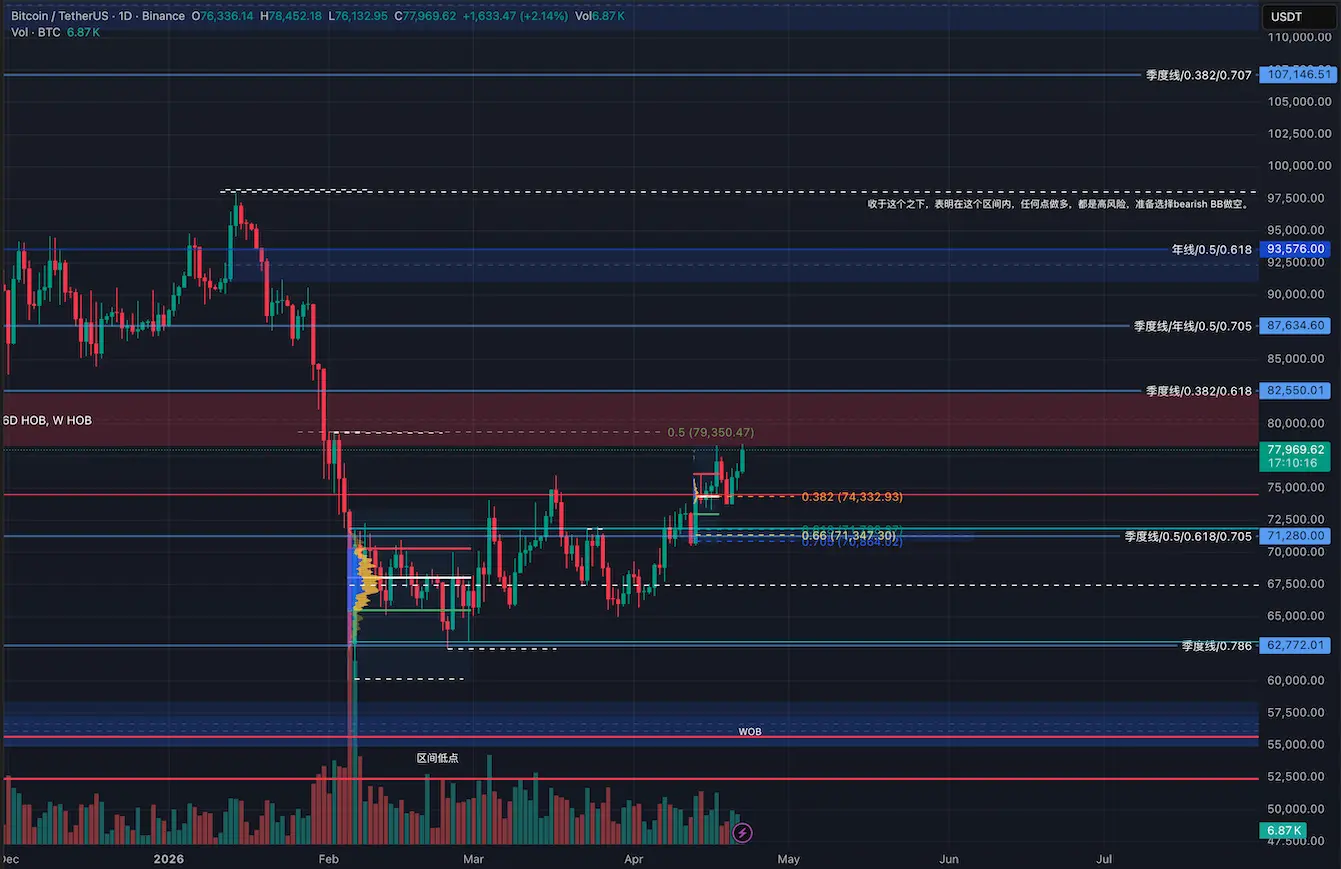
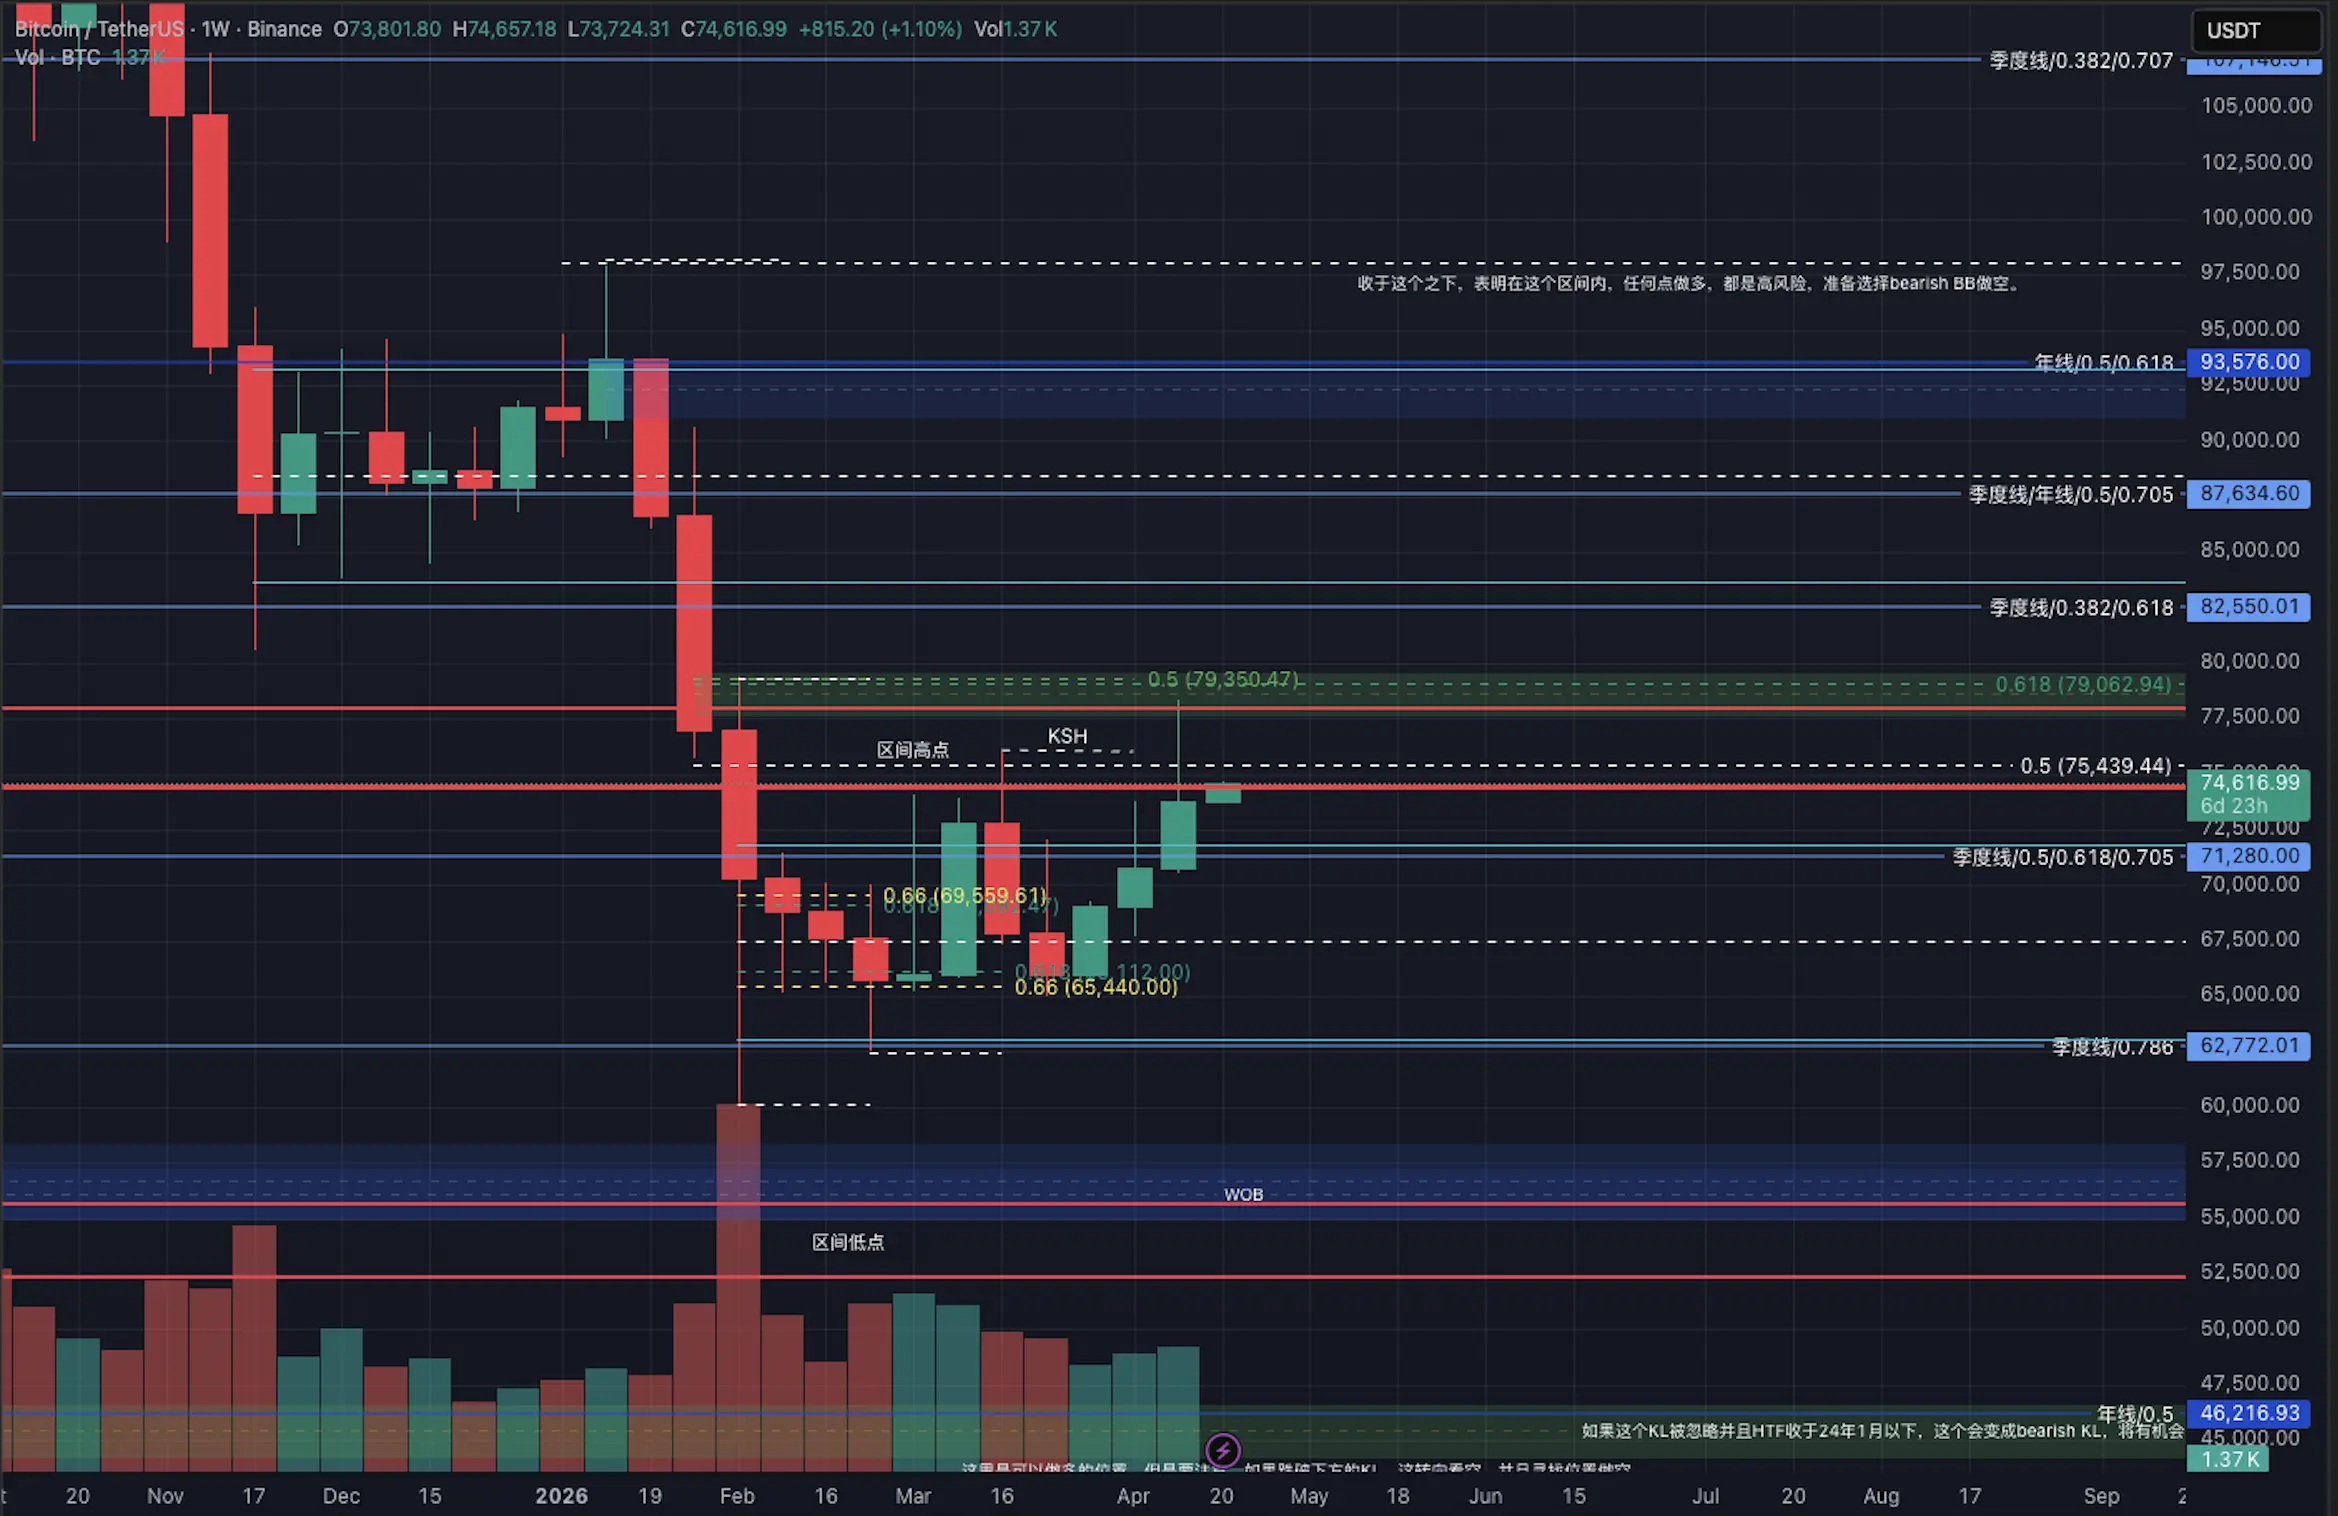
Weekly Line Analysis:
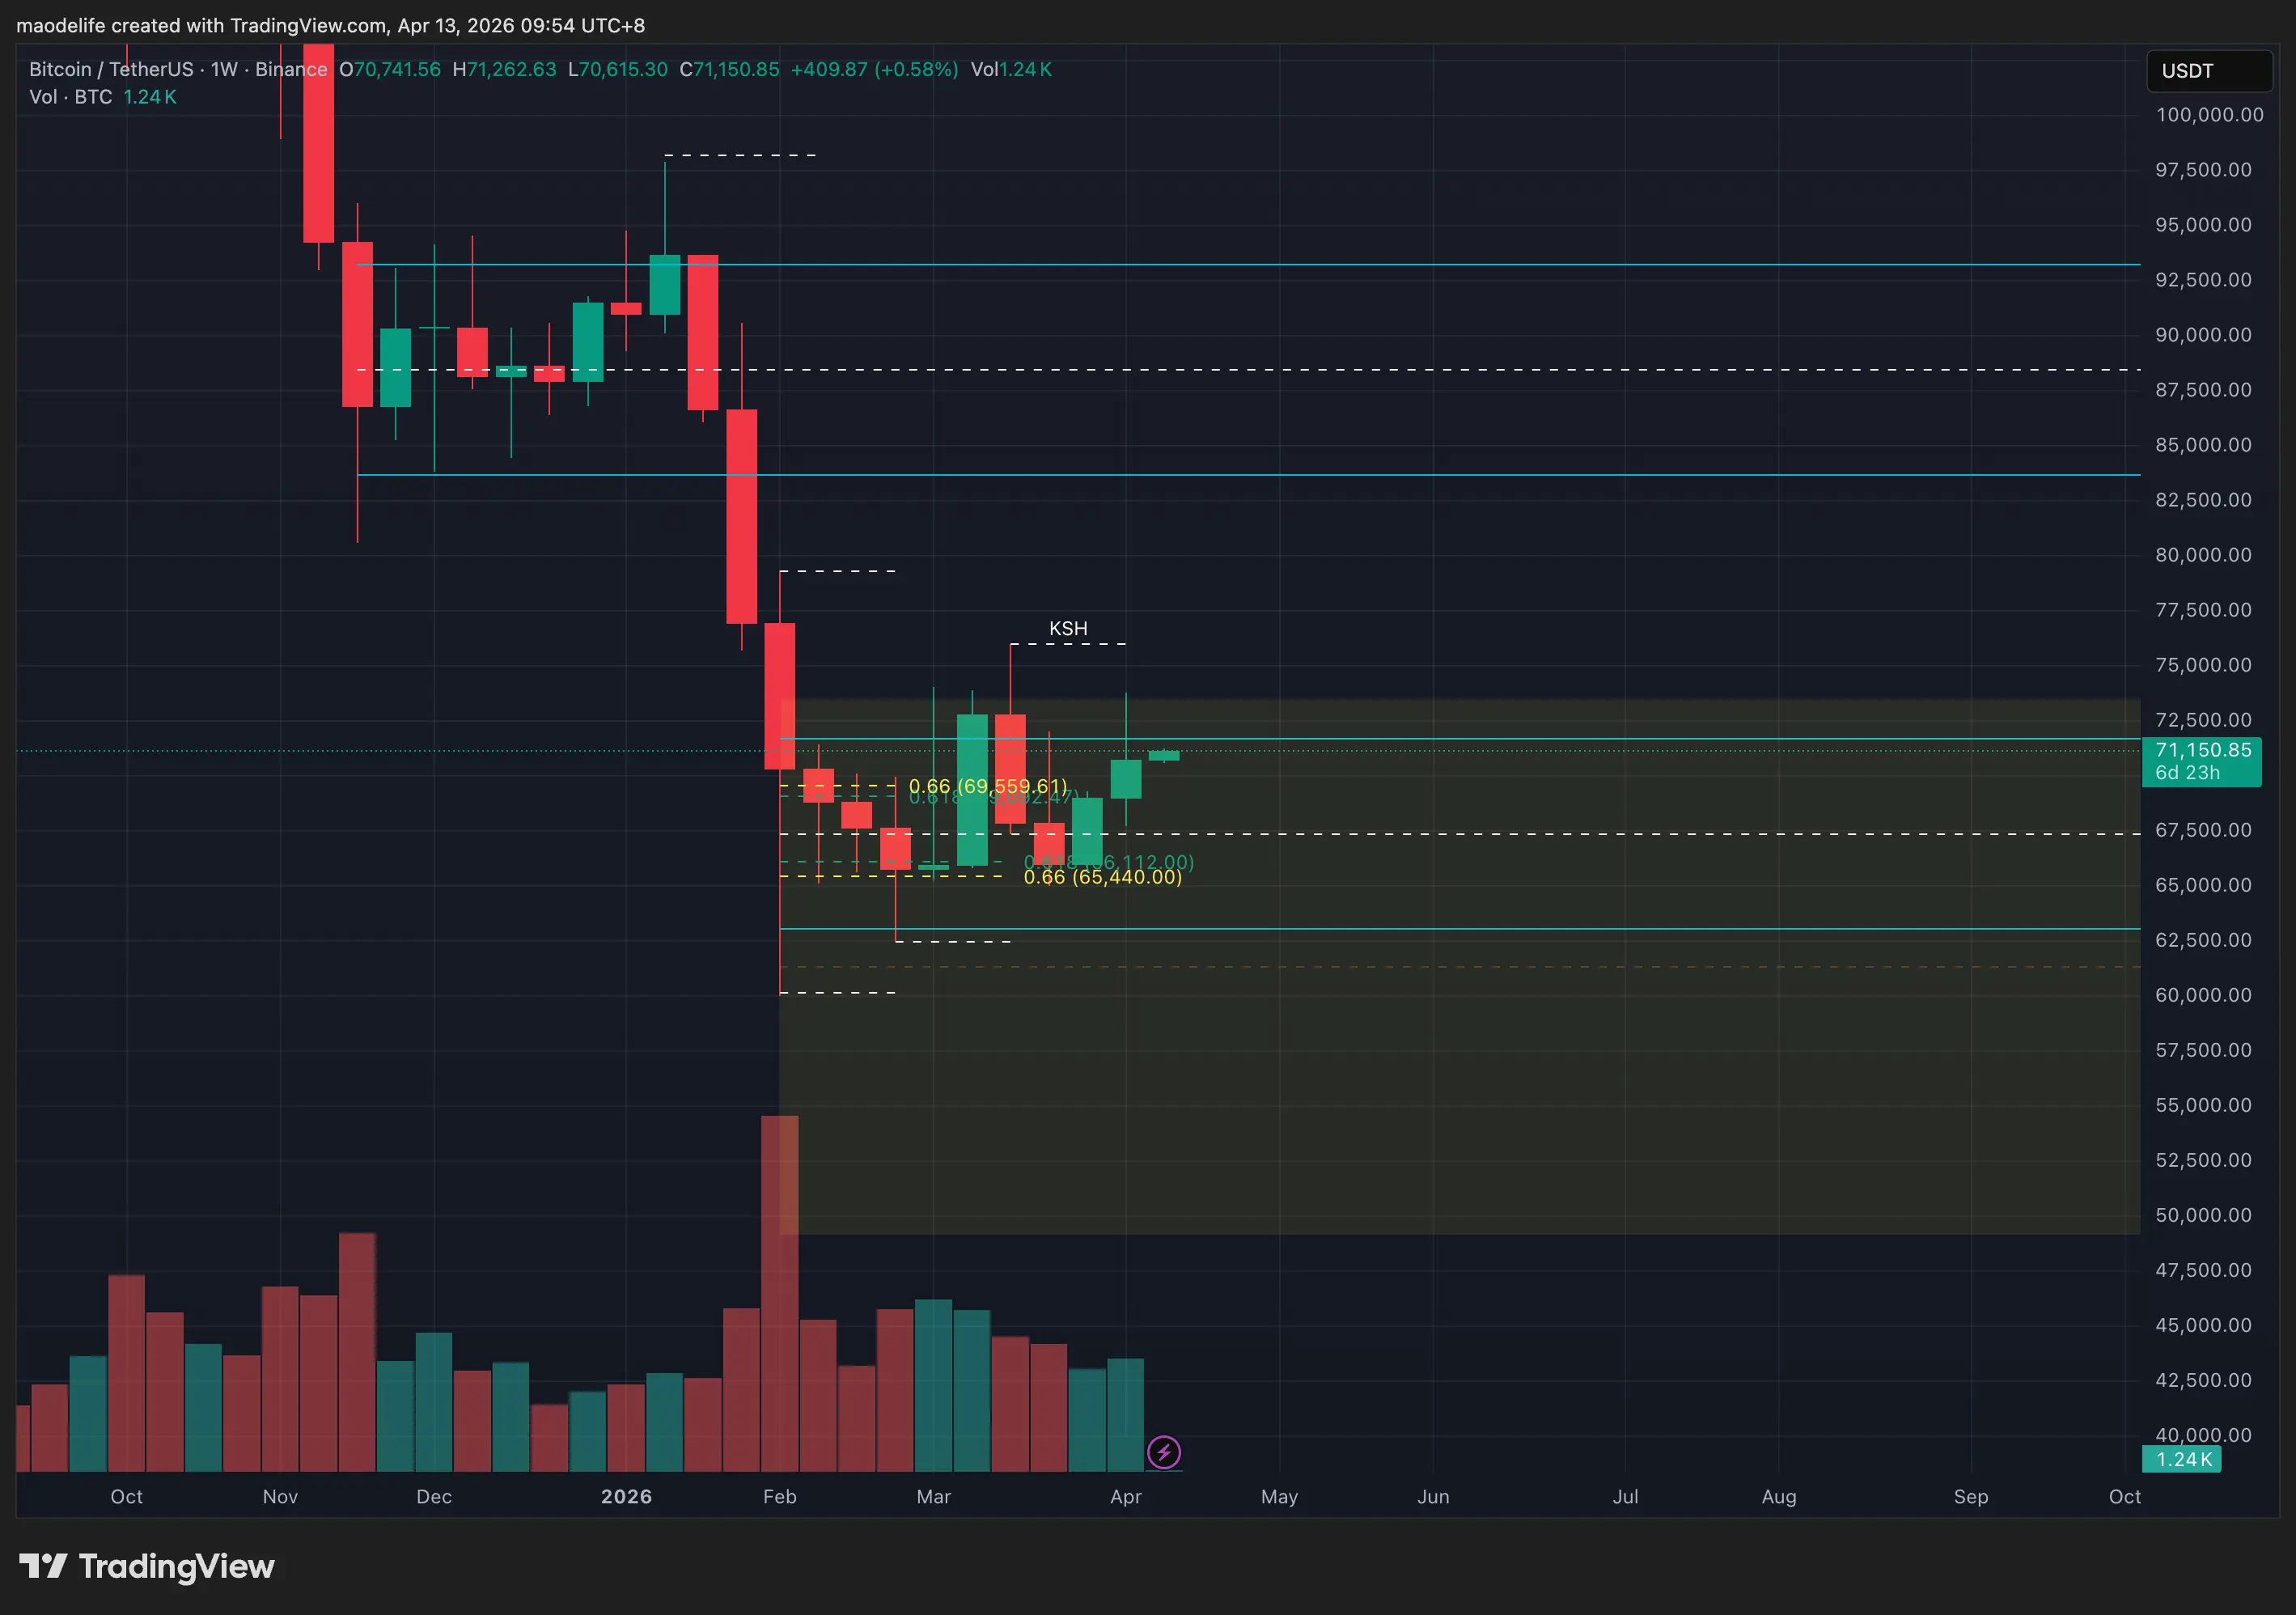
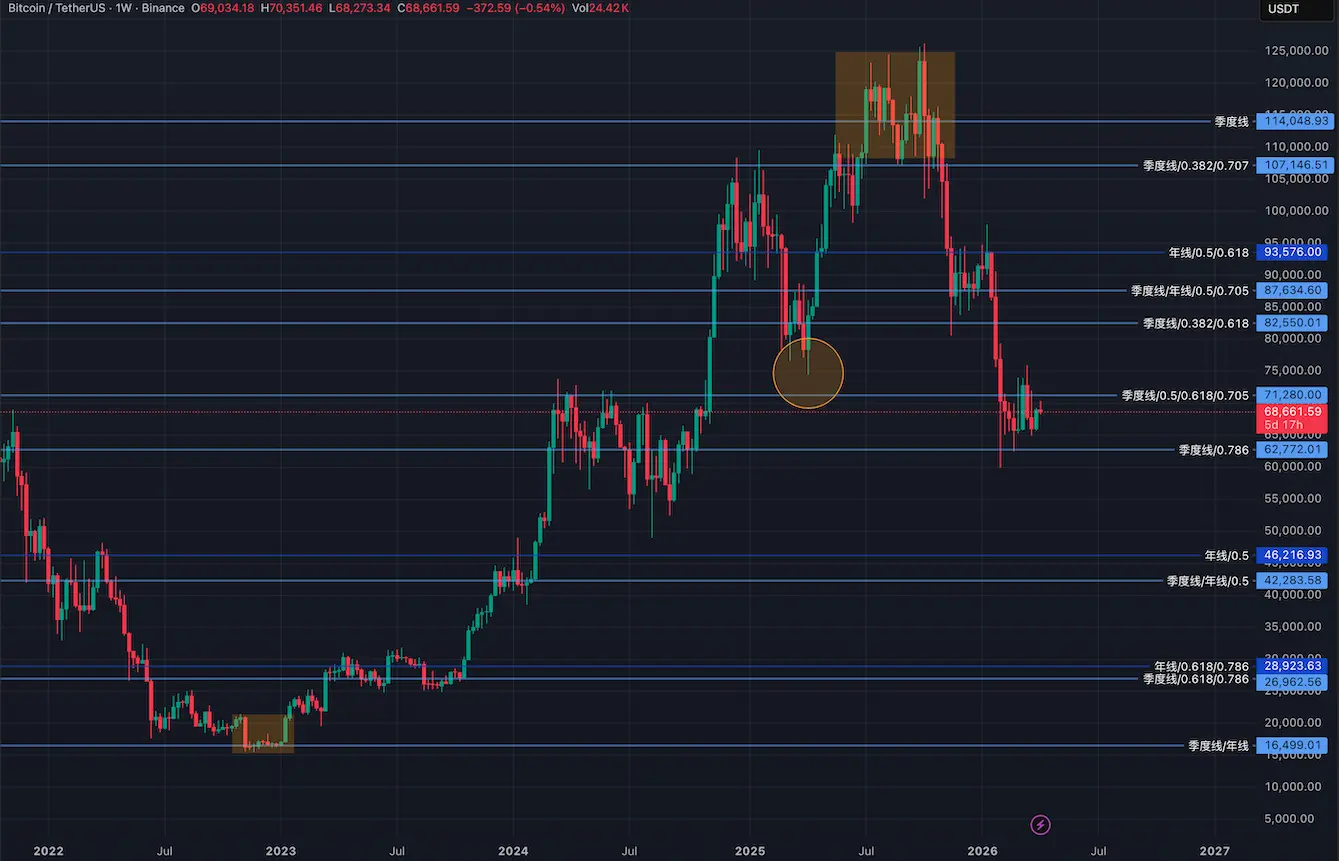
Last week's high point in the range was once again a false breakout
$BTC .
Indicating that in the context of a bear market, upward movement is more likely to fail or only be a short-term rally.
Trading within the range should be cautious, as the market is heavily influenced by geopolitical factors, with high volatility, and range trading often results in stop-outs.
Scenario 1: The key point above is the previous high SH (76K), where there is a large amount of liquidity.
Scenario 2: The rally is blocked, and after retesting the range high (71690), it continues to decline.
If the market moves upward, it will most likely need to first acquire the two key liquidity points below.
Key liquidity point 1: 62471
Key liquidity point 2: 60118
After acquiring these two critical liquidity points and then performing a false breakdown, the market could see a strong upward wave.
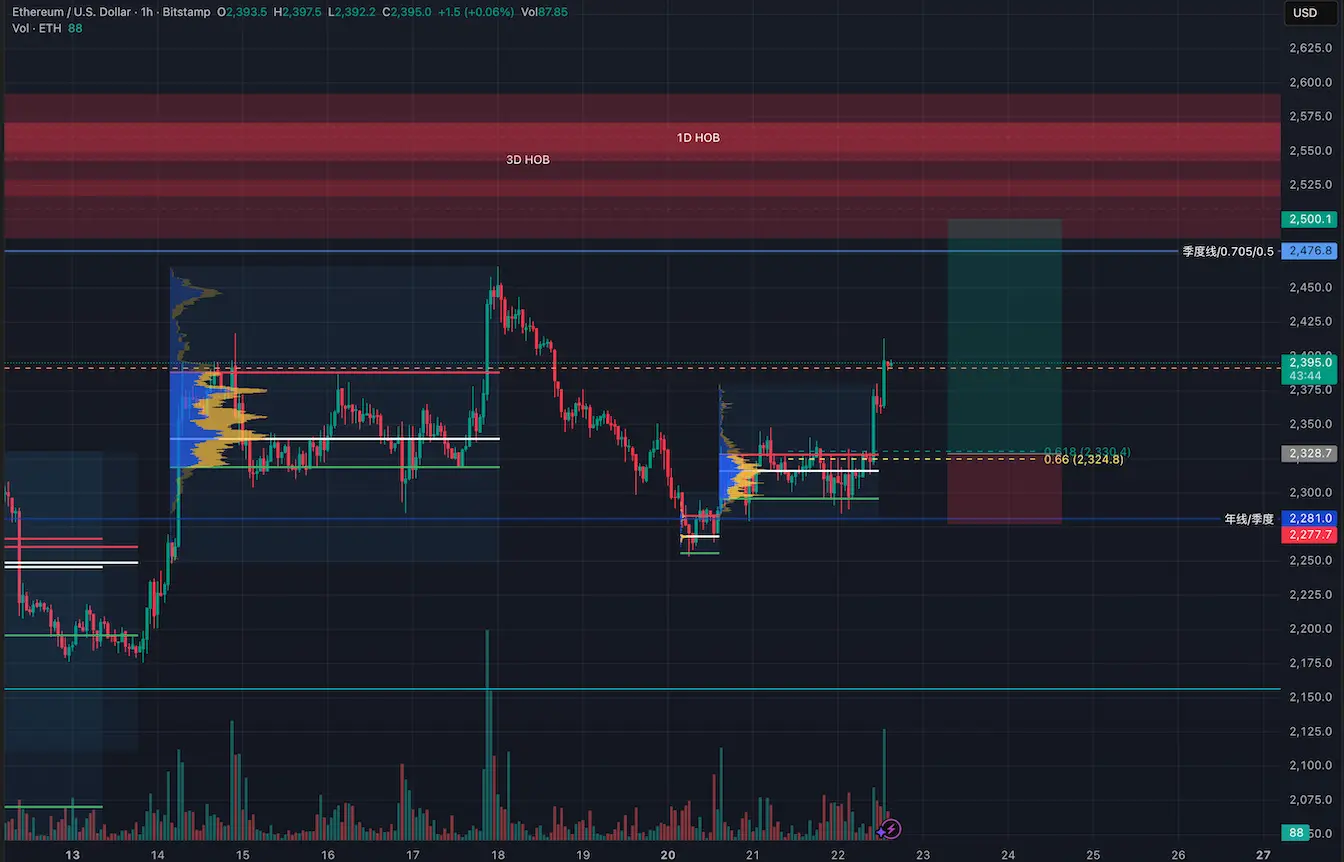
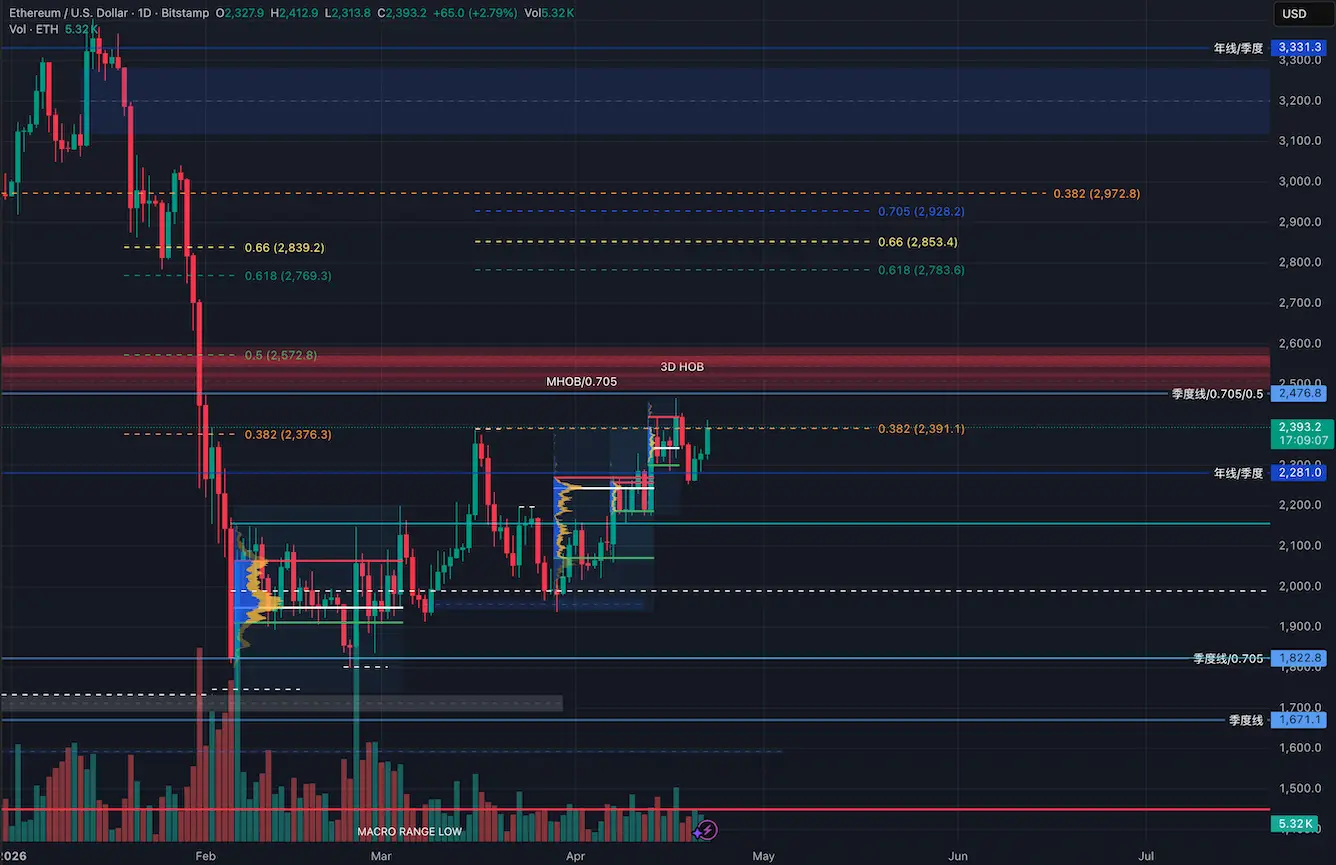
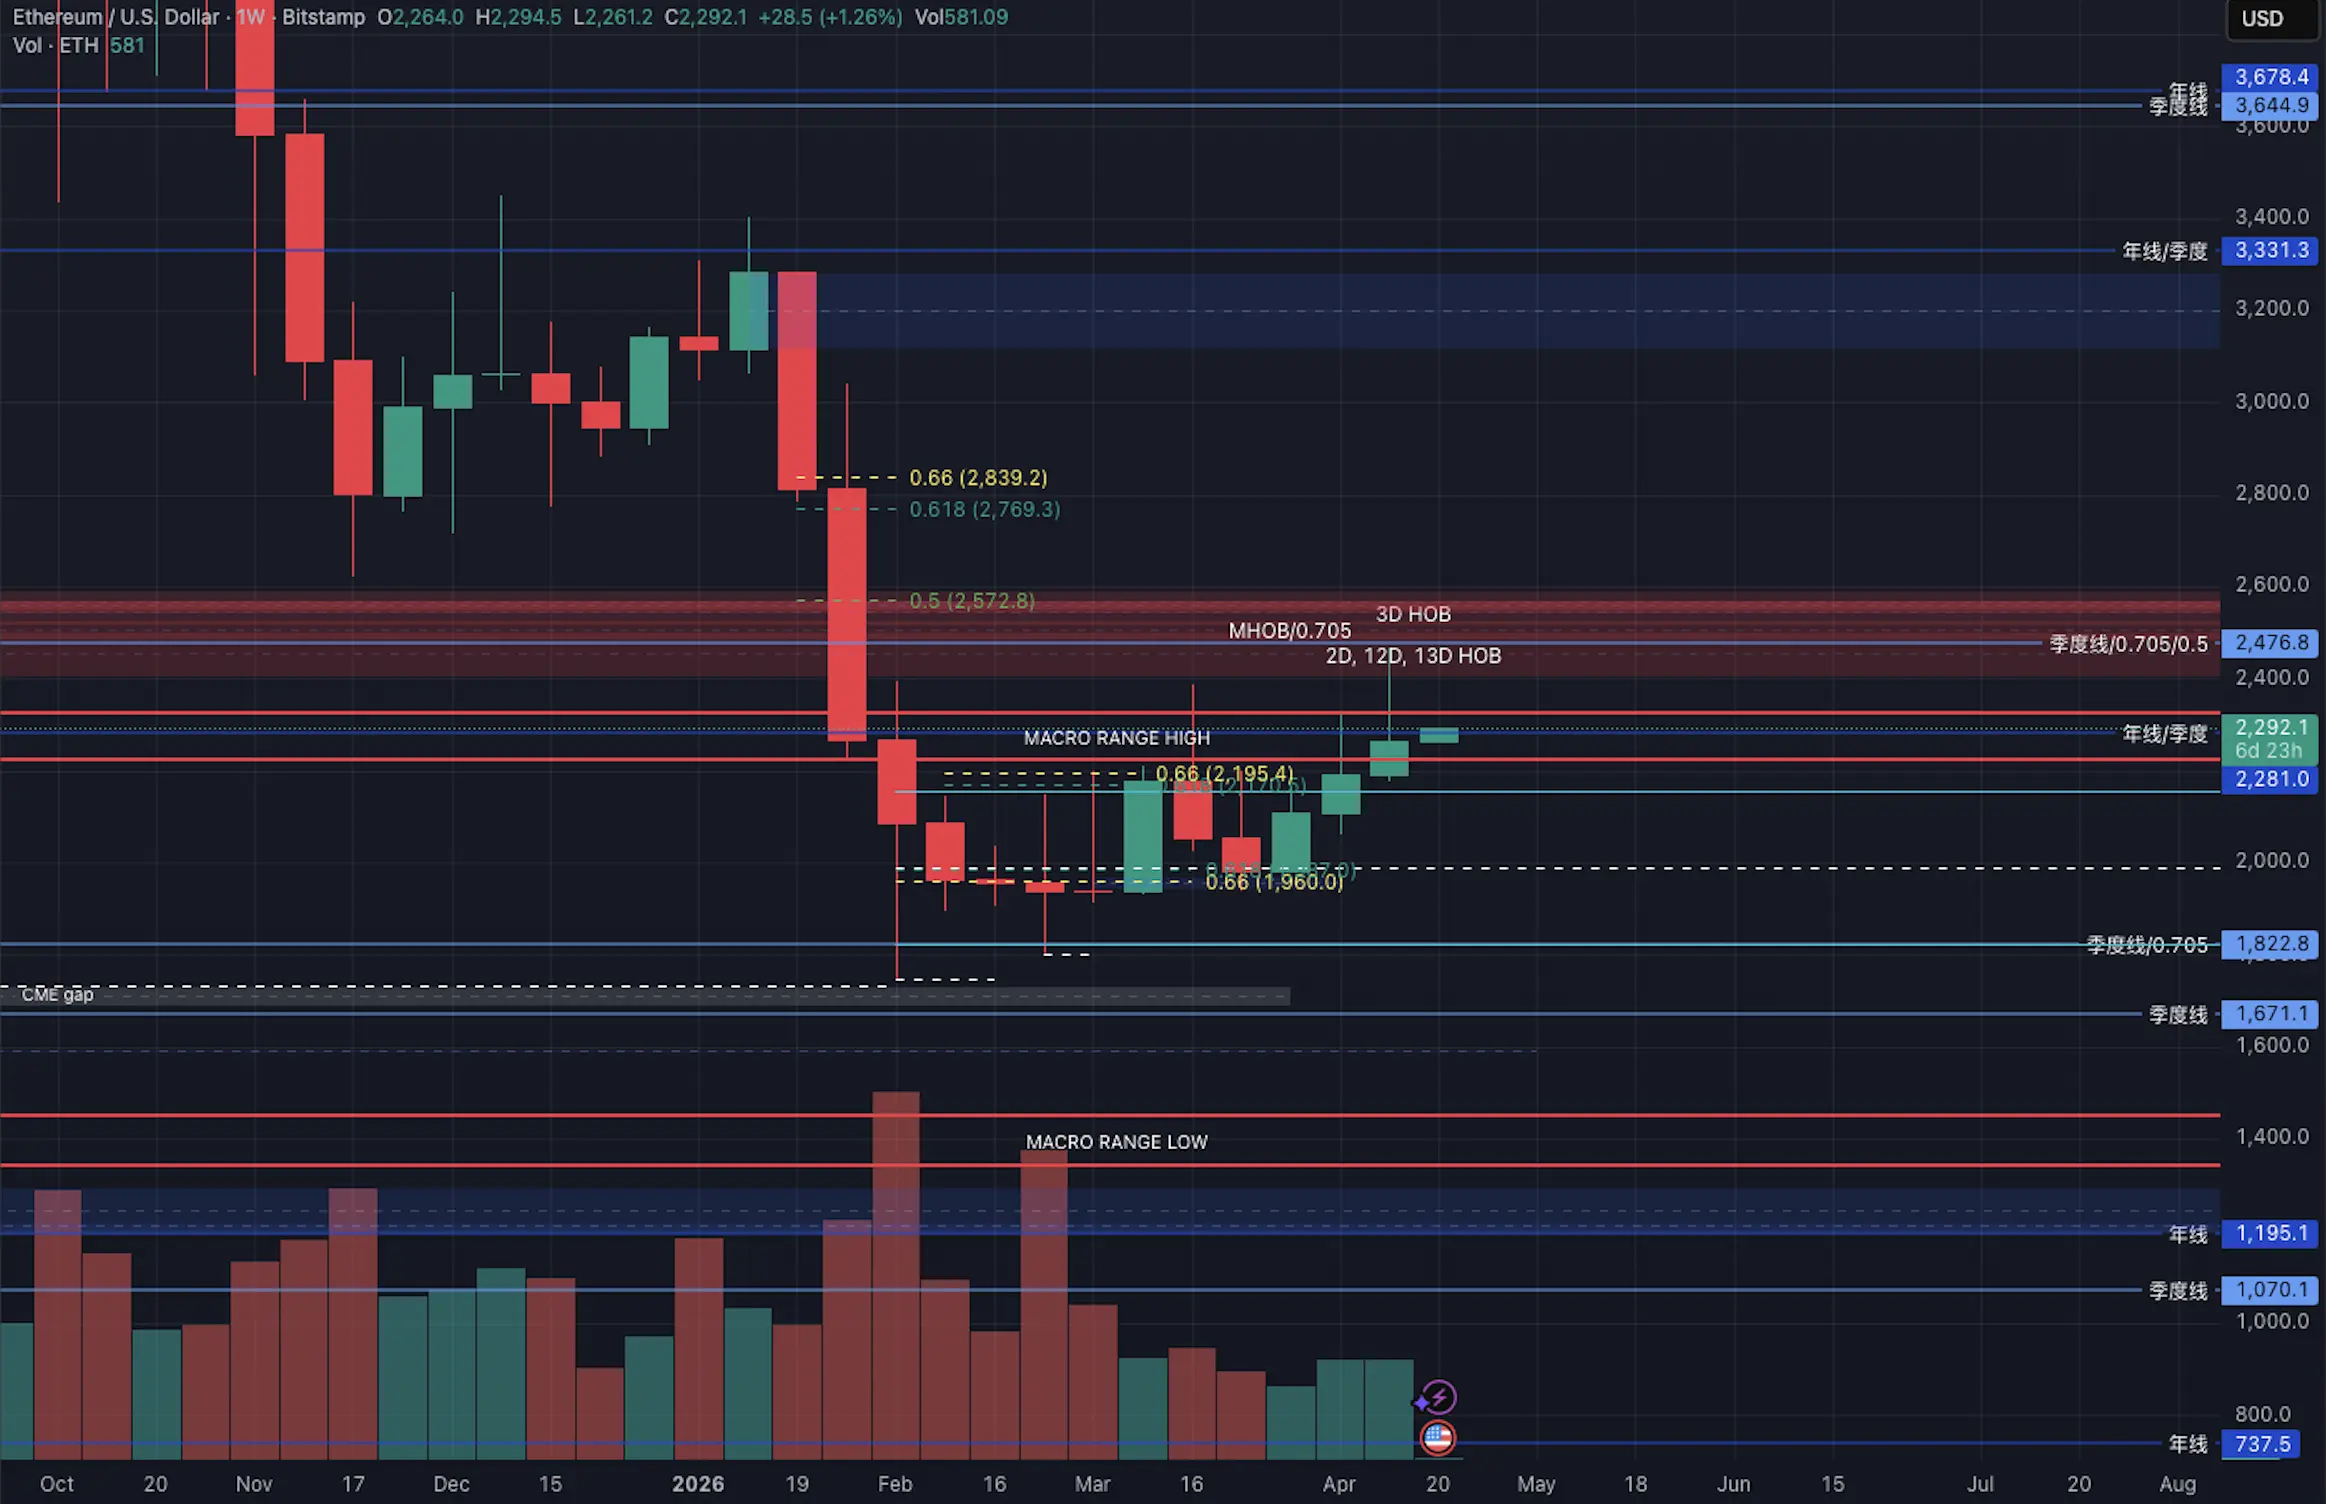
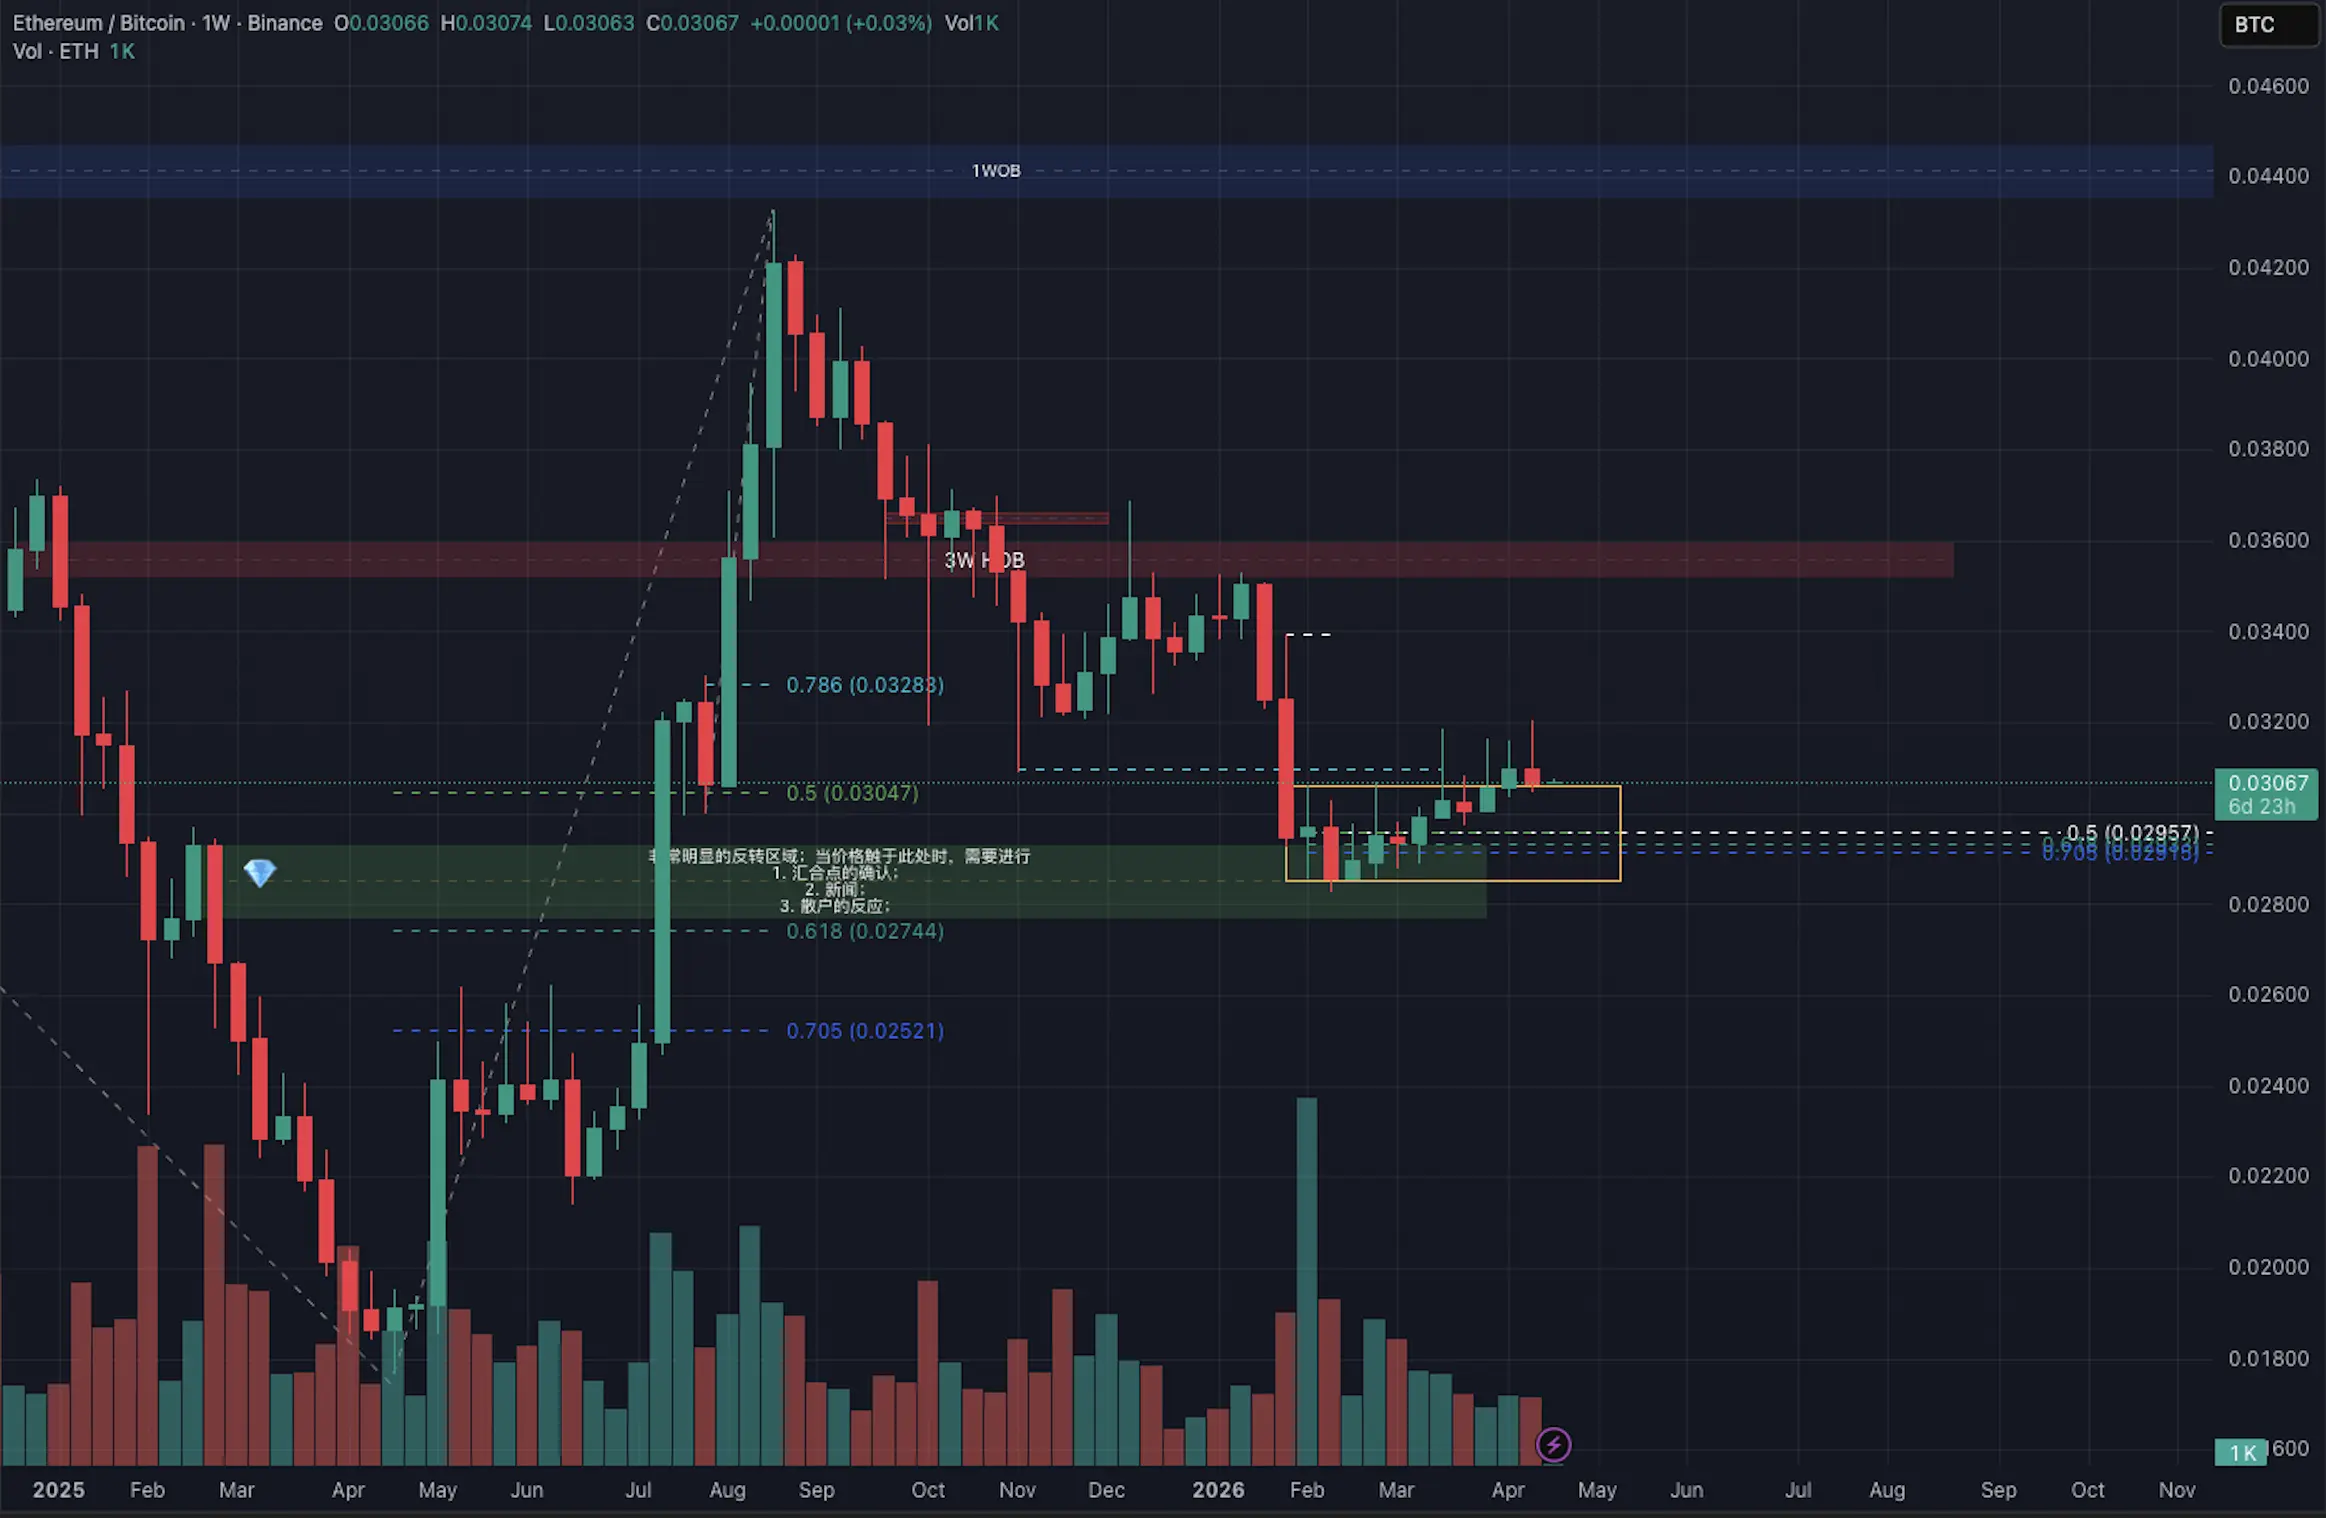
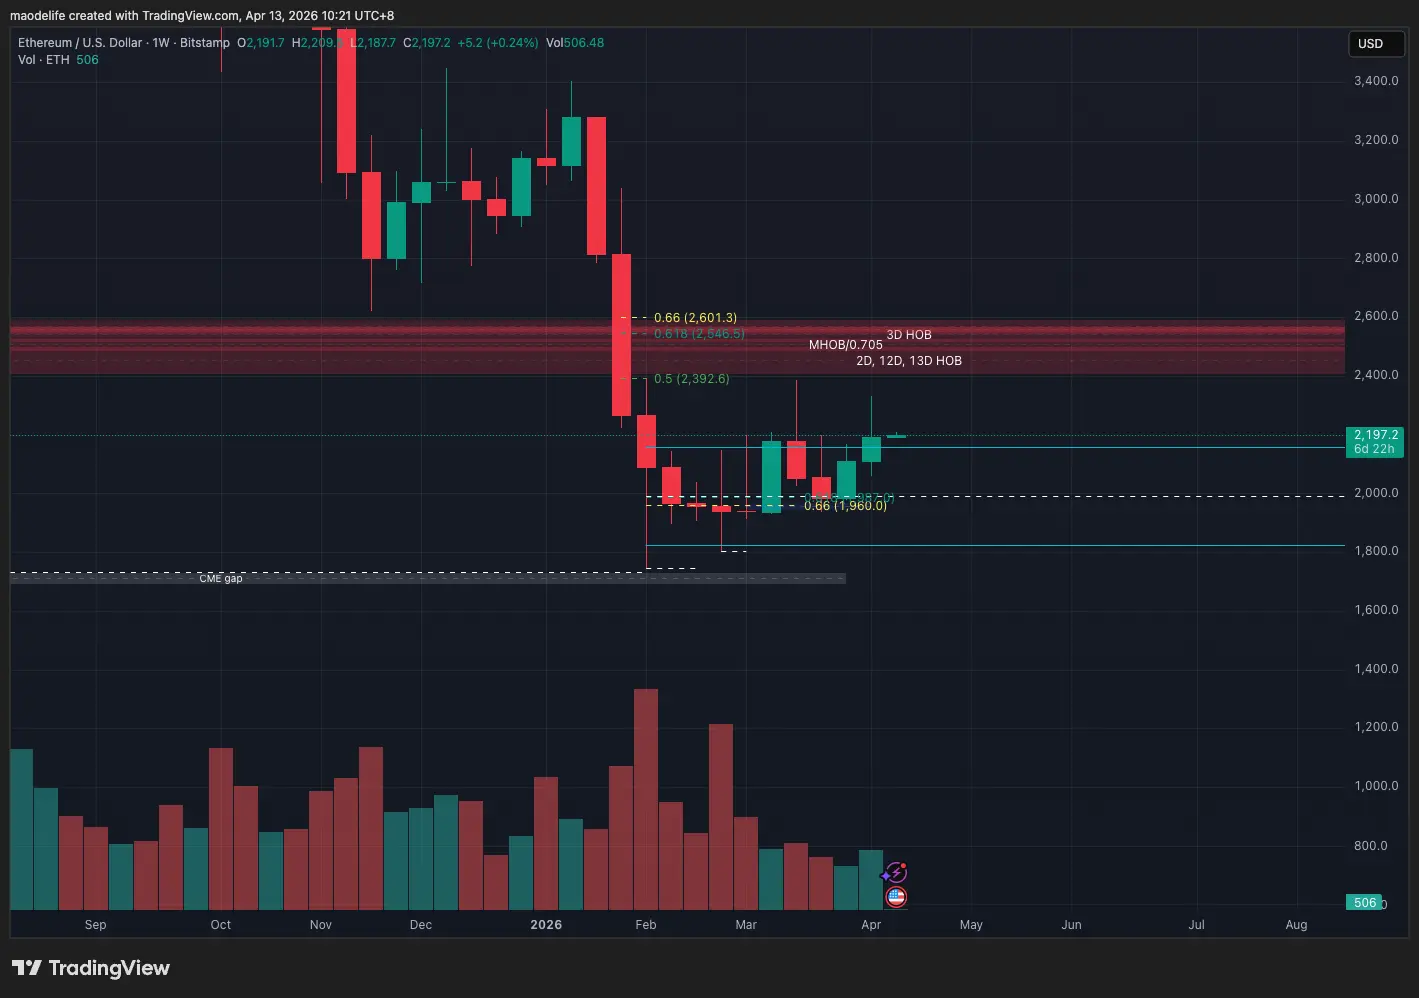
Weekly Line Analysis:
ETH is relatively stronger compared to BTC. Last week, it stabilized above the range high.
But still, does ETH have an independent trend at this stage? I think probably not.
ETH's consolidation trend still follows BTC.
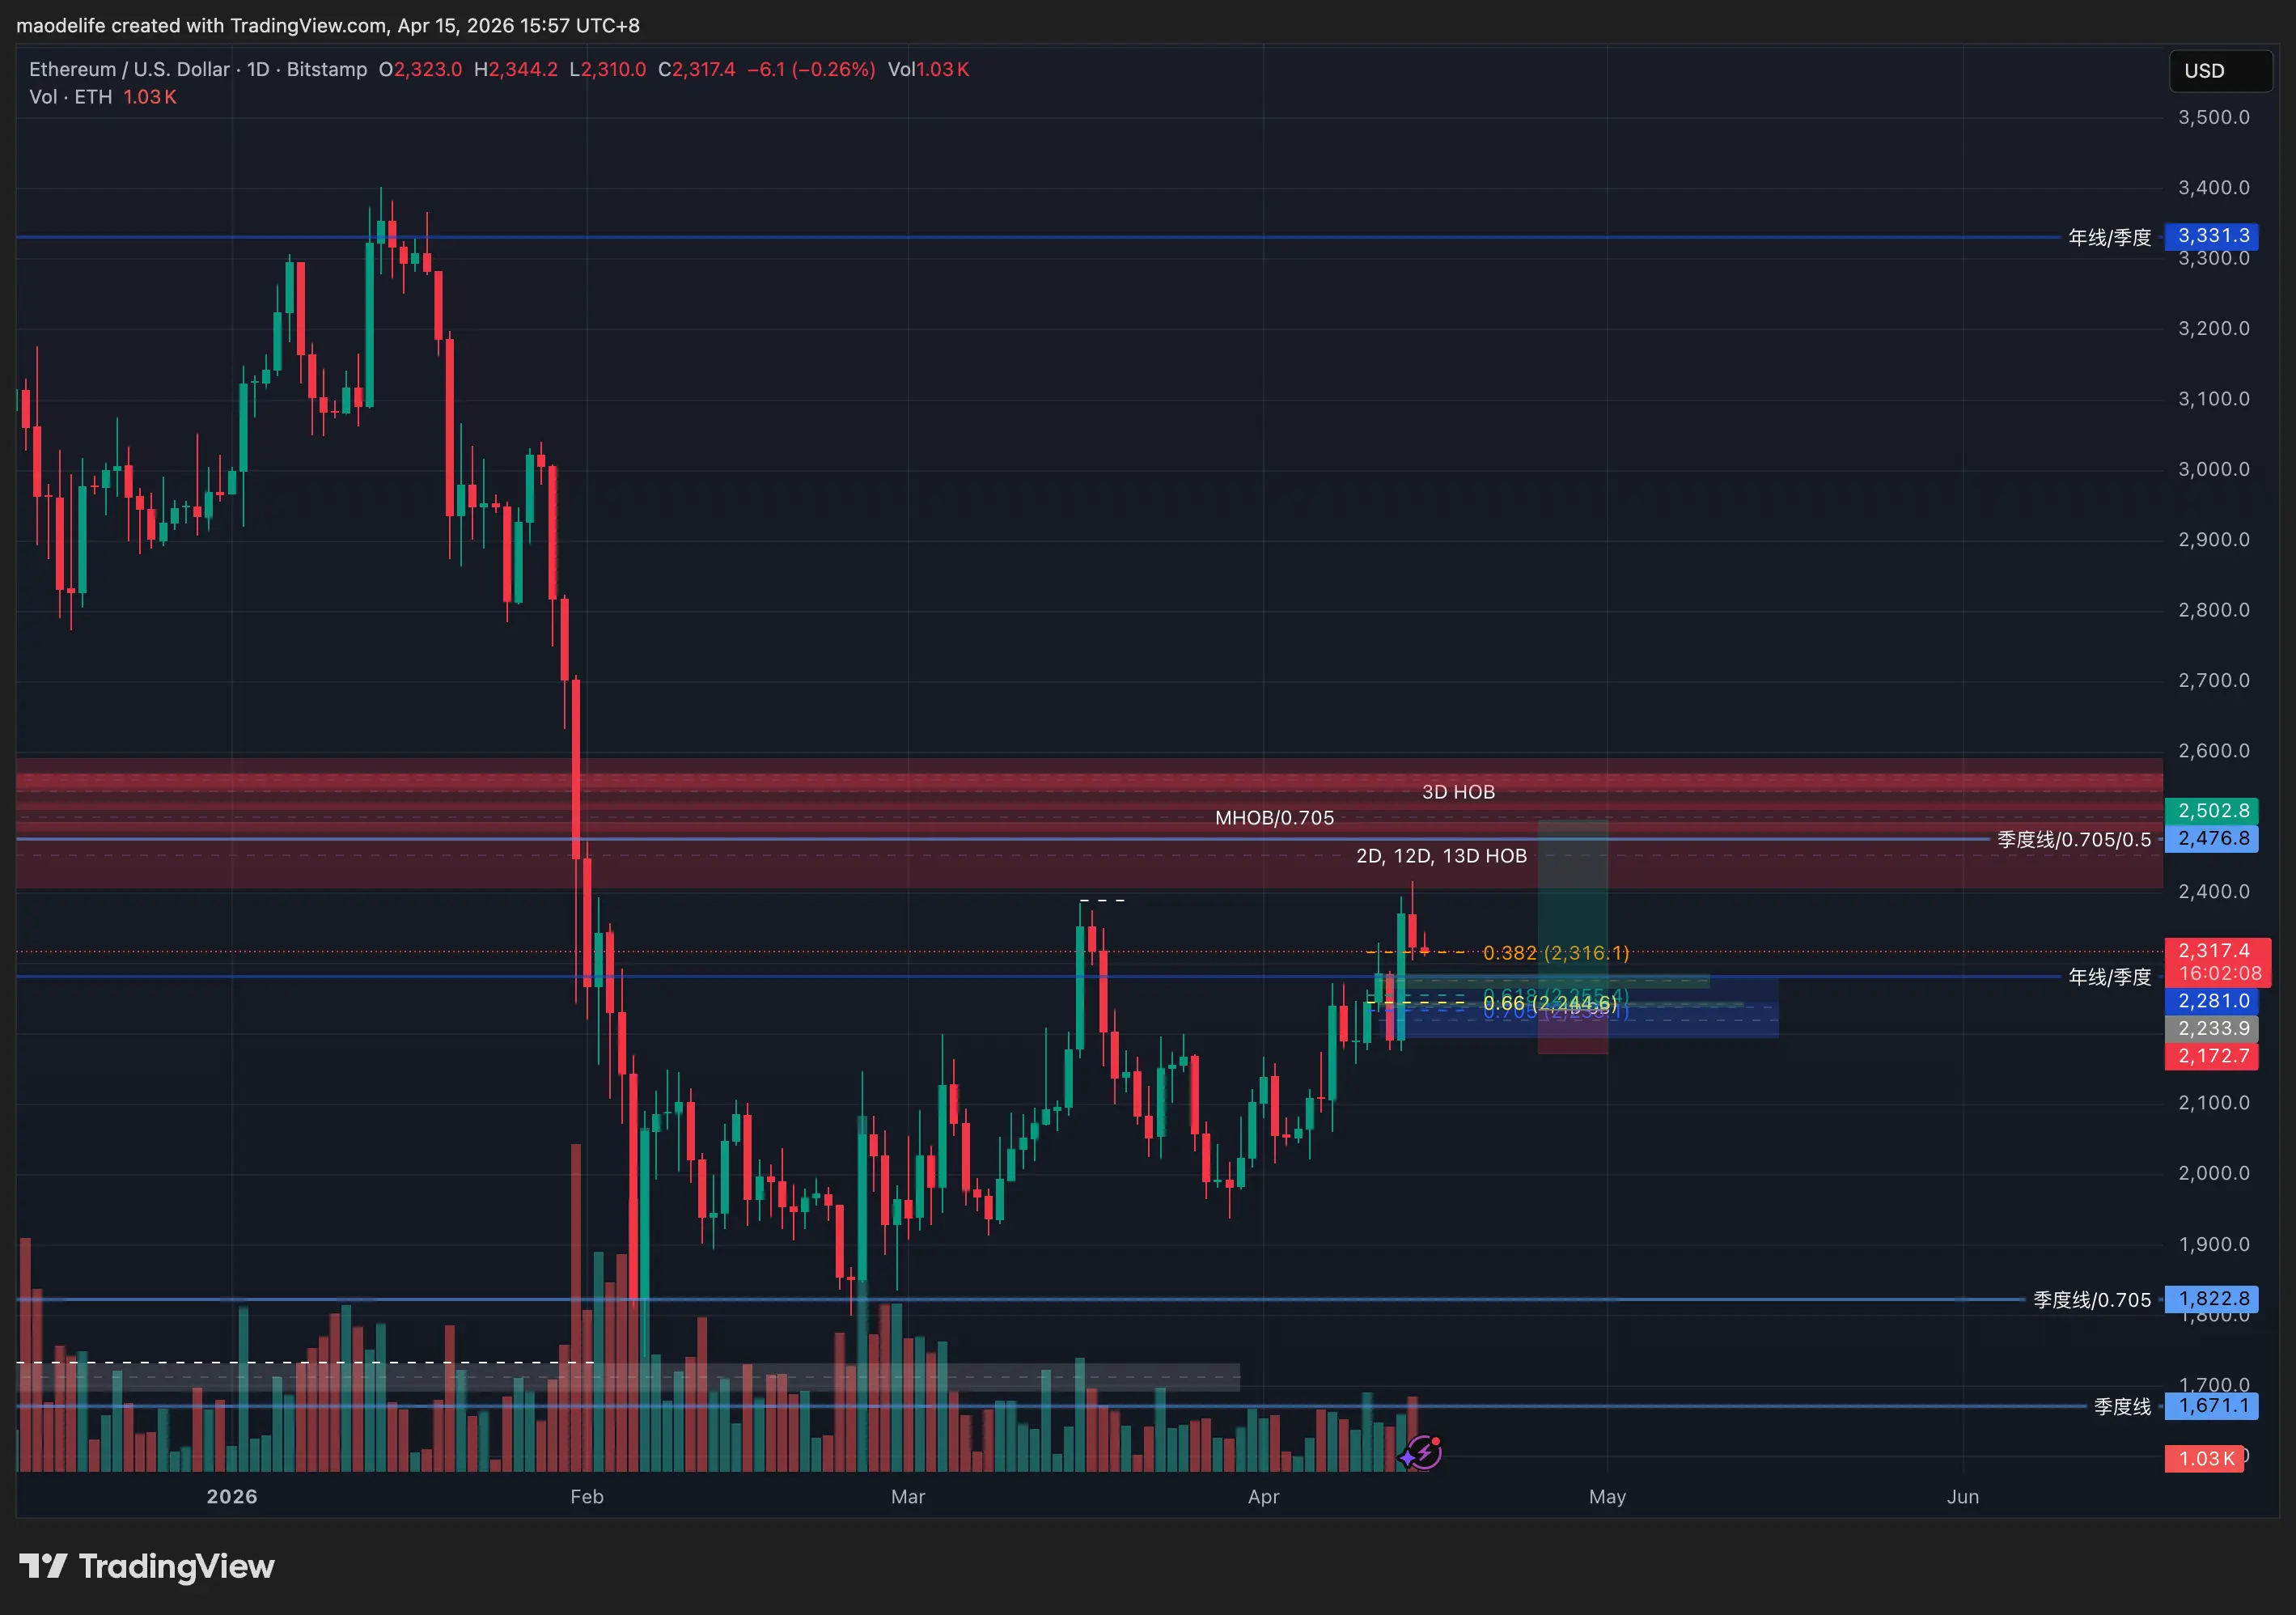
Scenario 1: If BTC breaks through the previous high, ETH will also break through its previous high and enter a critical zone (2.4K - 2.5K).
Scenario 2: If BTC falls back into the range, ETH will also follow BTC back into the range (Range High: 2157).
ETH also has two key liquidity points below:
Key liquidity point 1: 1800
Key liquidity point 2: 1742
Like BTC, if these two key liquidity points are acquired and then a false breakdown occurs, the market could see a significant upward move.