$BTC
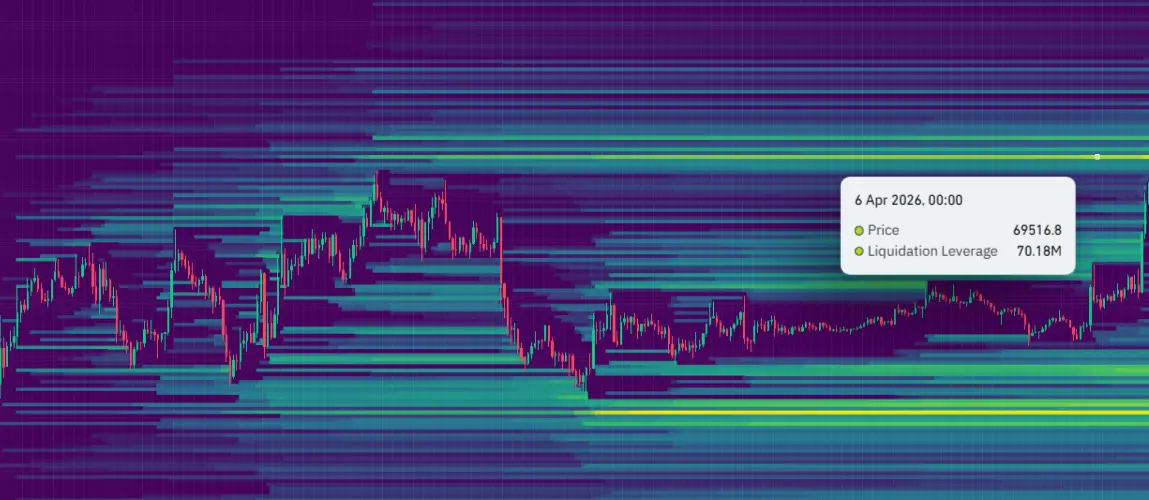
On Bitcoin’s weekly chart, there’s about $70.17M in liquidation sitting around the 69,516 level. This suggests buyers are actually targeting that zone, meaning price could still push up and tap that level first before any meaningful pullback happens.
On the other hand, there’s $88.50M in liquidation resting below 65,530. That area becomes the downside target if price gets rejected above.
So overall, it looks like price is being drawn upward first to clear liquidity, then potentially rotate down after hitting that zone.
DYOR TAYOR NFA
#GateSquareAprilPostingChallenge