Trade
Basic
Futures
Futures
Hundreds of contracts settled in USDT or BTC
TradFi
Gold
Trade global traditional assets with USDT in one place
Options
Hot
Trade European-style vanilla options
Unified Account
Maximize your capital efficiency
Demo Trading
Futures Kickoff
Get prepared for your futures trading
Futures Events
Participate in events to win generous rewards
Demo Trading
Use virtual funds to experience risk-free trading
Earn
Launch
CandyDrop
Collect candies to earn airdrops
Launchpool
Quick staking, earn potential new tokens
HODLer Airdrop
Hold GT and get massive airdrops for free
Launchpad
Be early to the next big token project
Alpha Points
Trade on-chain assets and enjoy airdrop rewards!
Futures Points
Earn futures points and claim airdrop rewards
Investment
Simple Earn
Earn interests with idle tokens
Auto-Invest
Auto-invest on a regular basis
Dual Investment
Buy low and sell high to take profits from price fluctuations
Soft Staking
Earn rewards with flexible staking
Crypto Loan
0 Fees
Pledge one crypto to borrow another
Lending Center
One-stop lending hub
VIP Wealth Hub
Customized wealth management empowers your assets growth
Private Wealth Management
Customized asset management to grow your digital assets
Quant Fund
Top asset management team helps you profit without hassle
Staking
Stake cryptos to earn in PoS products
Smart Leverage
New
No forced liquidation before maturity, worry-free leveraged gains
GUSD Minting
Use USDT/USDC to mint GUSD for treasury-level yields
More
LionBee
No content yet
LionBee
🔥 FUN FACT: Bitcoin has a different price every Valentine’s season 😅
2011: $1
2012: $5
2013: $20
2014: $600
2015: $300
2016: $450
2017: $1,200
2018: $10,000
2019: $3,631
2020: $10,000
2021: $45,000
2022: $42,500
2023: $22,000
2024: $75,000
2025: $95,000
2026: $69,000
This year also looks quite “lucky,” doesn’t it, everyone? 🤣🤣
$BTC #CelebratingNewYearOnGateSquare
2011: $1
2012: $5
2013: $20
2014: $600
2015: $300
2016: $450
2017: $1,200
2018: $10,000
2019: $3,631
2020: $10,000
2021: $45,000
2022: $42,500
2023: $22,000
2024: $75,000
2025: $95,000
2026: $69,000
This year also looks quite “lucky,” doesn’t it, everyone? 🤣🤣
$BTC #CelebratingNewYearOnGateSquare
BTC1,41%
- Reward
- 1
- Comment
- Repost
- Share
ETH is testing the bottom zone of the structural price range 📉
It looks like a "discount," but the short-term trend remains weak; hidden bearish divergence on the 4H chart indicates the rebound is only temporary and not a reversal yet
If the $2,020 level is broken, the next structural support zone is $1,851, and $1,747 was a strong buy area in the past 📊
The funding rate is negative: shorts have to pay fees to hold their positions, while retail investors are leaning long ⚖️
Whales have not shown clear buy signals, maintaining a neutral stance 🐋
Medium to long-term investors can DCA, but in
View OriginalIt looks like a "discount," but the short-term trend remains weak; hidden bearish divergence on the 4H chart indicates the rebound is only temporary and not a reversal yet
If the $2,020 level is broken, the next structural support zone is $1,851, and $1,747 was a strong buy area in the past 📊
The funding rate is negative: shorts have to pay fees to hold their positions, while retail investors are leaning long ⚖️
Whales have not shown clear buy signals, maintaining a neutral stance 🐋
Medium to long-term investors can DCA, but in

- Reward
- 1
- Comment
- Repost
- Share
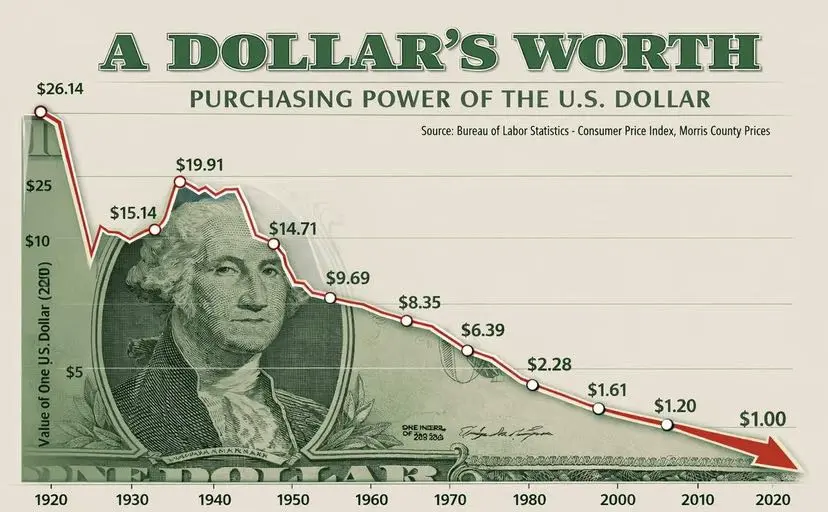
Will the USD collapse in the next 5 years?
Will the US dollar crash in five years?
Sounds very dramatic. Very easy to go viral.
But if you truly care about your money, we need to look at this story more deeply and realistically.
Let’s imagine it this way.
There’s no “collapse overnight.”
No scenes of banks shutting down en masse.
Everything happens gradually.
Like a foundation starting to show small cracks. At first, no one notices. The house still stands. The lights are still on. Life goes on normally.
Until one day, you realize that with the same amount of money… you can buy less than before
View OriginalWill the US dollar crash in five years?
Sounds very dramatic. Very easy to go viral.
But if you truly care about your money, we need to look at this story more deeply and realistically.
Let’s imagine it this way.
There’s no “collapse overnight.”
No scenes of banks shutting down en masse.
Everything happens gradually.
Like a foundation starting to show small cracks. At first, no one notices. The house still stands. The lights are still on. Life goes on normally.
Until one day, you realize that with the same amount of money… you can buy less than before
- Reward
- 1
- Comment
- Repost
- Share
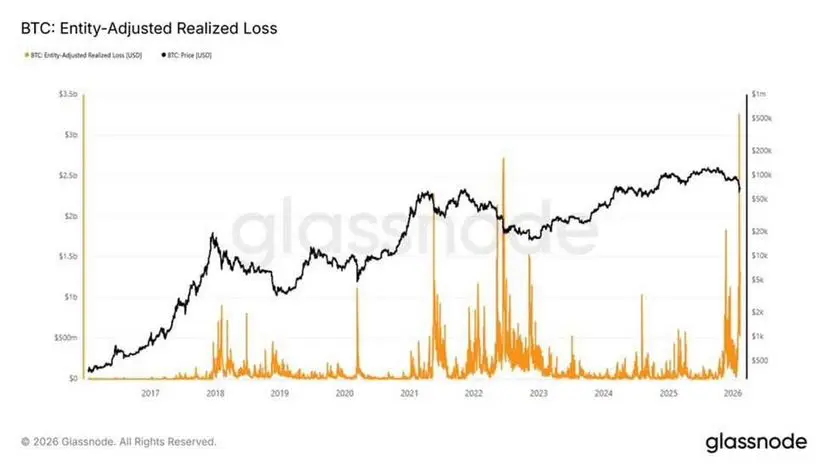
The Biggest Loss Day in Bitcoin History
Last week, if you still held BTC, you probably experienced this feeling:
Open the app.
An unusually long red candlestick.
Chat groups are silent.
And the only thought in your mind is:
“Maybe I should sell to lighten the load…”
According to data from Glassnode, February 5, 2026, recorded a realized loss of $3.2 billion in a single day – the largest in Bitcoin’s history.
The number sounds huge.
But let me explain it in the simplest way.
⸻
Usually, people look at the “Realized Loss” indicator to see how much the market is losing.
But that indicator has a pr
BTC1,41%
- Reward
- 1
- Comment
- Repost
- Share
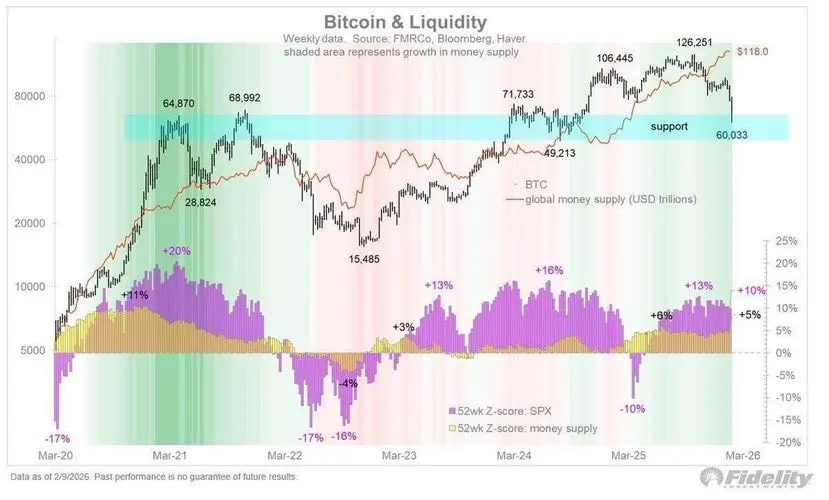
THIS ARTICLE IS VERY THOUGHT-PROVOKING.
Fidelity doesn't say "Bitcoin will skyrocket immediately."
They mention something more dangerous: the market structure is maturing.
1️⃣ $60K – Possibly the bottom of the structure
Bitcoin just flushed down to 60K.
Right at the support zone that Fidelity previously marked.
Compared to previous cycles:
• 2014: -85%
• 2018: -84%
• 2022: -77%
• 2026: much shallower correction
👉 The depth decreases over time.
👉 Each new bottom is higher than the previous one.
This is not a dead market.
It’s a market that is growing.
2️⃣ Global liquidity is the new key
B
View OriginalFidelity doesn't say "Bitcoin will skyrocket immediately."
They mention something more dangerous: the market structure is maturing.
1️⃣ $60K – Possibly the bottom of the structure
Bitcoin just flushed down to 60K.
Right at the support zone that Fidelity previously marked.
Compared to previous cycles:
• 2014: -85%
• 2018: -84%
• 2022: -77%
• 2026: much shallower correction
👉 The depth decreases over time.
👉 Each new bottom is higher than the previous one.
This is not a dead market.
It’s a market that is growing.
2️⃣ Global liquidity is the new key
B
- Reward
- 1
- Comment
- Repost
- Share
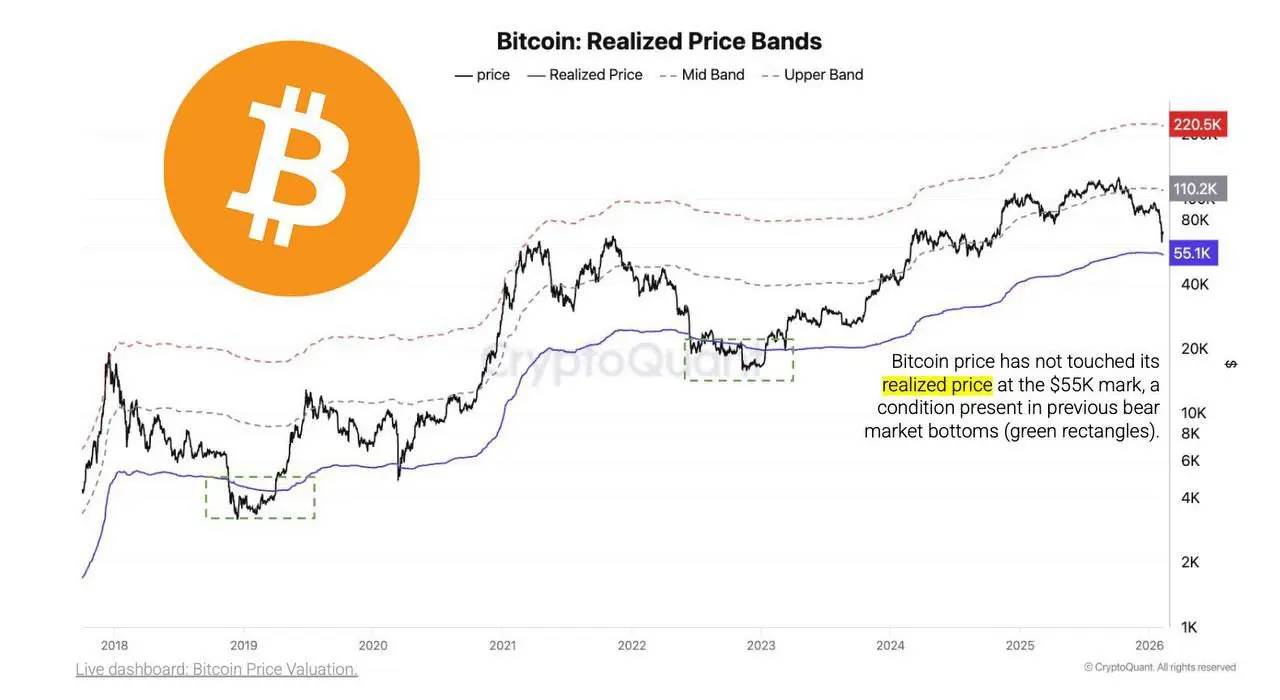
🔥Cryptoquant: Bitcoin's cycle bottom will be around $55,000
According to data from Cryptoquant, the realized price zone is currently the biggest support in history, and the price is still about 25% higher than this level.
🗒 Previous cycles:
• After F.T.X: price was about 24% below realized price
• 2018 cycle: about 30% below
When reaching that zone, BTC usually doesn't bounce immediately but accumulates for 4–6 months before reversing
If BTC drops to the 5x zone, are you willing to bet on re-entering the market 😁
❗️Just providing information, not investment advice #CelebratingNewYearOnGateS
View OriginalAccording to data from Cryptoquant, the realized price zone is currently the biggest support in history, and the price is still about 25% higher than this level.
🗒 Previous cycles:
• After F.T.X: price was about 24% below realized price
• 2018 cycle: about 30% below
When reaching that zone, BTC usually doesn't bounce immediately but accumulates for 4–6 months before reversing
If BTC drops to the 5x zone, are you willing to bet on re-entering the market 😁
❗️Just providing information, not investment advice #CelebratingNewYearOnGateS
- Reward
- 1
- Comment
- Repost
- Share
Have you gathered enough assets in this area?
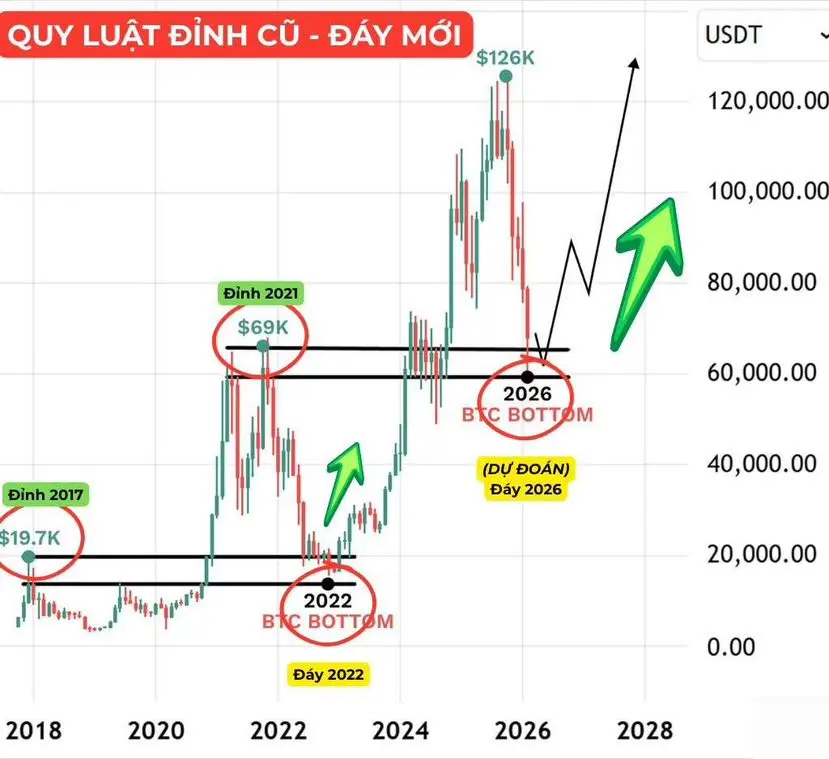
📉 HISTORY NEVER LIES: THE OLD LOW IS THE NEW HIGH!
In 2022, the bottom was $20k (, and the old peak was 2017). In 2026, the scenario is exactly the same: the bottom is in the $60k-$69k ( region, with the old peak at 2021). We are standing on the safest launchpad to rebound.
📉 HISTORY NEVER LIES: THE OLD LOW IS THE NEW HIGH!
In 2022, the bottom was $20k (, and the old peak was 2017). In 2026, the scenario is exactly the same: the bottom is in the $60k-$69k ( region, with the old peak at 2021). We are standing on the safest launchpad to rebound.
BTC1,41%
- Reward
- 1
- Comment
- Repost
- Share
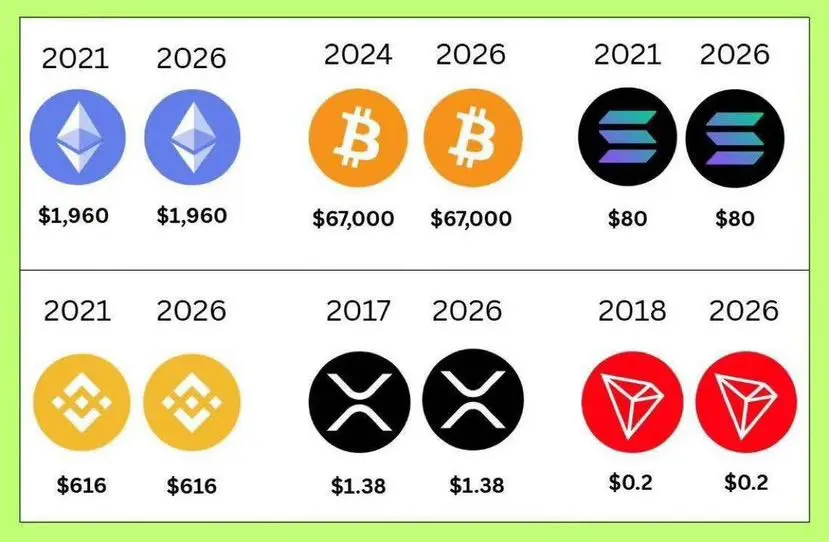
Prices are still... familiar 😄
All top coins like $BTC $ETH $SOL $XRP and finally $TRX
Crypto is always noisy, harsh, but also very fair in its own way.
Those who stay long enough will understand.
Not every coin that soars high will go far.
Not every coin that moves slowly will disappear.
Everything changes constantly, but there are also things that seem to hardly change at all.
$BTC $ETH $SOL #CelebratingNewYearOnGateSquare
View OriginalAll top coins like $BTC $ETH $SOL $XRP and finally $TRX
Crypto is always noisy, harsh, but also very fair in its own way.
Those who stay long enough will understand.
Not every coin that soars high will go far.
Not every coin that moves slowly will disappear.
Everything changes constantly, but there are also things that seem to hardly change at all.
$BTC $ETH $SOL #CelebratingNewYearOnGateSquare
[The user has shared his/her trading data. Go to the App to view more.]
- Reward
- 1
- Comment
- Repost
- Share
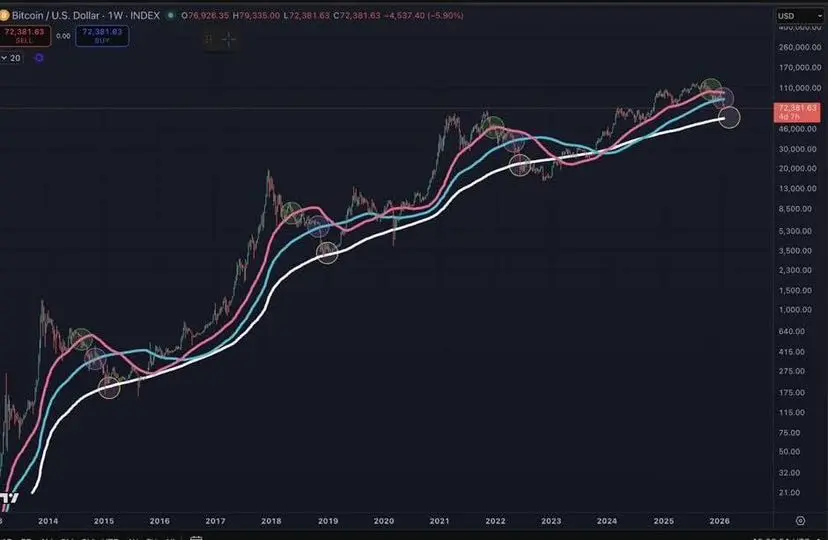
🔥 Where is crypto headed?
In crypto, at least with BTC, each cycle is the same. BTC can recover. If that happens, it will be very good for market sentiment. However, at the current moment, new highs are more likely just lower peaks within the macro trend. Trying to time these rebounds is very difficult, with mixed results—sometimes successful, sometimes leading to “account blowouts.”
When BTC drops below the SMA50, the price usually continues down to the SMA100, consolidates there for a while, then moves down to the SMA200. Every cycle ends up like this. BTC peaks right around the familiar (Q
View OriginalIn crypto, at least with BTC, each cycle is the same. BTC can recover. If that happens, it will be very good for market sentiment. However, at the current moment, new highs are more likely just lower peaks within the macro trend. Trying to time these rebounds is very difficult, with mixed results—sometimes successful, sometimes leading to “account blowouts.”
When BTC drops below the SMA50, the price usually continues down to the SMA100, consolidates there for a while, then moves down to the SMA200. Every cycle ends up like this. BTC peaks right around the familiar (Q
[The user has shared his/her trading data. Go to the App to view more.]
- Reward
- 1
- Comment
- Repost
- Share
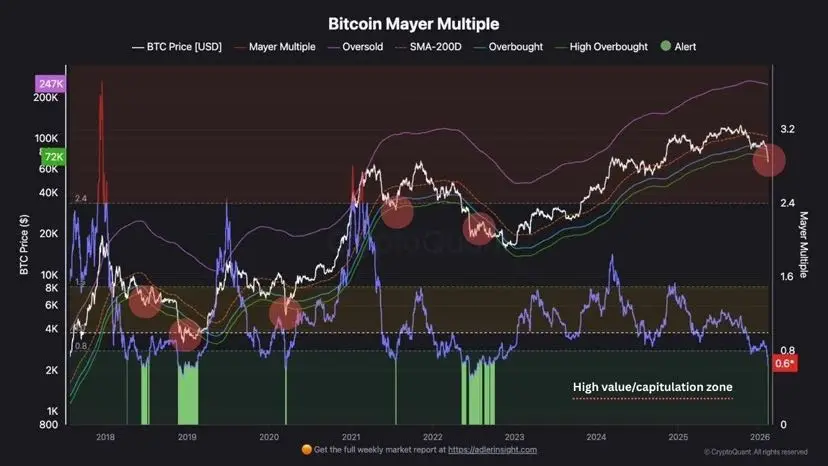
🔥 When the crowd is roaring, the chart is silent.
And at that very moment… the market is telling the truth.
When the market is euphoric, everyone is an “investment genius.”
The timeline is full of profit showcases, all about “buying more should have been done.”
But when everything falls apart,
when fear spreads faster than the price drops,
only the data remains steady, unshaken, and free of panic or storytelling.
📉 Mayer Multiple just hit 0.6
→ Bitcoin is trading about 40% below the MA200.
This doesn’t happen during normal corrections.
It only occurs when the market enters a true capitulatio
View OriginalAnd at that very moment… the market is telling the truth.
When the market is euphoric, everyone is an “investment genius.”
The timeline is full of profit showcases, all about “buying more should have been done.”
But when everything falls apart,
when fear spreads faster than the price drops,
only the data remains steady, unshaken, and free of panic or storytelling.
📉 Mayer Multiple just hit 0.6
→ Bitcoin is trading about 40% below the MA200.
This doesn’t happen during normal corrections.
It only occurs when the market enters a true capitulatio
- Reward
- 1
- Comment
- Repost
- Share
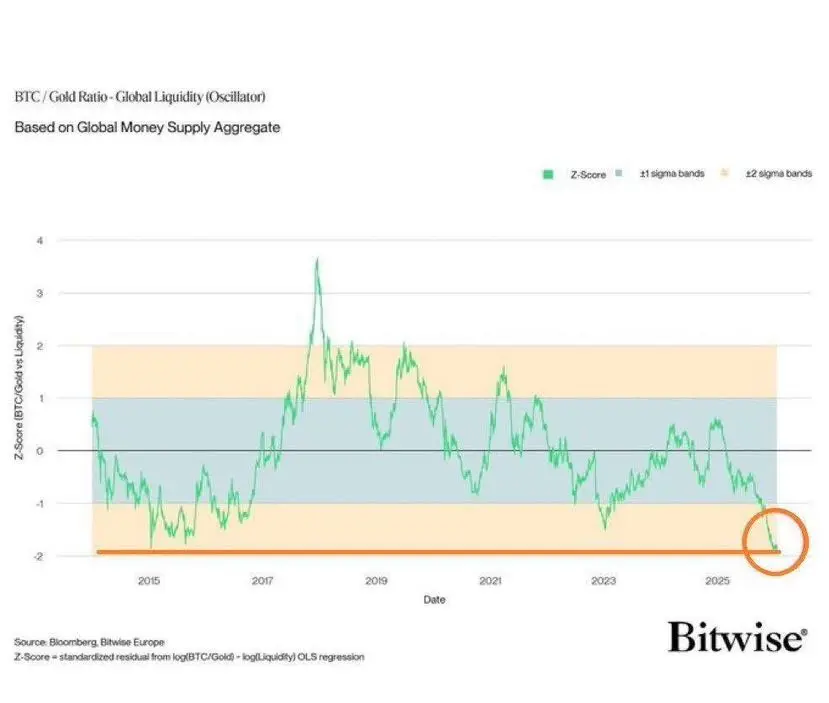
🔥 When gold is celebrated – Bitcoin is often in the overlooked phase.
According to data from Bitwise,
the Gold / Bitcoin ratio has just hit a historic low – even lower than in 2015.
This usually happens when:
• Gold has already run ahead
• Bitcoin is under suspicion
• And the crowd chooses “safety”
But history shows:
Every time this ratio hits bottom, Bitcoin begins to outperform strongly afterward.
No hype.
No FOMO.
Just smart money quietly shifting.
This is not investment advice.
Just a simple question:
When everyone is holding what has already risen,
could the opportunity be in what has
View OriginalAccording to data from Bitwise,
the Gold / Bitcoin ratio has just hit a historic low – even lower than in 2015.
This usually happens when:
• Gold has already run ahead
• Bitcoin is under suspicion
• And the crowd chooses “safety”
But history shows:
Every time this ratio hits bottom, Bitcoin begins to outperform strongly afterward.
No hype.
No FOMO.
Just smart money quietly shifting.
This is not investment advice.
Just a simple question:
When everyone is holding what has already risen,
could the opportunity be in what has
- Reward
- 1
- Comment
- Repost
- Share
Trending Topics
View More81.04K Popularity
6.46K Popularity
6.31K Popularity
52.44K Popularity
3.45K Popularity
Pin