Trade
Basic
Futures
Futures
Hundreds of contracts settled in USDT or BTC
TradFi
Gold
Trade global traditional assets with USDT in one place
Options
Hot
Trade European-style vanilla options
Unified Account
Maximize your capital efficiency
Demo Trading
Futures Kickoff
Get prepared for your futures trading
Futures Events
Participate in events to win generous rewards
Demo Trading
Use virtual funds to experience risk-free trading
Earn
Launch
CandyDrop
Collect candies to earn airdrops
Launchpool
Quick staking, earn potential new tokens
HODLer Airdrop
Hold GT and get massive airdrops for free
Launchpad
Be early to the next big token project
Alpha Points
Trade on-chain assets and enjoy airdrop rewards!
Futures Points
Earn futures points and claim airdrop rewards
Investment
Simple Earn
Earn interests with idle tokens
Auto-Invest
Auto-invest on a regular basis
Dual Investment
Buy low and sell high to take profits from price fluctuations
Soft Staking
Earn rewards with flexible staking
Crypto Loan
0 Fees
Pledge one crypto to borrow another
Lending Center
One-stop lending hub
VIP Wealth Hub
Customized wealth management empowers your assets growth
Private Wealth Management
Customized asset management to grow your digital assets
Quant Fund
Top asset management team helps you profit without hassle
Staking
Stake cryptos to earn in PoS products
Smart Leverage
New
No forced liquidation before maturity, worry-free leveraged gains
GUSD Minting
Use USDT/USDC to mint GUSD for treasury-level yields
More
GateUser-29a75e79
No content yet
GateUser-29a75e79
January 25, 2026 (Sunday) BTC generally weak and volatile downward, consolidating within the narrow range of 88,000-90,000 USD, failing to retake the 90,000 USD level, with the weekly decline expanding to over 7%.
Key Data (as of 18:00 on the day, CoinGecko)
- Price: reported at 88,330.86 USD, approximately 1.4% decline in 24 hours, 7.3% decline for the week.
- Range: intraday high around 89,900 USD, low around 87,957 USD.
- Volume: trading volume shrank to about 2 billion USD, with light buying and selling activity.
Trend Rhythm
- Asian Market: continued the rebound and pullback pattern from
BTC0,18%
- Reward
- 1
- 1
- Repost
- Share
MasterChuTheOldDemonMasterChu :
:
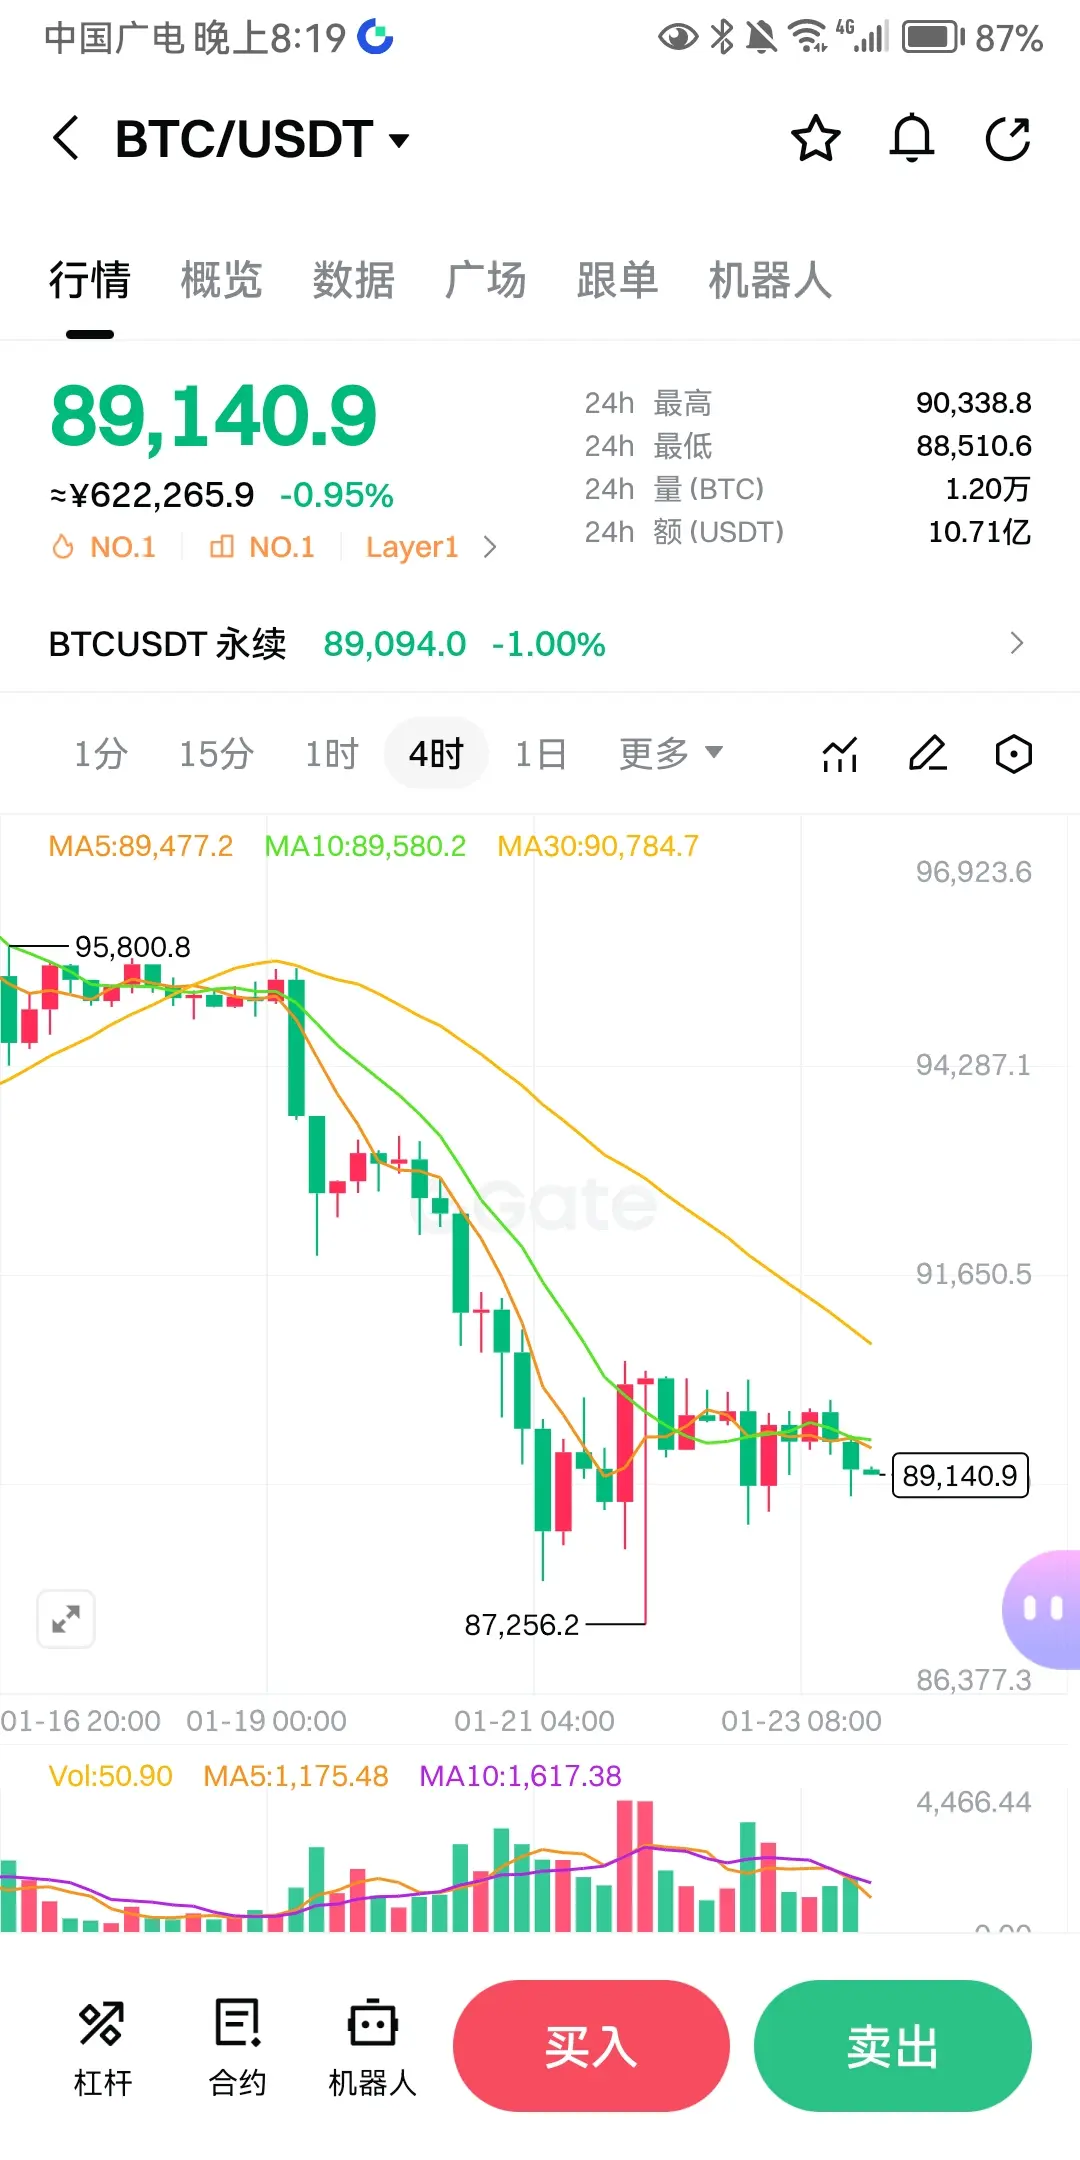
2026 Go Go Go 👊Here is the core market overview and analysis for BTC on Saturday, January 24, 2026, with data sourced from public market summaries:
Core Data
- Price for the day: approximately $89,400, with slight intraday fluctuations; 24-hour price change close to 0% (micro-dip/micro-rise zone)
- Volatility range: $88,500 ~ $90,000 (narrow consolidation, no clear directional trend)
- Key support levels: $88,500 (tested multiple times intraday without effective breakdown), $87,200 (weekly low)
- Key resistance levels: $90,000 ~ $91,000 (multiple attempts to push higher followed by pullbacks, selling pressur
BTC0,18%
- Reward
- like
- Comment
- Repost
- Share
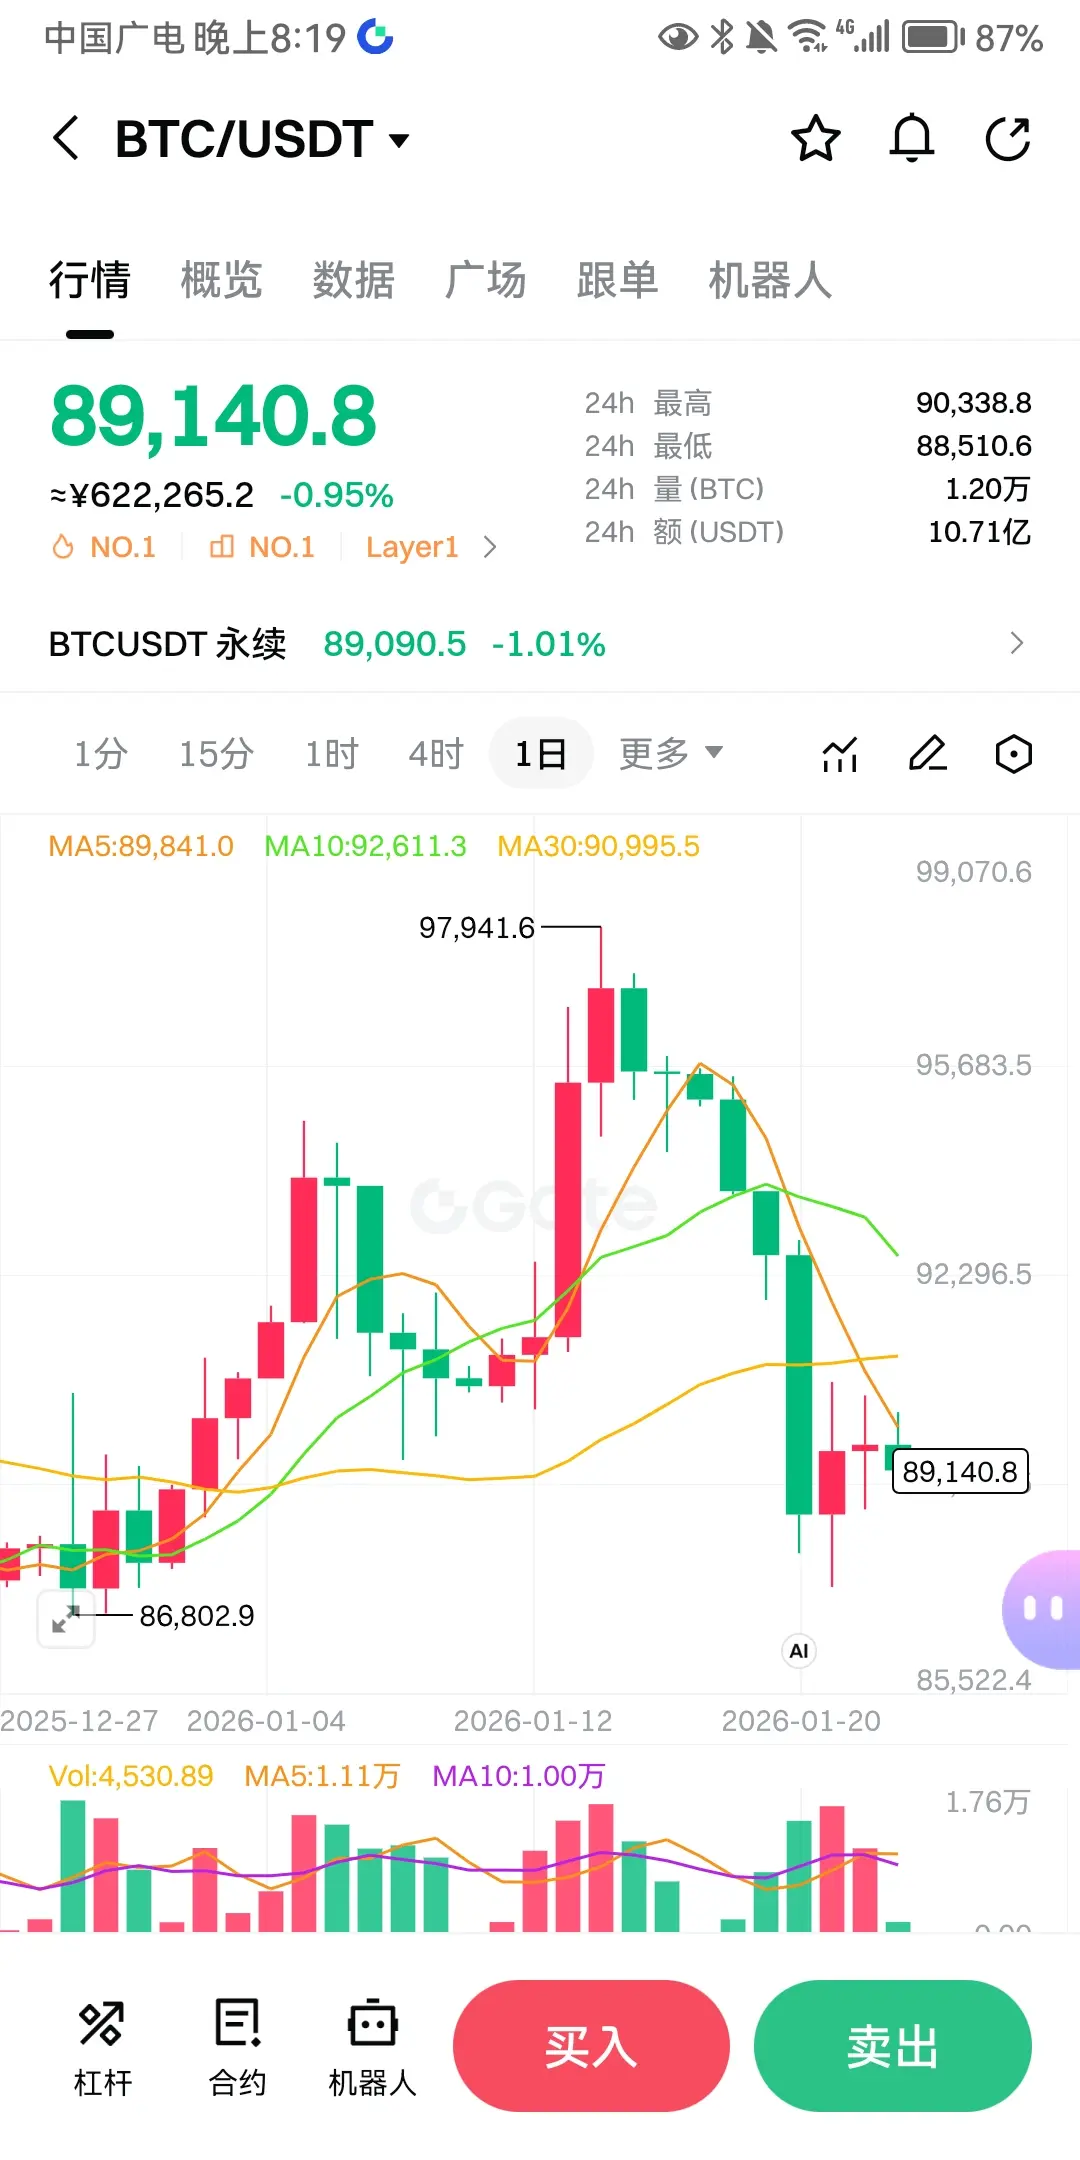
Here is the core market analysis of BTC/USD on January 23rd (yesterday) (data compiled from mainstream platforms)
1. Core Price and Volume
- Intraday Range: $88,515 ~ $90,340, closing price around $89,500, slight intraday decline of about 0.3%, indicating a narrow sideways movement
- Trading Volume: Significantly reduced compared to the previous day, with strong wait-and-see sentiment among funds, no clear signals of main capital entering
- Key Price Levels: Short-term support at $88,500 and $87,600; resistance at $90,300 and $91,500 (EMA20)
2. Technical Signals
1. Daily Chart: RSI around 44.5
BTC0,18%


- Reward
- 1
- Comment
- Repost
- Share
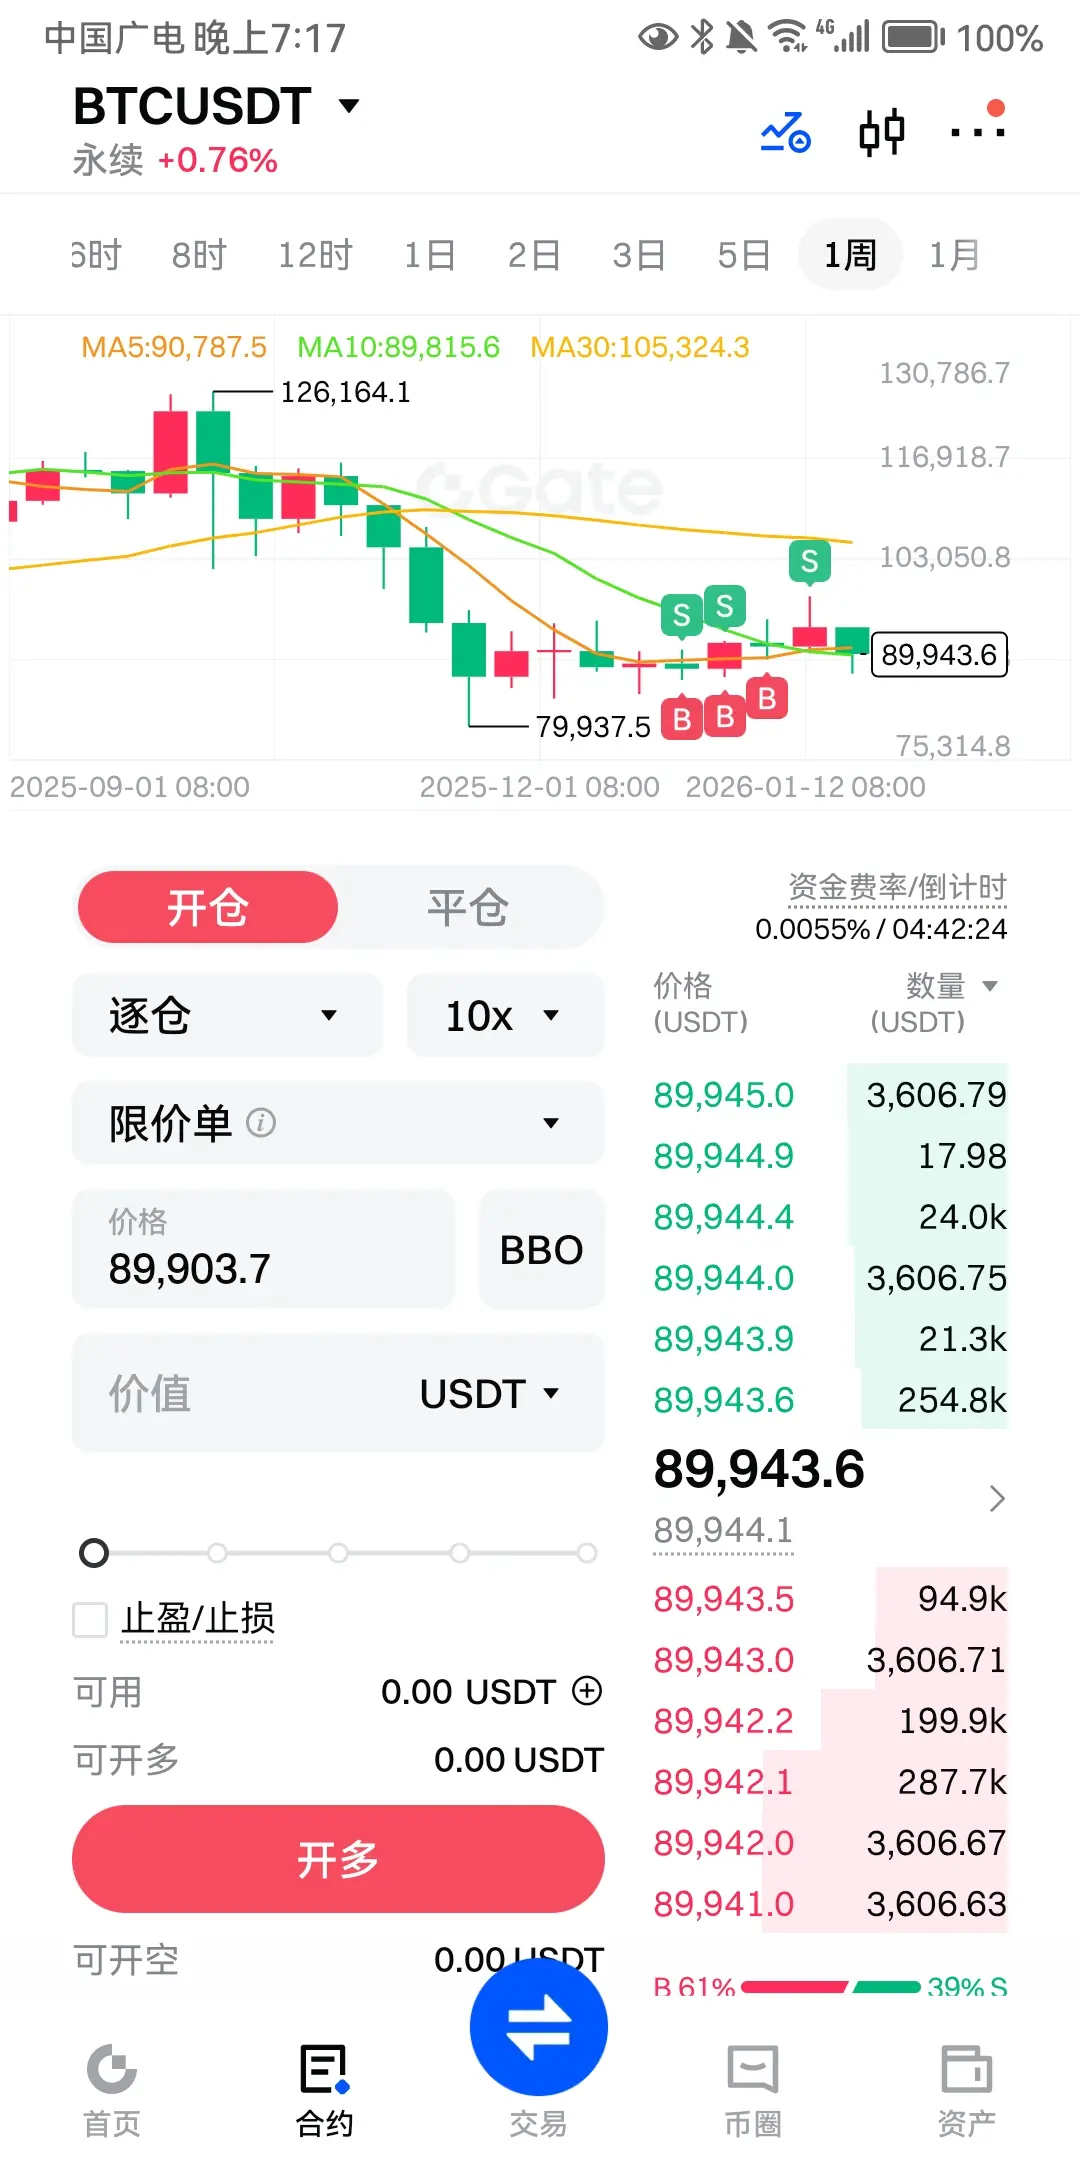
Here is the core market analysis and causes of BTC on January 22, 2026 (yesterday), with data sourced from public market statistics:
Core Price and Volatility
- Opened at $89,455, high of $90,360, low of $87,209, close at $89,560, with slight intra-day fluctuations, a deep dip at one point, and ultimately nearly flat, with the $90,000 level repeatedly contested.
- During the day, it briefly fell below $88k, reaching a recent low, then quickly rebounded amid macro easing news (cancellation of EU tariff threats), showing a V-shaped recovery but failing to break through the $91k resistance zone.
BTC0,18%


- Reward
- like
- Comment
- Repost
- Share
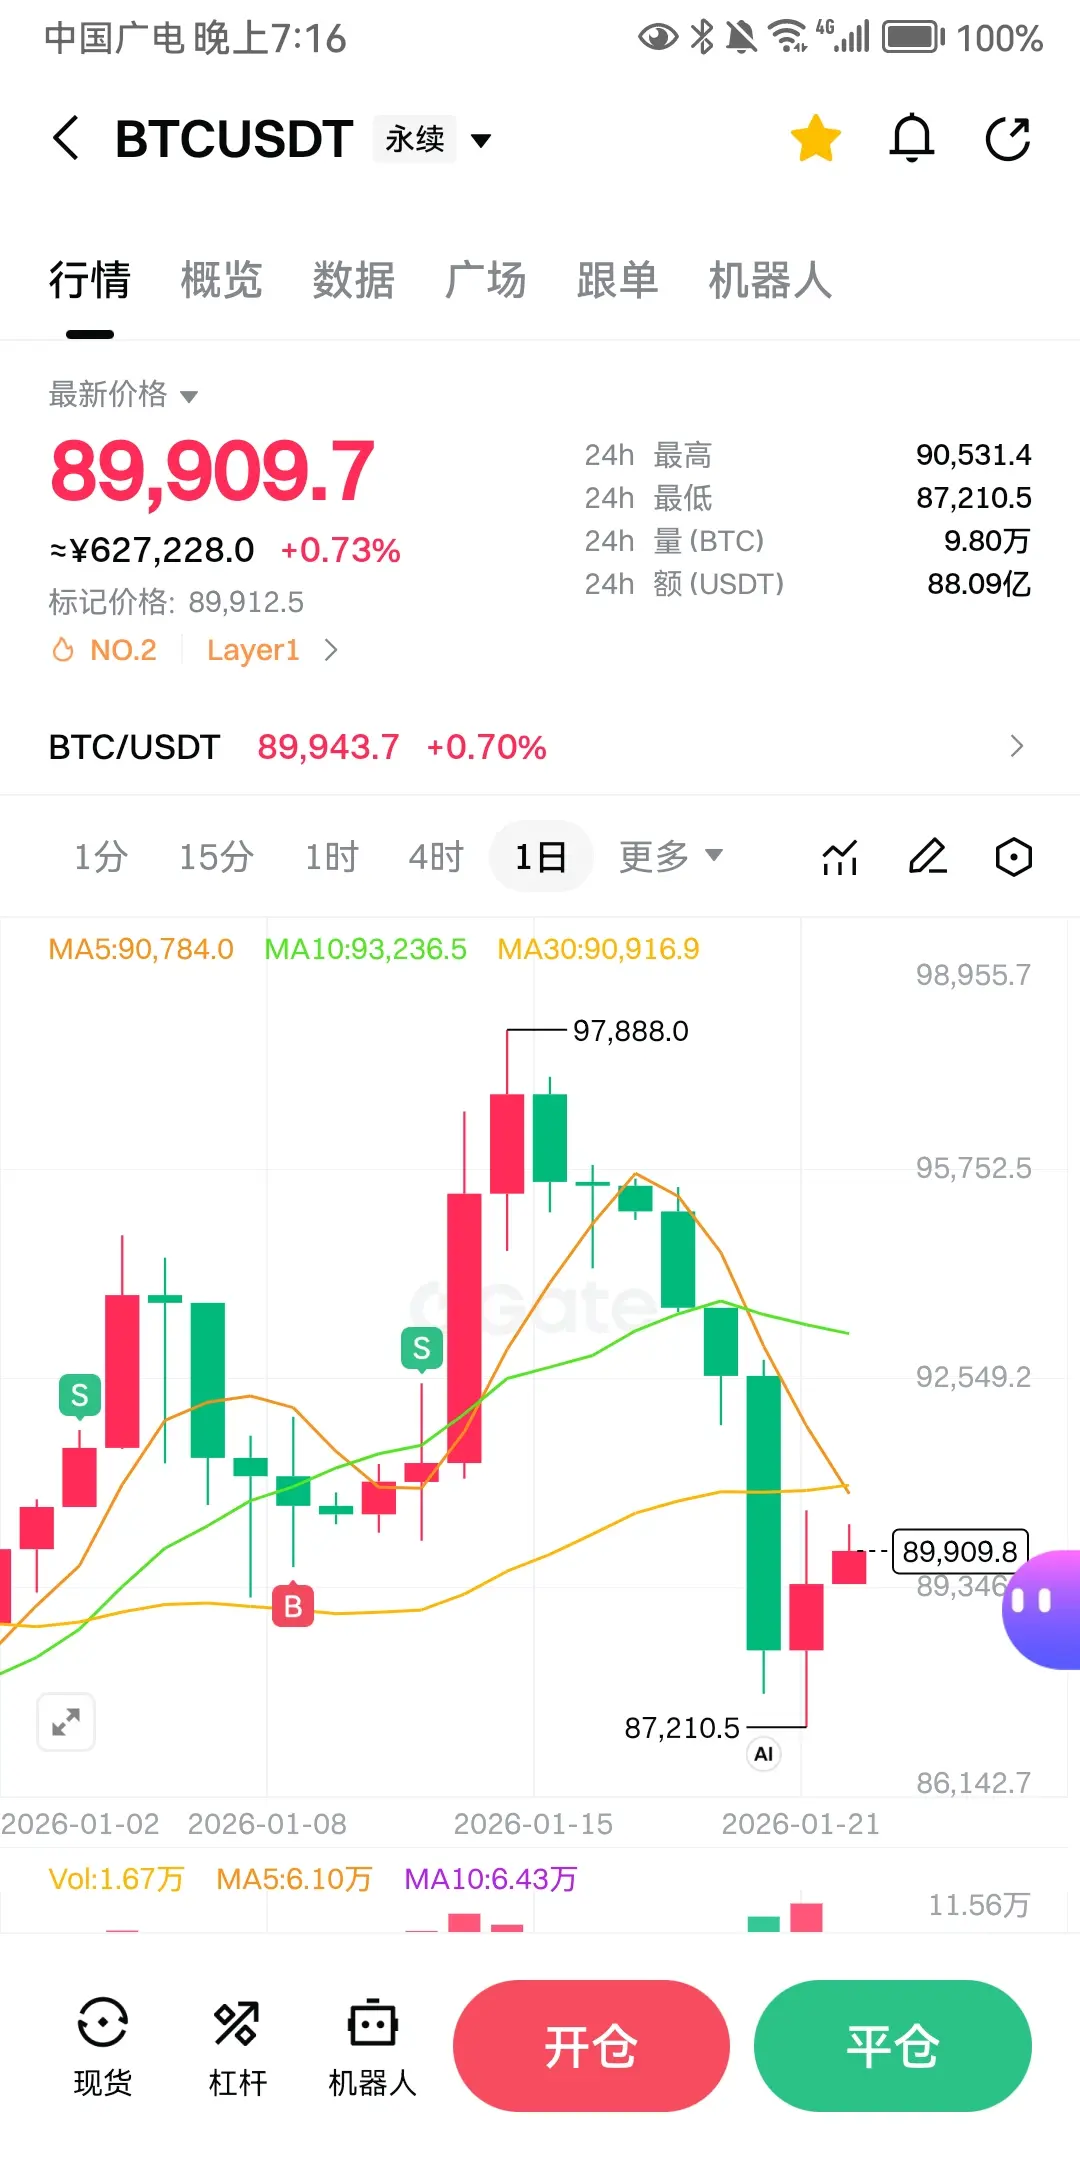
January 21, 2026, BTC overall shows a deep correction combined with a weak rebound, with the core drivers being geopolitical/macro risks suppression and insufficient bullish confidence:
Core price data (USD)
- Intraday low: 87,800–87,950, high: 90,100–90,700, close near 88,900–89,100, 24-hour decline of about 2%–3%
- Key levels: losing the 90,000 psychological threshold, below 87,500–88,000 as a vital support line, above 90,000 as the primary resistance
Trend stages and drivers
1. Morning acceleration downward: impacted by US-EU tariffs, Japanese bond market fluctuations, and other risk shocks
BTC0,18%
- Reward
- 1
- Comment
- Repost
- Share
Trending Topics
View More317.08K Popularity
101.42K Popularity
418.29K Popularity
118.83K Popularity
22.68K Popularity
Pin