浩哥实盘交易
工中浩:慕青說幣 合約精通,深耕市場多年,擅長從K線褶皺裡洞悉脈絡,只分享能落地的交易乾貨!唯心:jinshijiacha
浩哥实盘交易
短期至中期幣圈潛力幣種解析:精準布局,把握漲跌紅利
粉絲們集合!近期幣圈看似震盪平淡,實則暗流湧動——監管規則重寫、機構資金入場、賽道輪動加速,很多人困在“利好不漲”的迷局裡,卻不知一批潛力幣種已悄悄完成蓄力,短期至中期將迎來劇烈分化,要麼暴漲破局,要麼回調承壓。今天不玩虛的,結合最新鏈上數據、監管消息和機構動向,拆解3個核心標的,明確漲跌邏輯、布局點位和止盈止損策略,帶你避開陷阱、精準吃肉,錯過這波,可能又要等半年!先明確大前提:當前幣圈已告別“普漲牛市”,進入“雙軌制”新格局——合規主流資產受機構加持,波動率下降但趨勢明確;小眾賽道優質幣種依托核心敘事,有望逆勢爆發;而無價值山寨幣則會被邊緣化,面臨大跌風險。我們的布局核心是“抓主線、棄垃圾”,聚焦有真實邏輯支撐的標的。
第一個核心標的:BTC(比特幣)——合規時代的“壓艙石”,短期震盪、中期看漲$BTC 最新邏輯:3月20日,美SEC與CFTC聯合發布68頁監管指引,明確BTC不屬於證券,納入合規體系,這一信號徹底打消機構入場顧慮;加上紐交所母公司ICE戰略投資OKX,掌控加密資產定價權,主流資金正加速布局BTC。鏈上數據顯示,近7日BTC持倉地址數增長8.3%,機構持倉占比提升至41%,算力維持在350 EH/s以上,拋壓持續縮減,短期震盪是機構吸籌的典型特徵,中期上漲邏輯已完全打開。
布局策略:入場價分兩檔——穩健
查看原文粉絲們集合!近期幣圈看似震盪平淡,實則暗流湧動——監管規則重寫、機構資金入場、賽道輪動加速,很多人困在“利好不漲”的迷局裡,卻不知一批潛力幣種已悄悄完成蓄力,短期至中期將迎來劇烈分化,要麼暴漲破局,要麼回調承壓。今天不玩虛的,結合最新鏈上數據、監管消息和機構動向,拆解3個核心標的,明確漲跌邏輯、布局點位和止盈止損策略,帶你避開陷阱、精準吃肉,錯過這波,可能又要等半年!先明確大前提:當前幣圈已告別“普漲牛市”,進入“雙軌制”新格局——合規主流資產受機構加持,波動率下降但趨勢明確;小眾賽道優質幣種依托核心敘事,有望逆勢爆發;而無價值山寨幣則會被邊緣化,面臨大跌風險。我們的布局核心是“抓主線、棄垃圾”,聚焦有真實邏輯支撐的標的。
第一個核心標的:BTC(比特幣)——合規時代的“壓艙石”,短期震盪、中期看漲$BTC 最新邏輯:3月20日,美SEC與CFTC聯合發布68頁監管指引,明確BTC不屬於證券,納入合規體系,這一信號徹底打消機構入場顧慮;加上紐交所母公司ICE戰略投資OKX,掌控加密資產定價權,主流資金正加速布局BTC。鏈上數據顯示,近7日BTC持倉地址數增長8.3%,機構持倉占比提升至41%,算力維持在350 EH/s以上,拋壓持續縮減,短期震盪是機構吸籌的典型特徵,中期上漲邏輯已完全打開。
布局策略:入場價分兩檔——穩健
- 打賞
- 按讚
- 回覆
- 轉發
- 分享
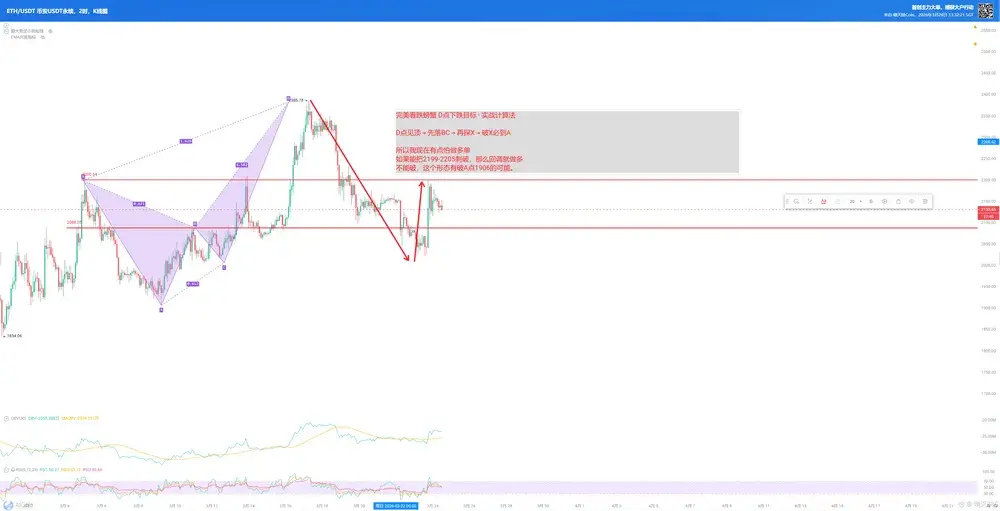
$ETH 2026-3-26精准多單布局,把握波段盈利🔥 實時喊單|波段多單機會來襲,精准點位已鎖定,跟上節奏穩抓收益 💹經過短期盤面梳理與技術面佐證,當前走勢符合做多邏輯,避開震蕩陷阱,給出明確可執行的交易策略,新手也能清晰跟上,老粉直接落地操作👇✅ 核心交易策略📌 進場點位:2110附近(可小幅浮動1-2個點,現價附近直接進場,無需猶豫)🛡️ 止損點位:2090(嚴格止損,不扛單、不補倉!守住風險底線,避免虧損擴大,這是交易盈利的核心前提)🎯 止盈點位:2180附近(第一止盈位,到達後可分批止盈,留部分倉位博弈延伸空間,穩健為主,不貪多)📊 邏輯解析當前盤面震蕩整理後,下方支撐力度強勁,2090一線形成有效支撐位,上方空間已打開,2110附近進場性價比拉滿,止損空間合理,止盈收益可觀,符合短期波段交易邏輯,兼顧安全性與盈利性✅⚠️ 重要提醒(必看)1. 嚴格執行止損止盈,不隨意修改點位,市場瞬息萬變,紀律性是盈利的關鍵,切勿抱有僥倖心理;2.倉位合理控制,建議輕倉進場(2-3成),避免滿倉操作,預留資金應對突發盤面波動;3.本文僅為技術分析與交易建議,不構成任何投資指導,市場有風險,交易需謹慎,盈虧自負;4.進場後實時關注盤面,若跌破止損位立即離場,不扛單、不戀戰,保住本金才有下次盈利機會。💬 跟上節奏@浩哥—實盤交易 ,同步操作!進場、止盈、止損同步更新,一
ETH-0.57%

- 打賞
- 按讚
- 回覆
- 轉發
- 分享
🚀 如果我必須選擇一個長期潛力的項目… 那就是 $XRP 👀不是最響亮的幣種。也不是最炒作的。但有時,安靜的建設者贏得最大的。以下是為什麼 $XRP 可能是這個週期真正的黑馬 👇🌍 現實世界的採用XRP 不僅僅是另一個投機資產 — 它已經被銀行和金融機構探索和用於跨境支付。⚡ 速度與可擴展性XRP 分類帳上的交易在幾秒鐘內結算,費用極低。在一個向即時金融轉變的世界中,這是一個巨大的優勢。📈 重新評估潛力如果採用在全球金融網絡中擴展,XRP 不僅僅是緩慢增長 — 它可以進行激進的重新定價。基於實用性的需求與基於炒作的上漲有著不同的影響。⚖️ 監管定位目前,XRP 的一個最大優勢是透明度。雖然許多項目仍面臨不確定性,但 XRP 已經朝著監管接受邁進 — 這在長期內降低了風險。但讓我們保持平衡 👇⚠️ 進展取決於機構採用⚠️ 市場週期仍然嚴重影響價格⚠️ 存在來自其他支付專注鏈的競爭儘管如此,與許多山寨幣相比,XRP 正在進行一場不同的遊戲。🔍 其他項目呢?$HBAR 提供企業級技術。$XLM 專注於金融包容性。$ALGO 具有強大的基本面和創新。所有項目都很穩健 — 毫無疑問。但 XRP 脫穎而出,因為它已經在加密和傳統金融之間架起了橋梁。📊 洞察:從長遠來看,贏家不僅僅是最先進的鏈 — 他們將是被廣泛採用的鏈。採用 + 可擴展性 + 監管一致性 = 真實的持久力。�
XRP1.27%
- 打賞
- 2
- 回覆
- 轉發
- 分享
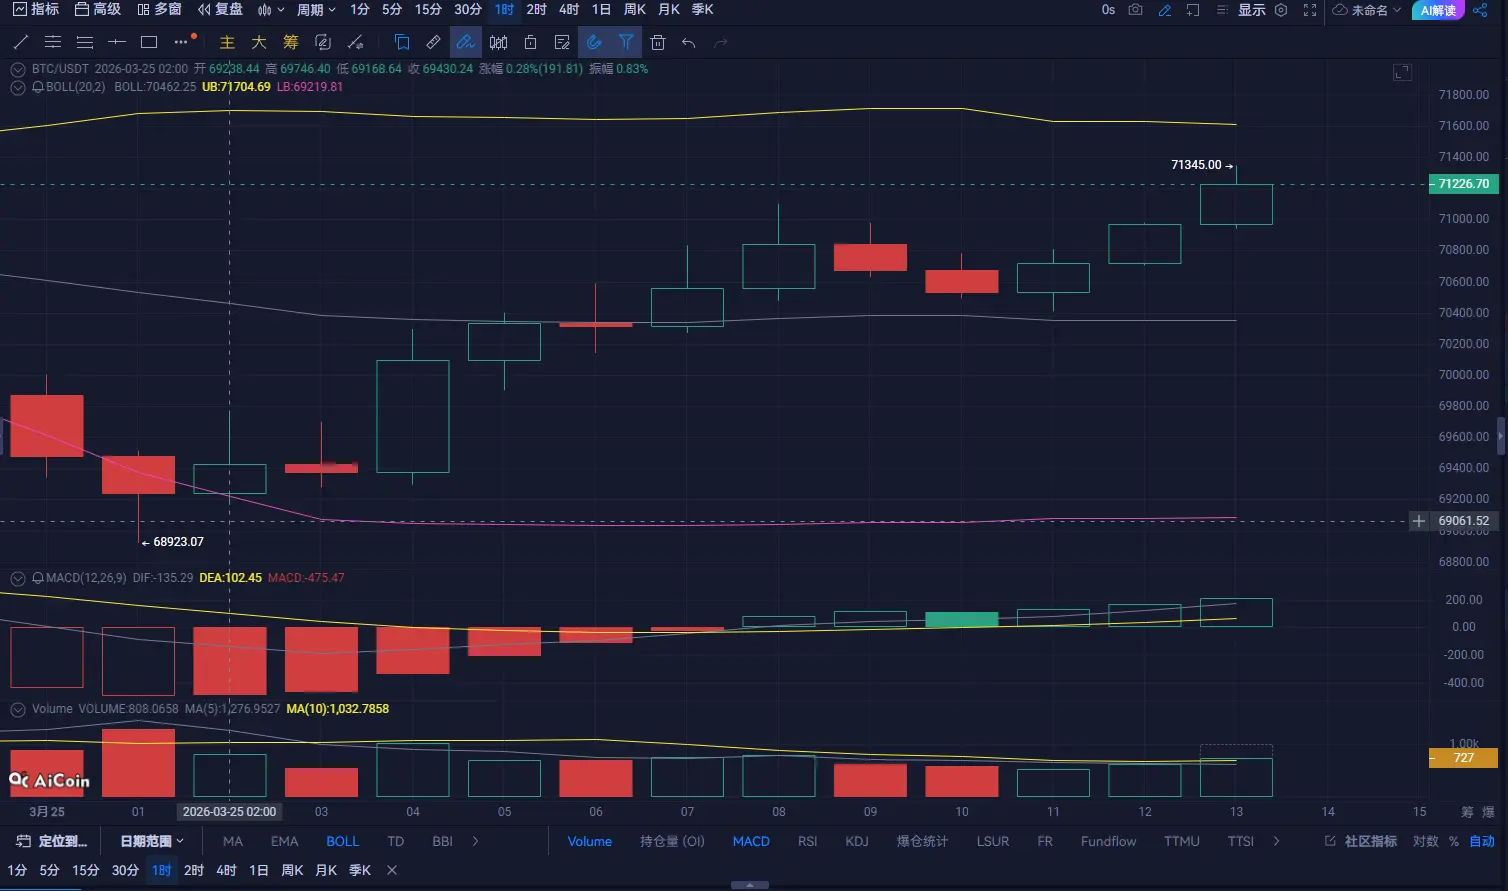
$BTC $BTC 2026-3-25午盤分析及走勢:🔥BTC 1H 級別精准解析:71345 高點已現,接下來必走這一步!作為盯盤 8 年的交易員,不玩虛的,直接結合技術面 + 鏈上 + 消息面三維拆解,給你明確的多空節奏!📈 技術面:小時線走出 "逼空上攻",但高點已近!看這張 1H 圖,價格連續陽線拉升,直接捅破 71000 壓力位,最高摸到71345,布林帶上軌被頂開,MACD 紅柱雖延續,但MA7 與 MA14 形成的短期死叉信號已顯現⚠️。當前價格站穩 BOLL 中軌,但上軌 71600 已是強壓區 —— 這不是趨勢反轉的信號,是短線資金拉高出貨的典型形態!下方69000-69200是核心支撐帶,剛才幾次下探都被快速拉回,說明多頭還在護盤,但支撐強度正在減弱,別追高!🧾 消息面 + 鏈上:機構在 "悄悄撤",散戶在 "盲目衝"!最新消息:紐交所徹底取消 BTC ETF 期權 2.5 萬份持倉上限,看似利好,實則是機構給大資金留了 "快速離場" 的通道🏦。鏈上數據更明顯:近 3 天交易所 BTC 淨流出 1.28 萬枚,巨鯨地址(745 枚、721 枚大額轉賬)頻繁從平台轉冷錢包 —— 這是 "長期持有" 的信號嗎?不,是機構在規避短期拋壓!反觀市場,恐慌貪婪指數回升,散戶跟風衝多,剛好給機構送籌碼📉。🎯 我的堅定判斷 + 操作策略短期結論:接下來 1-3
BTC0.6%
- 打賞
- 1
- 回覆
- 轉發
- 分享
$ETH 2026-3-25午盤分析及走勢:🔥ETH 一小時級別強勢破局!多頭信號明確,目標直指新高作為深耕幣圈多年的交易員,今天直接給大家拆解 ETH 一小時級別盤面,觀點明確,不模稜兩可!先看核心技術面:從附圖能清晰看到,ETH 當前一小時 K 線站穩 BOLL 上軌(UB2178.73),上軌持續向上開口,這是極強的多頭發散信號,說明短期上漲動能完全沒被遏制。下方 MACD 指標中,DIF(4.83)持續運行在 DEA(3.46)上方,紅柱雖有小幅波動但整體維持強勢,多頭勢能在持續累積,沒有出現頂背離的衰竭信號。再看量能配合:今日成交量(VOLUME)明顯放大,MA10 均量同步抬升,量價齊升的形態徹底打破了前期震盪僵局。前期低點 2102.00 成為堅實支撐,多頭多次回踩都能快速拉回,說明下方承接力極強,資金進場意願明確。消息面與鏈面同步共振:近期以太坊 Layer2 生態活躍度持續攀升,鏈上轉賬量、DeTVL 鎖倉量穩步增長,基本面給 ETH 提供了強力支撐。同時市場對加密貨幣的風險偏好持續回暖,沒有重大利空消息干擾,技術面與基本面形成完美共振。短期走勢判斷:一小時級別多頭趨勢確立,接下來大概率會測試 2180-2200 區間壓力位。只要不有效跌破 BOLL 中軌,就堅定持有多單思路,回調就是加倉機會!幣圈交易講究順勢而為,當前 ETH 多頭趨勢明朗,別被短期小幅震盪
ETH-0.57%
- 打賞
- 按讚
- 回覆
- 轉發
- 分享
3月下旬至中期币圈布局指南:3大潜力币种,涨跌逻辑+實操點位全拆解
當前幣圈正處於多空交織的關鍵節點——3月24日香港首批穩定幣牌照落地、美國SEC取消ETF期權持倉上限,機構資金加速入場,同時全網24小時爆倉超5.5億美元,多單佔比超80%,短線波動劇烈。很多人糾結「抄底還是觀望」「哪些幣種能抓住中期紅利」,今天我結合最新鏈上數據、監管消息和機構動向,拆解3個短期至中期(1-4周)最具漲跌潛力的幣種,把入場價、拋售價和布局邏輯講透,幫你避開陷阱、精準把握節奏!先明確核心前提:當前市場由宏觀經濟、機構資金、監管政策三大因素主導,BTC市值佔比接近58%,仍是市場錨點,中小幣種需依託主流賽道敘事(RWA、L2、AI)才有持續行情,盲目追高山寨幣必踩坑。以下3個幣種,覆蓋穩健型、彈性型、高潛力型,適配不同風險偏好的粉絲,每一個都有明確的鏈上數據和消息面支撐,絕非空談。第一個:BTC(比特幣)—— 穩健壓艙石,中期看漲,短線震盪$BTC 作為數字黃金和機構配置核心,BTC的中期走勢直接決定整個市場的方向。最新鏈上數據顯示,截至3月24日,BTC交易所淨流出1.28萬枚,長期地址持續增持,短期投機賬戶撤離明顯,說明機構仍在悄悄吸籌,長期籌碼集中度提升。消息面來看,美國SEC取消比特幣現貨ETF期權持倉上限,機構交易空間大幅放開,疊加特朗普暫停針對伊朗能源設施軍事打擊,避險情緒消退後,BTC
查看原文當前幣圈正處於多空交織的關鍵節點——3月24日香港首批穩定幣牌照落地、美國SEC取消ETF期權持倉上限,機構資金加速入場,同時全網24小時爆倉超5.5億美元,多單佔比超80%,短線波動劇烈。很多人糾結「抄底還是觀望」「哪些幣種能抓住中期紅利」,今天我結合最新鏈上數據、監管消息和機構動向,拆解3個短期至中期(1-4周)最具漲跌潛力的幣種,把入場價、拋售價和布局邏輯講透,幫你避開陷阱、精準把握節奏!先明確核心前提:當前市場由宏觀經濟、機構資金、監管政策三大因素主導,BTC市值佔比接近58%,仍是市場錨點,中小幣種需依託主流賽道敘事(RWA、L2、AI)才有持續行情,盲目追高山寨幣必踩坑。以下3個幣種,覆蓋穩健型、彈性型、高潛力型,適配不同風險偏好的粉絲,每一個都有明確的鏈上數據和消息面支撐,絕非空談。第一個:BTC(比特幣)—— 穩健壓艙石,中期看漲,短線震盪$BTC 作為數字黃金和機構配置核心,BTC的中期走勢直接決定整個市場的方向。最新鏈上數據顯示,截至3月24日,BTC交易所淨流出1.28萬枚,長期地址持續增持,短期投機賬戶撤離明顯,說明機構仍在悄悄吸籌,長期籌碼集中度提升。消息面來看,美國SEC取消比特幣現貨ETF期權持倉上限,機構交易空間大幅放開,疊加特朗普暫停針對伊朗能源設施軍事打擊,避險情緒消退後,BTC
- 打賞
- 按讚
- 回覆
- 轉發
- 分享
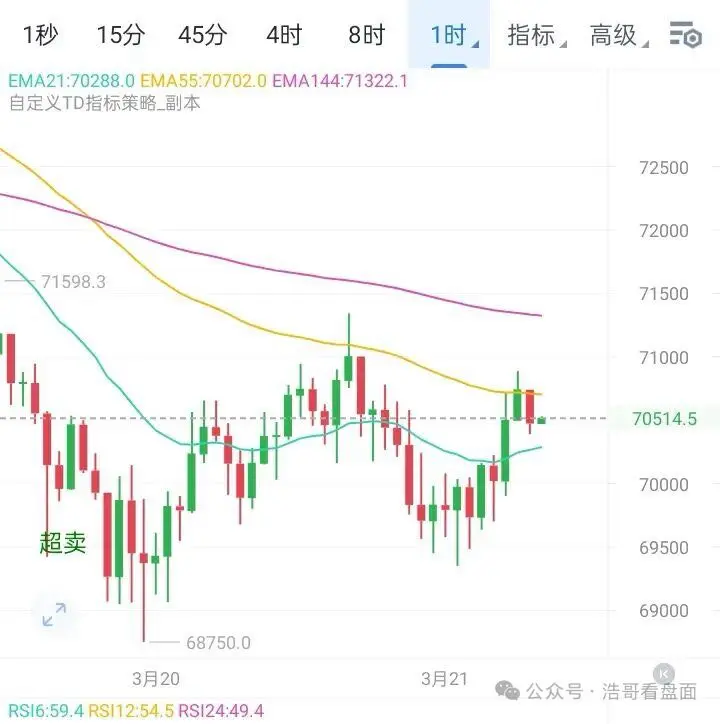
#BTC BTC early morning dropped below the 70,000 level with a low touch near 69,500, but failed to form an effective breakdown. Instead, it executed a U-shaped reversal and quickly pulled back to the 70,500 line. This long lower-shadow structure on the hourly chart is a typical false breakout signal—the bears attempted a breakthrough but couldn't hold their gains and were instead pushed back by the bulls. This indicates strong buy support near 69,500, and the 70,000 level has transformed from a previous resistance level into short-term support.
From a technical indicator perspective, the hourl
From a technical indicator perspective, the hourl
BTC0.63%
- 打賞
- 按讚
- 回覆
- 轉發
- 分享
短期至中期币圈潛力幣種解析:精準佈局,把握漲跌紅利
當前幣圈處於極度恐慌與局部回暖的矛盾節點,貪婪恐懼指數僅10,BTC市值佔比達58.19%,但部分幣種已出現資金暗中佈局的信號——結合3月21日最新鏈上數據、八部委監管新規及衍生品市場動態,今天就給大家扒3個短期至中期(1-3個月)大概率出現大漲/大跌走勢的核心幣種,附精準佈局策略、入場離場價位,新手也能直接參考,拒絕模稜兩可,只講實操幹貨!先明確核心前提:當前市場受監管高壓與衍生品驅動雙重影響,八部委206號通知已全面封殺境內虛擬貨幣相關業務,參與即違規、虧損自負,以下分析僅為市場走勢研判,不構成投資建議,所有操作需謹慎,風險自擔。結合鏈上持倉、成交量、多空比及消息面,篩選出BTC、WAXP、PHA三大重點幣種,走勢分化明顯,佈局邏輯各有側重。第一個,BTC(比特幣):中期看漲但短期震盪,機構資金主導走勢,最具確定性。最新鏈上數據顯示,當前BTC價格報70478.10美元,24H成交額545.51億美元,持倉量389.96億美元,Binance-BTC多空持倉人數比1.58,大戶賬戶多空比1.61,多頭佔優但未出現盲目追漲跡象。消息面來看,3月17日BTC曾突破75000美元關口,由衍生品市場空頭平倉驅動,星橋資本指出,此次突破後雖有回調,但73500美元成為關鍵支撐位,若能站穩,中期有望衝擊78000-78800美元區間;若跌
當前幣圈處於極度恐慌與局部回暖的矛盾節點,貪婪恐懼指數僅10,BTC市值佔比達58.19%,但部分幣種已出現資金暗中佈局的信號——結合3月21日最新鏈上數據、八部委監管新規及衍生品市場動態,今天就給大家扒3個短期至中期(1-3個月)大概率出現大漲/大跌走勢的核心幣種,附精準佈局策略、入場離場價位,新手也能直接參考,拒絕模稜兩可,只講實操幹貨!先明確核心前提:當前市場受監管高壓與衍生品驅動雙重影響,八部委206號通知已全面封殺境內虛擬貨幣相關業務,參與即違規、虧損自負,以下分析僅為市場走勢研判,不構成投資建議,所有操作需謹慎,風險自擔。結合鏈上持倉、成交量、多空比及消息面,篩選出BTC、WAXP、PHA三大重點幣種,走勢分化明顯,佈局邏輯各有側重。第一個,BTC(比特幣):中期看漲但短期震盪,機構資金主導走勢,最具確定性。最新鏈上數據顯示,當前BTC價格報70478.10美元,24H成交額545.51億美元,持倉量389.96億美元,Binance-BTC多空持倉人數比1.58,大戶賬戶多空比1.61,多頭佔優但未出現盲目追漲跡象。消息面來看,3月17日BTC曾突破75000美元關口,由衍生品市場空頭平倉驅動,星橋資本指出,此次突破後雖有回調,但73500美元成為關鍵支撐位,若能站穩,中期有望衝擊78000-78800美元區間;若跌
ETH-0.57%
- 打賞
- 按讚
- 回覆
- 轉發
- 分享
現在在幣圈賺100萬,還有那麼難嗎?$BTC $ETH $OPN 其實,路徑是有的,只不過很多人看不到,或者根本不願意走第一種:穩紮穩打的路最穩的辦法是,你準備個5萬到15萬人民幣,轉成U,放在幣安這種大交易所裡然後做個簡單的定投計劃——每月定投,BTC買50%,ETH買40%,剩下10%買SOL別看盤,別頻繁操作,執行計劃堅持3-5年。之前比特幣地位的時候大部分人這麼做,最終都能賺100萬,這條路幾乎沒人競爭,成功率極高第二種:硬核路徑這條路適合技術型玩家。想通過撸項目空投、搶新鏈資格來賺取百萬,你得掌握一些技能:比如Python腳本,遠程服務器操作,批量錢包操作……你能學得會這些,就能成為所謂的"鏈上農民",通過日復一日的空投獵殺,獲得百萬收益但這條路門檻高,學習成本大,能賺到的也是辛苦錢第三種:精準的選幣如果你不想那麼枯燥,且有點運氣加判斷力,那就可以嘗試選中一個早期爆發的幣例如,找一些漲幅超過十倍的小幣,背後有風口和大佬站台支持但這一切要靠信息敏銳度,混圈子、找高手請教,以及精準的判斷力。能選對、敢止盈的人,才能在這條路上走得遠這三條路,你可以對照一下,看看哪條適合你。重要的是,願不願意為賺錢承擔這份枯燥和壓力。如果你能接受,那就現在行動,別只停留在想象階段。當然,幣圈也有其他"捷徑"路,比如發幣或做盤子之類的。這些做起來確實輕鬆,但你得有足夠的認知和資源,否則很容易栽跟頭
BTC0.6%
- 打賞
- 按讚
- 回覆
- 轉發
- 分享
$BTC 如何在币圈生存!每個剛進币圈的人,都懷揣著一個暴富夢。想抓熱點、追新币搏拉盤、蹭情緒。但幾個月後,你會發現——真正能活下來的新人,最後都乖乖回到大餅(比特币)身邊。01. 大餅,是币圈的底線,不是老土的信仰,很多新人覺得,大餅太穩了,不刺激。他們更想去試山寨、合約、DeFi、MEME可是你要知道:在币圈,刺激的盡頭是歸零。大餅不是讓你暴富的捷徑,而是讓你不死的底線。當市場崩得你懷疑人生,當各種"項目方跑路""插針清倉"的新聞滿天飛,只有比特币——還在那裡,像一塊黑色的基石。02. 新人最容易死的地方:不懂得"慢"币圈新人最常犯的錯誤就是:太急。看到別人暴賺就心動,看到跌就恐慌。他們忘了,币圈最公平的一件事——就是時間。你定投大餅三年,比任何短線都更容易看到結果。比特币的漲跌,不是運氣,而是耐心和認知的回報。03. 想賺快錢?先想清楚自己是不是"籌碼"在币圈,你要明白:你不是在玩币,币在玩你。市場需要情緒,需要人接盤。而新人最容易被利用的,就是那種"害怕錯過"的衝動。如果你連底層邏輯都沒搞懂,卻想靠短線賺錢,那你就是別人的流動性。要想不被割,先站到被割的對面。而那一邊的人,通常手裡都握著比特币。04. 在币圈活下來的新人,都明白一個道理暴富的故事每天都有,活著的玩家卻越來越少。生存,比賺錢更重要。先學會不虧,再去想賺。先抱緊大餅,再去探索世界。當你真正熬過一個完整週期,你
BTC0.63%
- 打賞
- 2
- 回覆
- 轉發
- 分享
3月必看!短期至中期潛力幣種解析(附精準佈局方案)
粉絲們集合!隨著2026年加密行業合規化進程加速,Coinbase跨界上線股票交易、監管風向從"限制"轉向"融合",幣圈正式告別野蠻生長,進入正規軍博弈階段✨ 很多人糾結短期踏空、中期套牢,今天我結合最新鏈上數據、一手消息面,篩選出3個有明確大漲/大跌預期的幣種,拆解精準佈局邏輯,新手也能看懂,老粉直接抄作業!先明確核心前提:當前市場處於"政策轉暖+資金重新配置"的關鍵週期,美股加密概念股聯動上漲,鯨魚資金開始從BTC切換至高彈性標的,但國內八部門重申虛擬貨幣境內交易非法,風險與機遇並存,佈局前務必控制倉位,杜絕滿倉博弈。一、潛力大漲幣種(短期爆發+中期向好,優先佈局)1. ALEX(BTC生態龍頭,短期看漲,中期估值重構)$ALEX核心邏輯:作為Stacks公鏈(比特幣Layer2龍頭)的頂級DeFi協議,ALEX覆蓋Swap、借貸、BRC-20訂單簿交易,完美貼合當前BTC生態的熱度風口。最新鏈上數據顯示,其活躍錢包達53401個,24小時交易量700萬美元,持幣地址穩步增長,且背後有Spartan Capital、DWF Labs等頂級機構加持,已完成兩輪融資共計1580萬美元,生態落地性極強。消息面加持:近期Stacks公鏈升級,進一步提升BTC跨鏈效率,ALEX作為生態核心協議,有望承接更多BTC生態流量;同時Hotco
查看原文粉絲們集合!隨著2026年加密行業合規化進程加速,Coinbase跨界上線股票交易、監管風向從"限制"轉向"融合",幣圈正式告別野蠻生長,進入正規軍博弈階段✨ 很多人糾結短期踏空、中期套牢,今天我結合最新鏈上數據、一手消息面,篩選出3個有明確大漲/大跌預期的幣種,拆解精準佈局邏輯,新手也能看懂,老粉直接抄作業!先明確核心前提:當前市場處於"政策轉暖+資金重新配置"的關鍵週期,美股加密概念股聯動上漲,鯨魚資金開始從BTC切換至高彈性標的,但國內八部門重申虛擬貨幣境內交易非法,風險與機遇並存,佈局前務必控制倉位,杜絕滿倉博弈。一、潛力大漲幣種(短期爆發+中期向好,優先佈局)1. ALEX(BTC生態龍頭,短期看漲,中期估值重構)$ALEX核心邏輯:作為Stacks公鏈(比特幣Layer2龍頭)的頂級DeFi協議,ALEX覆蓋Swap、借貸、BRC-20訂單簿交易,完美貼合當前BTC生態的熱度風口。最新鏈上數據顯示,其活躍錢包達53401個,24小時交易量700萬美元,持幣地址穩步增長,且背後有Spartan Capital、DWF Labs等頂級機構加持,已完成兩輪融資共計1580萬美元,生態落地性極強。消息面加持:近期Stacks公鏈升級,進一步提升BTC跨鏈效率,ALEX作為生態核心協議,有望承接更多BTC生態流量;同時Hotco
- 打賞
- 按讚
- 回覆
- 轉發
- 分享
短期至中期幣圈潛力幣種解析:精准布局,把握漲跌紅利粉絲們集合!當下幣圈早已告別“盲目炒幣”的野蠻時代,2026年政策轉折點顯現、機構動作頻頻,真正的機會藏在鏈上數據和消息面的細節裡🔥 今天不玩虛的,直接給大家拆解3個短期(1-4週)至中期(1-3個月)最具漲跌潛力的幣種,結合最新鏈上動態、消息面邏輯,把入場價、拋售價、布局思路一次性說透,新手能跟上,老粉能加倉,錯過這次,可能又要等下一個周期!先明確核心前提:2026年加密行業已從“監管壓制”轉向“合規融合”,Coinbase上線股票交易、BNB Chain穩定幣交易爆發,叠加國內八部門監管重申,市場分化加劇——優質幣種將借勢崛起,垃圾幣種加速淘汰,我們布局的核心是“抓主線、控風險”,拒絕盲目跟風追高。第一個潛力幣種:Gigachad(GIGA)—— 中期看漲,共識驅動的MEME龍頭為什麼看好它?最新鏈上數據顯示,GIGA社區互動量達470萬次,遠超DOGE、PEPE等老牌MEME幣,前五大地址僅持有23.46%代幣,去中心化程度極高,不存在大戶砸盤風險,且已登錄29家交易所,流動性充足。消息面來看,MEME賽道分化明顯,具備強社區共識和獨特文化敘事的幣種成為資金首選,GIGA依托“自我提升”文化符號,用戶自發造梗能力突出,共識黏性難以被短期情緒瓦解,中期上漲邏輯扎實。布局策略:短期回調即是入場良機,入場價鎖定0.0085-0.0
查看原文- 打賞
- 按讚
- 回覆
- 轉發
- 分享
3月短期至中期币圈潜力币种解析:精准布局,把握涨跌红利粉丝们集合!近期币圈走出“弱势震荡、资金避险”的格局,BTC失守7万关口后震荡修复,ETH逆势走强,山寨币分化加剧,不少人在震荡中踏空或被套,直呼“看不懂行情”✨ 今天不玩虚的,结合3月最新链上数据、机构动向和监管消息,筛选出3个短期(1-7天)至中期(1-2周)大概率出现明确涨跌走势的币种,拆解核心逻辑、布局策略,甚至精准到入场和止盈止损点位,新手也能跟着节奏踩准红利,避开深坑!先明确当前市场大背景:截至3月12日上午,BTC重回7万关口报70203美元,ETH站稳2055美元,全网合约清算量较前日大幅下降60%,杠杆风险缓解;同时美国SEC出台加密监管指引、香港3月发放首批稳定币牌照,监管框架趋于清晰,机构资金逆势加仓,市场情绪从恐慌逐步回暖,但地缘冲突仍带来不确定性,整体呈现“主流币震荡修复、山寨币结构性分化”的格局,这也是我们布局的核心前提——不追高、不抄底,跟着数据和消息面顺势而为。第一个核心币种:ETH(以太坊)—— 逆势强势,中期看涨,稳健首选核心逻辑:ETH是近期主流币种中表现最亮眼的,7日涨幅达14.88%,24h逆势上涨,核心支撑来自三大利好。链上数据显示,ETH质押量稳步提升,质押ETF审批推进,机构资金持续布局,同时Layer2生态持续扩容,Arbitrum、Optimism等二层解决方案提升交易速度、降
ETH-0.57%
- 打賞
- 按讚
- 回覆
- 轉發
- 分享
晚上八點半美國2月CPI數據公布,市場預期年率持平,月率高於前值,作為通脹核心指標,這個數據會直接牽制美聯儲降息的節奏,目前市場預期6月份降息概率為50%現在就看數據公布後,降息預期是下跌還是增長了現在還有粉絲不會做數據行情,直接來聊天室看我實時做單!
查看原文
- 打賞
- 按讚
- 回覆
- 轉發
- 分享
本金不到兩千U?先別想暴富,我教你先活下來👉三個月從1.5K做到4.2萬,方法比你想的簡單。先潑點冷水:本金不到兩千U,最該學的不是炒爆利,而是別把錢先虧光。幣圈的遊戲規則很簡單,本金在,才有機會翻倍;本金沒了,談什麼機會都白搭。$KITE 我記得去年帶了一個新手,從1.5K起步,三個月收了4.2萬,全程沒爆倉,沒大回撤崩盤。他問我祕訣,我說靠的不是運氣,也不是梭哈某只妖幣,而是三條看起來笨,但實用到爆的規則。第一件事:分倉,別滿倉。把錢拆開,動用一部分日內交易,一部分波段,剩下留著保命錢。不管行情多誘人,別一次全梭上,任何時候不死,你都有翻盤機會。第二件事:只做確定性行情。橫盤震蕩就當沒看見,方向不明就空倉。別為了感覺賺錢亂下單,錯過沒關係,虧錢才要命。行情不是天天有,但本金每天都在消耗,這句話必須記住。第三件事:規則定死,情緒清零。單筆止損控制在2%,賺到一定利潤先減倉,盈利達到目標再提一部分。虧損時別想着加倉攤平,不賭反彈,不扛單,不幻想奇蹟。想逆襲的人,先穩住本金,這比任何所謂的“暴富祕技”都可靠。幣圈想快?最快的方式反而是先慢下來。分倉、控倉、等機會,這些聽起來不刺激,但能讓你少踩無數坑。等你本金穩了,再談翻倍,才是真正的爽。關注#高盛成XRP现货ETF最大持有机构 ,正在布局,一起上車!
查看原文- 打賞
- 2
- 回覆
- 轉發
- 分享
熱門話題
查看更多42.25萬 熱度
9430.79萬 熱度
11.79萬 熱度
184.7萬 熱度
82.89萬 熱度
置頂
🏆 WCTC S8 風雲熱議:曬戰績,贏豪禮
廣場發帖即參與,WCTC 限量定制周邊、GT、卡券等您拿!
🎁 四大獎勵賽道:
1️⃣ 組隊禮: 一鍵分享組隊,抽 100 人送 50U 體驗券。
2️⃣ 大神禮: 寫攻略,贏 20U GT + 官方置頂。
3️⃣ 戰神禮: 晒個人 PK 戰績截圖,送 WCTC 紀念 T 恤。
4️⃣ 領頭羊: 晒團隊戰績,熱度前 10 贏全場流量推廣。
👉 帶話題 #WCTC交易王PK 發帖,鎖定你的專屬獎勵!
🔗 https://www.gate.com/competition/wctc-s8
詳情:https://www.gate.com/announcements/article/5090710,000 USDT 悬赏,寻找Gate广场跟单金牌星探!🕵️♀️
挖掘顶级带单员,赢取高额跟单体验金!
立即参与:https://www.gate.com/campaigns/4624
🎁 三大活动,奖金叠满:
1️⃣ 慧眼识英:发帖推荐带单员,分享跟单体验,抽 100 位送 30 USDT!
2️⃣ 强力应援:晒出你的跟单截图,为大神打 Call,抽 120 位送 50 USDT!
3️⃣ 社交达人:同步至 X/Twitter,凭流量赢取 100 USDT!
📍 标签: #跟单金牌星探 #GateCopyTrading
⏰ 限时: 4/22 16:00 - 5/10 16:00 (UTC+8)
详情:https://www.gate.com/announcements/article/50848#Gate广场五月交易分享 狂歡開啟,五一紅包狂撒!🧧
發帖聊行情,紅包天天領,新人100%中獎!
🎁 福利亮點:
✅ 新人禮: 發布廣場首帖,100% 必中紅包!
✅ 發帖獎: 發帖越多,互動越多,紅包金額越大!
✅ 衝榜單: Top 100 都有獎,Gate X RedBull 積木賽車禮盒、速乾運動套裝等您拿!
立即行動,發布你的五月廣場第一帖!
👉️ https://www.gate.com/post
🗓 截止日期: 5 月 15 日
詳情:https://www.gate.com/announcements/article/50981
#BTC #ETH #GT📢 Gate 廣場|5/6 Polymarket 每日熱點預測
🎁 參與即有機會贏!隨機抽取 5 位幸運用戶,每人送 $5 代幣
📝 參與方式:
1️⃣ 參與 Polymarket 預測投票並在評論區留言
2️⃣ 帶 #Polymarket每日热点 發帖,分享您的判斷邏輯與押注策略
👇 點擊下方 Polymarket 卡片,立即參與預測
發帖掛載 Polymarket 卡片需將 App 更新至 8.17.0 及以上版本
詳情:https://gate.onelink.me/Hls0/prediction?page=detail&event_ticker=415443&source=cex