Why is Ethereum's ability to replicate the Q2/2025 growth rate more difficult compared to Bitcoin
Layer 1 (L1) blockchains are caught between long-term trust and short-term speculative waves — and Ethereum (ETH) is the clearest reflection of this situation.
In terms of development, Ethereum still leads the pack. Q4 2025 saw a record 9.1 million smart contracts deployed, an impressive figure that contrasts sharply with the reality that ETH’s price has plummeted 45%, marking the worst quarter since the 2018 bear market.
However, amid this adversity, the resilience of the ecosystem becomes evident. Developer activity remains strong, demonstrating that Ethereum’s foundation is solid and enduring — enough to sustain hopes for a long-term growth cycle based on fundamentals in 2026.
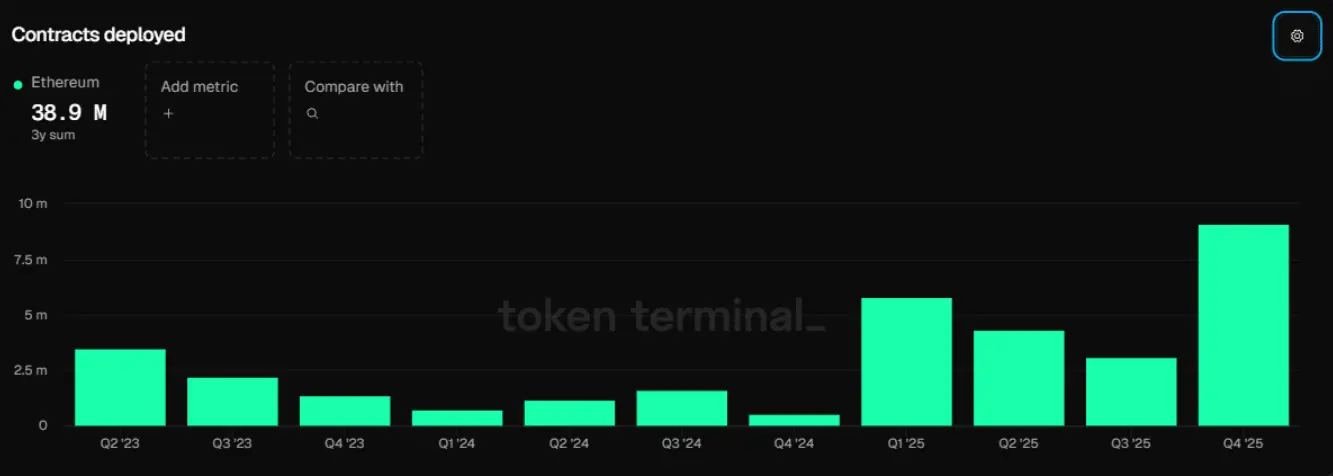 Source: Token Terminal These positive signals are also clearly visible in on-chain data. Ethereum continues to lead in NFT volume, with $12.6 million circulating through the network. DApp activity has even surged more dramatically, increasing by 1,135% and reaching $180 billion weekly. In other words, the energy from the developer community is directly translating into actual network usage.
The issue is: prices still haven’t caught up with this story. Despite such vibrant on-chain activity, Ethereum’s performance lags behind Bitcoin by nearly 1.5 times — a significant gap compared to previous growth cycles.
And from here, the big question arises: can ETH replicate the breakout seen in Q2 when compared to BTC, or will this divergence persist?
On-chain strength driving off-chain speculation
Ethereum’s short-term outlook, which is increasingly negative, is becoming a significant obstacle to long-term growth.
Although ecosystem development remains high, ETH’s price has broken below the $2,000 mark amid Vitalik Buterin’s continuous sales. Meanwhile, on-chain indicators show market sentiment heavily influenced by leveraged trading, while accumulation from spot markets is nearly absent.
In another development, the ETH/BTC ratio continues to fluctuate within a narrow range, recording a 0.28% decline over the past week. This not only reflects Ethereum’s weak price structure but also indicates that significant capital flow from BTC to ETH has yet to materialize.
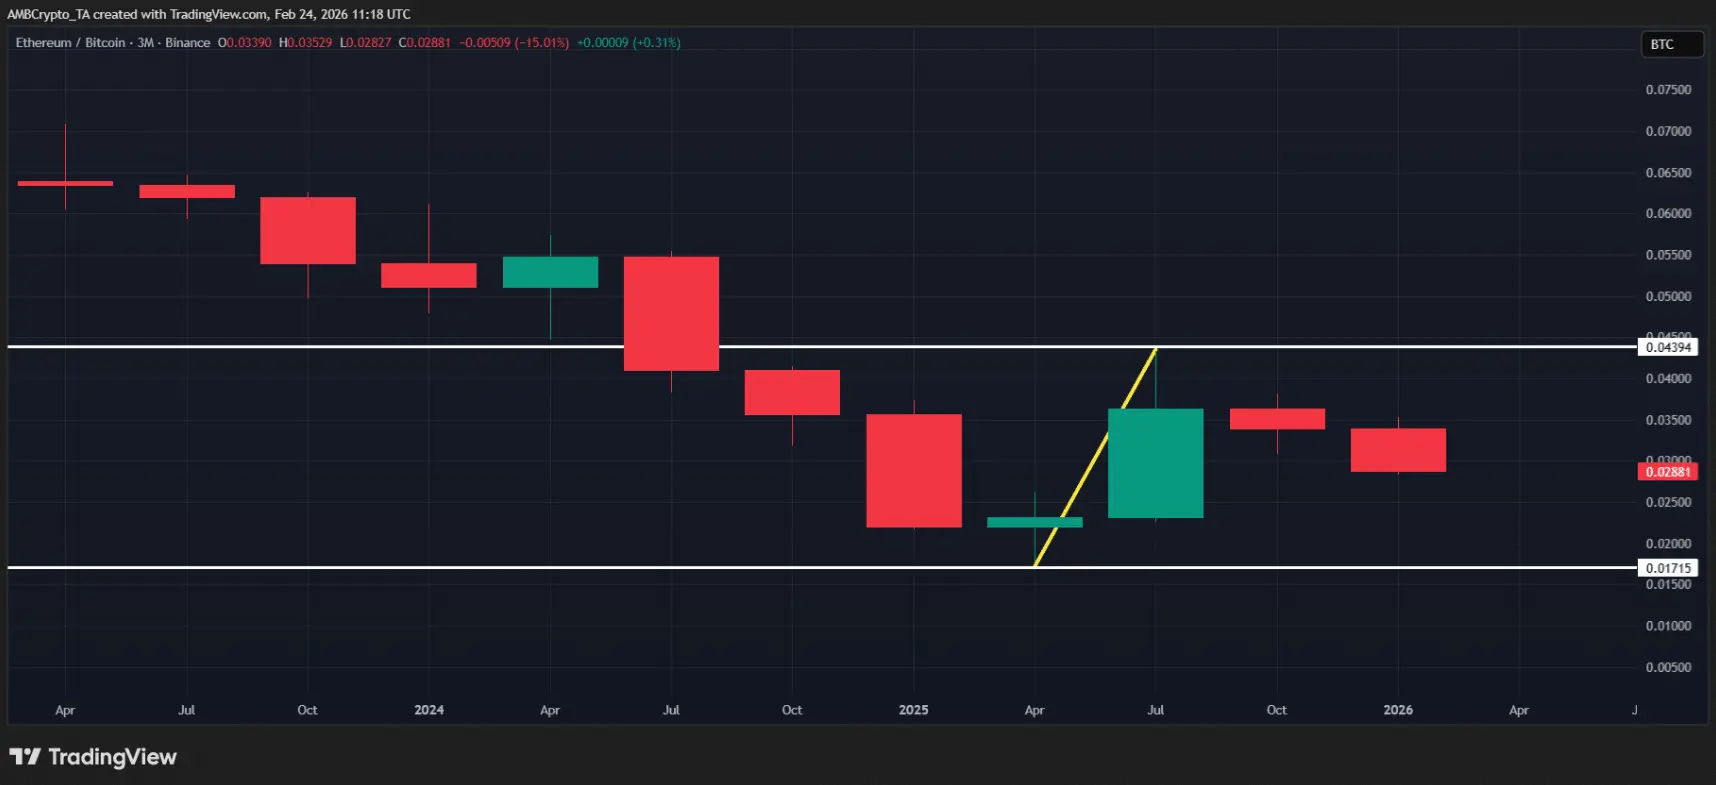 3-month ETH/BTC chart | Source: TradingView Overall, speculative factors are overshadowing investor long-term confidence.
This psychological imbalance alone is enough to hinder Ethereum’s sustainable growth potential, as the market remains driven by short-term volatility. Under these conditions, the likelihood of ETH regaining a significant outperformance over BTC like in Q2/2025 is quite low.
Conversely, if the current trend continues, ETH is likely to continue weakening relative to BTC in the upcoming Q2.
SN_Nour
Related Articles
[Cryptocurrency Inflows and Outflows] US dollar funds restart inflow... Bitcoin absorbs $3.3 billion
Data: If BTC drops below $64,982, the total long liquidation strength on mainstream CEXs will reach $1.498 billion.
Crypto incubator WebN Group supported by Alan Howard is about to shut down
[BTC Cycle Tracker] "$70,000 Still a Barrier"… Bitcoin rebounds to the $67,000 range, trend reversal not yet confirmed