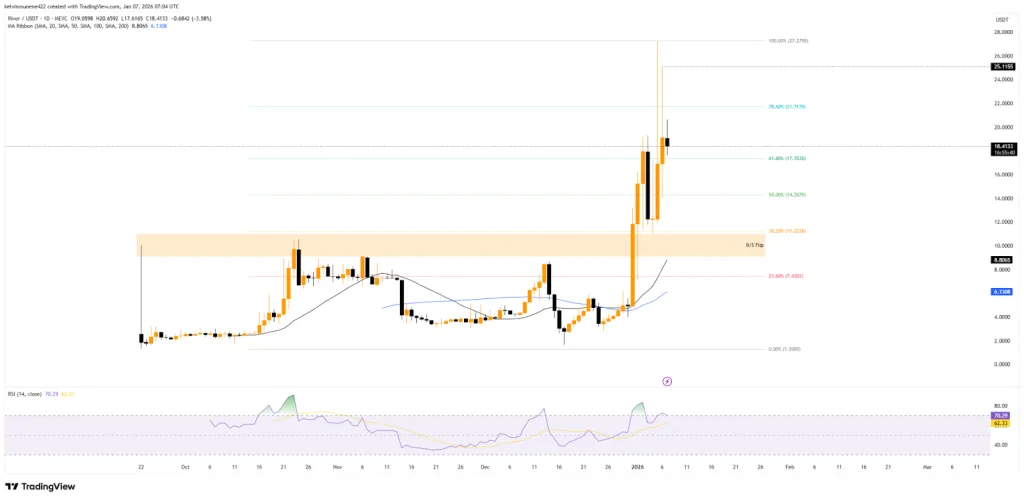
RIVER up 12% in a single day to $18.69, rebounding 216% from the $7 low point over the past week. RSI has remained in the overbought zone above 70 for a long time, ignoring warning signals from the bulls. Open interest has surged from 75 million to 108 million, with Binance perpetual contracts accounting for $20 billion of the trading volume. The 24-hour trading volume has decreased by 10%, indicating a volume contraction while prices rise, hiding potential risks. Support levels are at $17.35 and $14.28, resistance at $21.71.
Abnormal strength and technical divergence across multiple timeframes
(Source: Trading View)
RIVER continued its strong rally at the start of the new year on Wednesday, rising another 12% in the past 24 hours. Despite obvious signs of market overheating, buyers remain strong. At press time, the token’s price approaches $18.69, with a market cap of approximately $366 million, solidifying its position as one of the top short-term performers in the sector.
Higher timeframe charts show an unusually stable trend. The weekly gains have already exceeded the recent low point of 216%. Typically, such rapid gains would revert quickly, but no signs of correction have appeared yet. The monthly chart is even more impressive, with gains over 340%. Year-to-date, the increase is nearly 469%, capturing traders’ full attention on the order book.
The 20-day moving average is well below the current price, near $8.82, while the 50-day moving average hovers around $6.13. These levels have not been tested for several days. The gap between price and moving averages is large enough that any pullback could be viewed as normal market fluctuation rather than a structural threat. Such a significant divergence from moving averages is usually a warning in technical analysis, but the bulls seem to ignore this conventional rule.
However, this rally is beginning to show signs of fatigue. The Relative Strength Index (RSI) has mostly hovered around 70 in January, indicating an extremely strong upward momentum. When indicators stay in overbought territory for a long time, markets often correct, but timing such a correction is difficult. RIVER’s case is even more extreme, with RSI not only overbought but also remaining in the overbought zone for weeks, a rare phenomenon in crypto history.
RIVER Multi-timeframe Gains Summary
24 hours: +12%, trading at $18.69
Weekly: +216%, rebounded from $7 low
Monthly: +340%, remarkable monthly performance
Yearly: +469%, top annual gain
Contradictory signals of volume contraction, rising prices, and surge in open interest
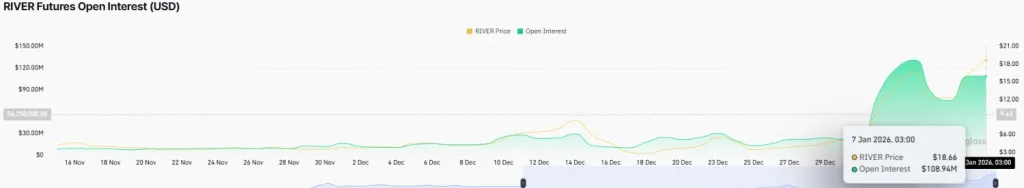
(Source: Coinglass)
Volume changes add another layer of complexity. RIVER’s 24-hour trading volume has decreased by nearly 10%, to about $37 million, indicating a slight decline in trader activity after the recent rally. This volume contraction amid rising prices is often a warning sign in technical analysis, suggesting the rally is supported mainly by a few large players or leveraged positions.
However, derivatives market data tell a different story. On-chain trading and derivatives activity further fueled RIVER’s rise. According to CoinGlass data, Binance’s perpetual contracts contributed the majority of the 24-hour derivatives volume, with about $2 billion out of a total $3.5 billion. During this period, over 12.9 million trades occurred, showing heavy leverage use and liquidity being pushed far beyond what the spot market can support.
Open interest also confirms this trend. It jumped from about $75 million on January 5 to over $108 million, typically indicating new positions being established rather than old ones being closed. This shift often reflects market confidence in its own momentum. However, concentration on a single platform can amplify emotional swings.
Activity around Binance is highly concentrated, which introduces certain risks. While liquidity is ample, positions may become one-sided, leading to larger volatility. When $20 billion in trading volume is concentrated on one platform, any technical issues or policy changes could trigger sharp swings.
Key technical levels and risk management strategies
Despite this, key technical zones remain clear. Support levels are first at around $17.35, near the 61.8% Fibonacci retracement; second at about $14.28, near the 50% Fibonacci level. If prices fall further, the $11.22 zone will come into view, which previously saw a breakout; a retest here would test support validity.
On the upside, extension lines suggest potential targets around $21.71. If momentum resumes, prices could further rise to approximately $25.11. These targets are based on Fibonacci extensions and previous highs, offering technical reference points.
For traders, RIVER currently presents a high-risk, high-reward scenario. The multi-timeframe uptrend, support levels, and increased derivatives participation all support a strong momentum, even as momentum indicators show signs of fatigue. As volume declines and leverage increases, upcoming trading sessions may reveal whether the market is preparing for consolidation or continuing higher.
Conservative investors should wait for RSI to revert to normal ranges and for volume to expand before entering. Aggressive traders might consider small positions to chase the rally, but must set strict stop-losses below $17.35, with a target at $21.71, risking a reward ratio of about 1:2. The most dangerous approach is to chase high with heavy positions when RSI is overbought, volume is contracting, and leverage is high—such operations often end in liquidation historically.
Disclaimer: The information on this page may come from third parties and does not represent the views or opinions of Gate. The content displayed on this page is for reference only and does not constitute any financial, investment, or legal advice. Gate does not guarantee the accuracy or completeness of the information and shall not be liable for any losses arising from the use of this information. Virtual asset investments carry high risks and are subject to significant price volatility. You may lose all of your invested principal. Please fully understand the relevant risks and make prudent decisions based on your own financial situation and risk tolerance. For details, please refer to
Disclaimer.
Related Articles
Middle Eastern conflict fuels "Digital Gold"! Bitcoin ETF surges by $1 billion in three days, as safe-haven asset characteristics quietly return
Against the backdrop of tense Middle East tensions, Bitcoin has recently attracted over $1 billion in ETF capital inflows, with its price once breaking through $70,000, demonstrating its potential as a "hedge asset." Analysis indicates that Bitcoin has shown better resilience than traditional assets during geopolitical crises, and the weakening of the US dollar has also boosted its performance. Future capital momentum will be a key indicator to verify Bitcoin's position.
動區BlockTempo25m ago
Bitcoin Just Flipped the Script – $96K Coming FAST
Crypto analyst Lark Davis predicts Bitcoin could rally to $89K-$96K if it closes above $70K weekly. Key indicators, including Fibonacci retracement, moving averages, and historical resistance, suggest bullish momentum, though traders remain cautious.
Coinfomania29m ago
Analysis indicates that BTC and the US dollar are strengthening simultaneously, attracting market attention. The recent key resistance level may be at $74,000.
Bitcoin price approaches the key resistance level of $74,000, with a total increase of over 10%. This rally occurs amid a decline in global stock market risk appetite and a strengthening dollar, with the dollar index rising over 1% this week to reach last year's high. The relationship between Bitcoin and the dollar has recently shown a trend of synchronized fluctuations.
GateNews49m ago
Analysis: BTC has not yet rapidly surged to $80,000, and after gold's rally slows down, funds may flow back into the crypto market.
Bitcoin fluctuates above $72,000, while Ethereum rises slightly. The market experiences consolidation; despite Bitcoin successfully breaking through the $70,000 mark, it has not quickly surged toward $80,000. In the context of easing tensions in the Middle East, risk assets are boosted. Derivatives data shows bullish sentiment remains strong, but gold-linked token futures contracts decline, indicating capital flowing into cryptocurrencies. In the options market, demand for high-strike call options increases, and overall volatility remains stable.
GateNews1h ago
Assess whether DOGE holds above $0.088 as whale selling pressure increases
Dogecoin (DOGE) is facing strong selling pressure since breaking below $0.1. During this prolonged downtrend, DOGE has broken the support level of $0.09 and touched a low of $0.088 before a slight rebound.
At the time of writing, DOGE is trading at $0.092, up 2.56% in the past 24 hours, reflecting increased volatility.
TapChiBitcoin1h ago
Hyperliquid Just Did $2.9T - The CEX Era Officially Ended
Bitcoin experienced an 8.12% increase in March 2026 after two months of losses. Historical data indicates March is typically strong for Bitcoin, with hopes for continued gains amidst market volatility and cautious sentiments among traders.
Coinfomania1h ago

