Technical analysis for January 13: SPX, DXY, BTC, ETH, XRP, BNB, SOL, DOGE, ADA, BCH
Bitcoin rally successfully pushed the price above $92,000, but higher levels are now under increasing profit-taking pressure. According to data from SoSoValue, Bitcoin ETF funds recorded a net outflow of up to $1.37 billion from Tuesday to Friday last week, indicating that cautious sentiment still dominates institutional investors.
In a social media post on X, Jurrien Timmer, Global Macro Strategist at Fidelity Investments, stated that Bitcoin is currently “moving closer to the Internet’s S-shaped curve rather than the exponential law curve.” He also warned that if BTC continues to trade sideways over the next year, the $65,000 mark could become a “life-and-death line” that determines the long-term trend of this cryptocurrency.
Nevertheless, amid short-term volatility, Strategy – the world’s largest Bitcoin holder – remains confident by purchasing an additional 13,627 BTC last week at an average price of $91,519/BTC. As a result, the total Bitcoin holdings of the company have increased to 687,410 BTC, with an average purchase price of $75,353/BTC.
So, do Bitcoin and major altcoins have enough momentum to conquer upcoming resistance levels? Let’s analyze the charts of the top 10 cryptocurrencies to find out.
Technical Analysis of SPX
The S&P 500 (SPX) surged strongly and hit a new all-time high on Friday, indicating that the bullish trend has resumed.
 Daily SPX Chart | Source: TradingView Moving averages are trending upward, and the Relative Strength Index (RSI) remains in positive territory, suggesting advantage to the bulls. The 7,000 level is a notable resistance zone but is likely to be broken. If so, the index could break out to 7,290 points.
Time is running out for the bulls. They need to push the price below the 50-day SMA (6,819) to weaken the upward momentum. If that happens, the index could decline to around 6,720 points.
Technical Analysis of DXY
The US Dollar Index (DXY) broke above the 50-day SMA (99.06) on Friday, but the bulls could not sustain the rally at higher levels.
 Daily DXY Chart | Source: TradingView Currently, the index has retreated to the 20-day EMA (98.60) – a support zone. If the price rebounds from this area, DXY is likely to move toward the resistance zone at 100.54. A close above this level would signal a new bullish trend.
Conversely, the bears will try to push the price below the 20-day EMA. If successful, the index could slide to the strong support at 97.74, indicating that DXY may continue to fluctuate within the 96.21 – 100.54 range for some time.
Technical Analysis of BTC
BTC’s correction from the resistance zone of $94,789 found support at moving averages, indicating buying interest emerging during declines.
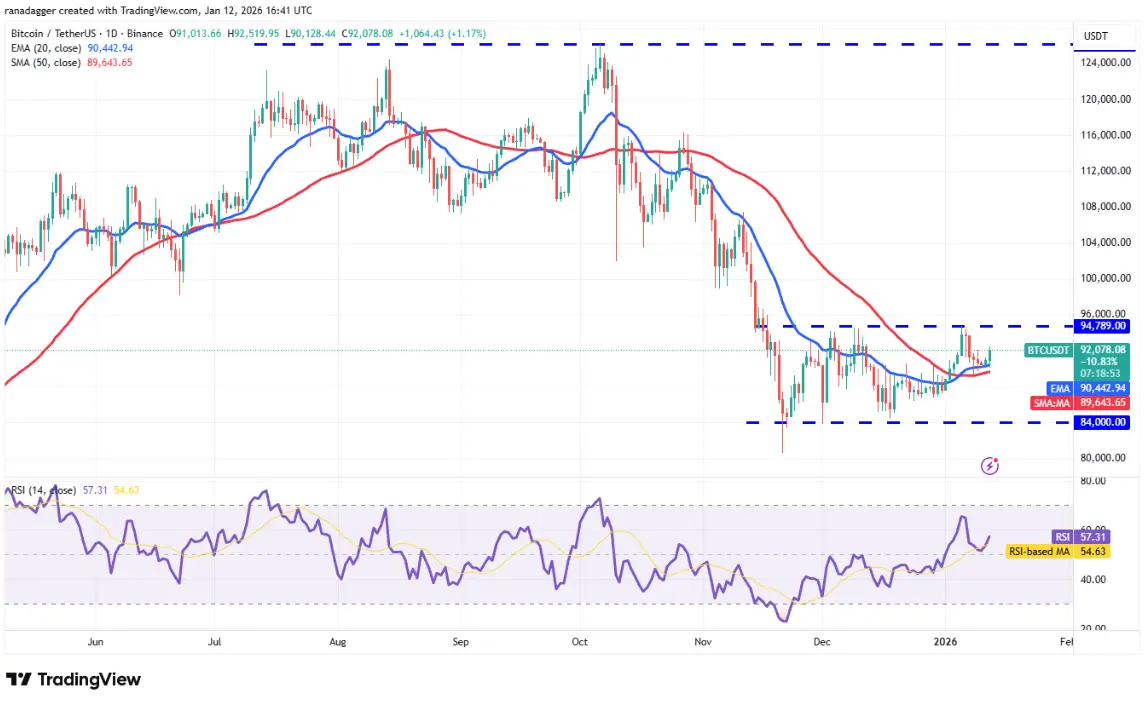 Daily BTC/USDT Chart | Source: TradingView Bulls will attempt to strengthen their position by pushing Bitcoin above $94,789. If successful, BTC/USDT could surge to $100,000, then to $107,500. This movement would suggest the correction phase might be over.
On the other hand, if the price reverses from $94,789 and breaks below the moving averages, it indicates that the bears are still active at higher levels. In that case, BTC could continue sideways trading in the $84,000 – $94,789 range.
Technical Analysis of ETH
Ether (ETH) has rebounded from the 20-day EMA (3,088 USD), showing that the bulls are trying to regain control.
 Daily ETH/USDT Chart | Source: TradingView If the price closes above the resistance level, the advantage shifts to the buyers. The ETH/USDT pair could then rise to $3,569, and further toward the psychological level of $4,000.
In the opposite scenario, if the price reverses from the resistance and breaks below the moving averages, ETH is likely to continue oscillating within the triangle pattern for a few more days. The bears will gain the upper hand if the price breaks below the support, dragging ETH down to $2,623.
Technical Analysis of XRP
The bulls are trying to keep XRP above the moving averages, but selling pressure remains high.
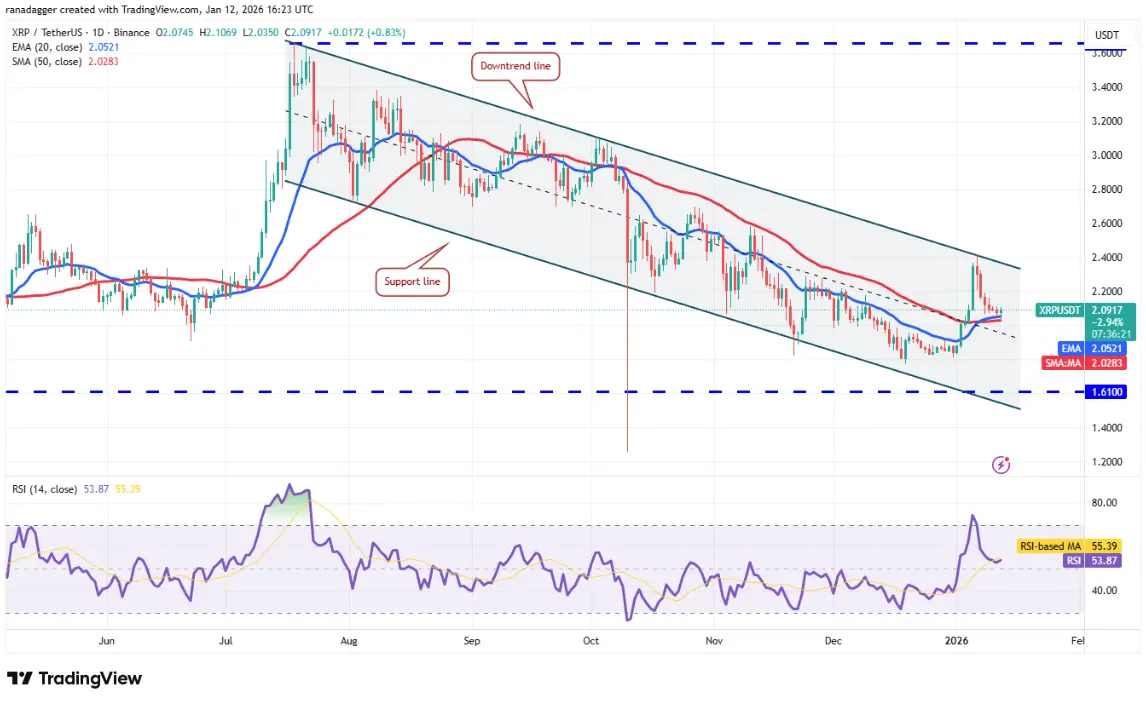 Daily XRP/USDT Chart | Source: TradingView If the price drops below the moving averages, XRP/USDT could continue moving within the descending channel pattern. The key support level to watch is $1.61. A break and close below this level would increase the risk of a sharp decline to the October 10 low at $1.25.
To signal a short-term trend reversal, the bulls need to push XRP above the downtrend line. If successful, the price could rally to $2.70, and then to $3.10.
Technical Analysis of BNB
BNB is trading within a narrow range between the moving averages and the resistance zone at $928.
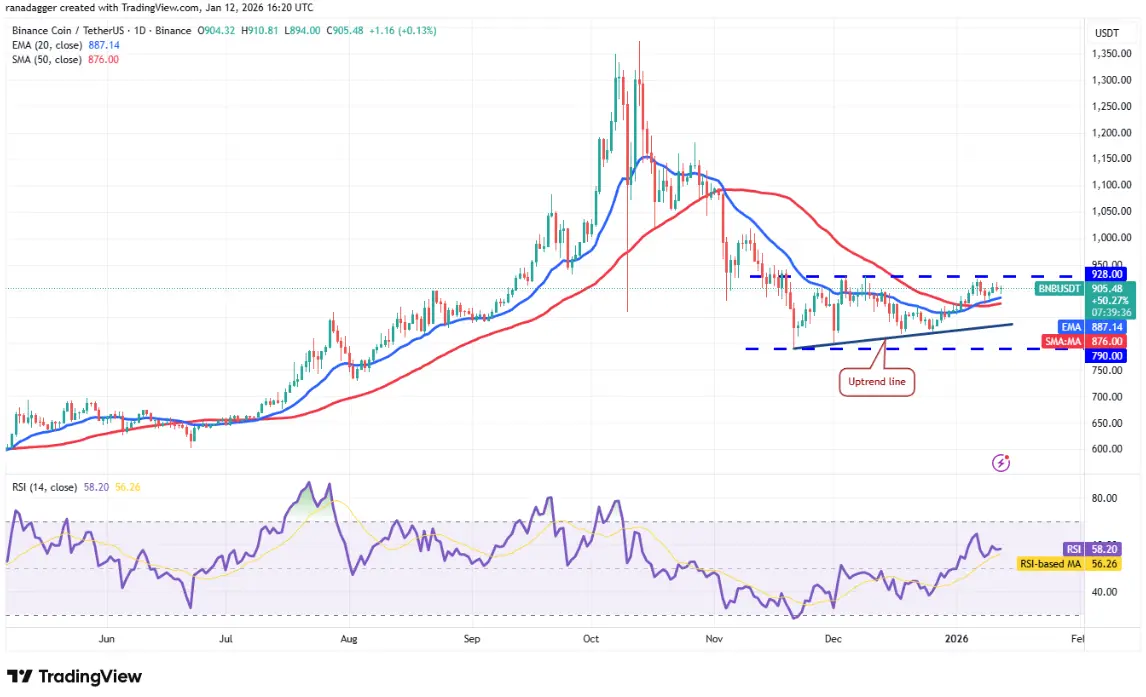 Daily BNB/USDT Chart | Source: TradingView The 20-day EMA (887 USD) is trending upward, and the RSI is in positive territory, increasing the likelihood of a breakout to the upside. If this occurs, BNB/USDT could complete a bullish triangle pattern, targeting a move up to $1.066.
Conversely, if the price reverses and breaks below the moving averages, it indicates strong resistance from the bears at $928. The price could then be pulled down toward the upward trendline and further to the support zone at $790.
Technical Analysis of SOL
Solana (SOL) has rebounded from the moving averages and has now reached $147, where selling pressure from the bears is expected to increase.
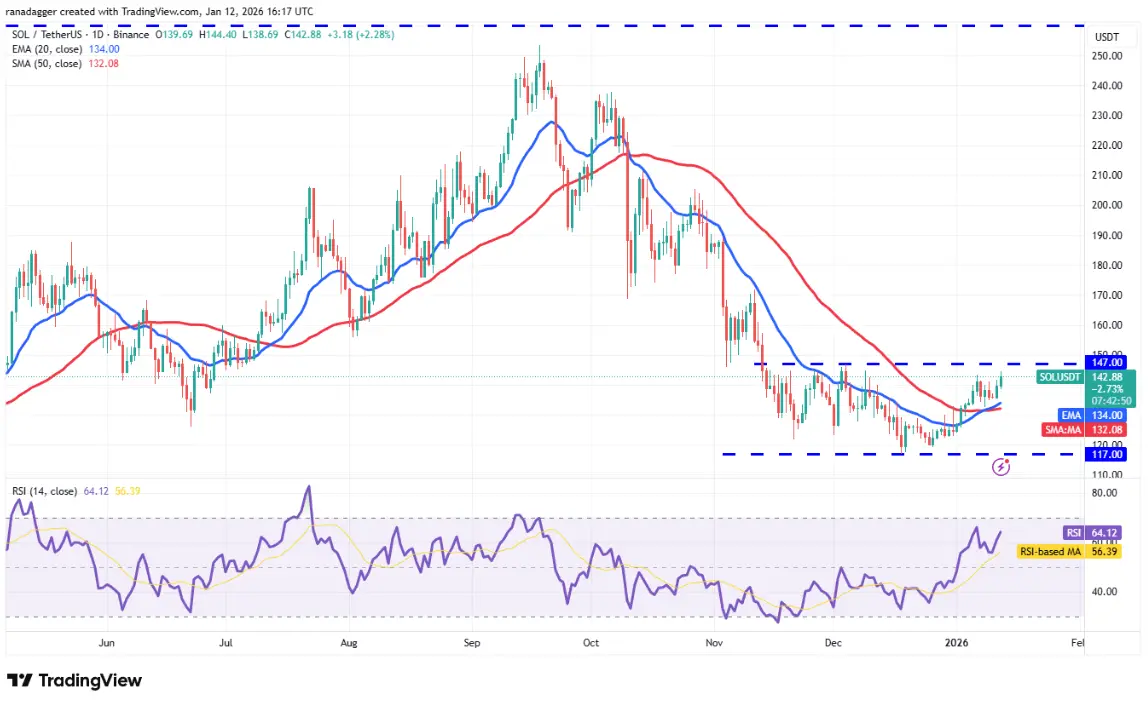 Daily SOL/USDT Chart | Source: TradingView The 20-day EMA (134 USD) is rising, and the RSI indicator is above 64, indicating a bullish bias. If the price closes above the resistance zone at $147, Solana could initiate a new rally toward $172.
On the other hand, if the price reverses and breaks below the moving averages, SOL/USDT could continue to fluctuate within the $117 – $147 range for some time.
Technical Analysis of DOGE
Dogecoin (DOGE) is experiencing intense tug-of-war between bulls and bears at the moving averages.
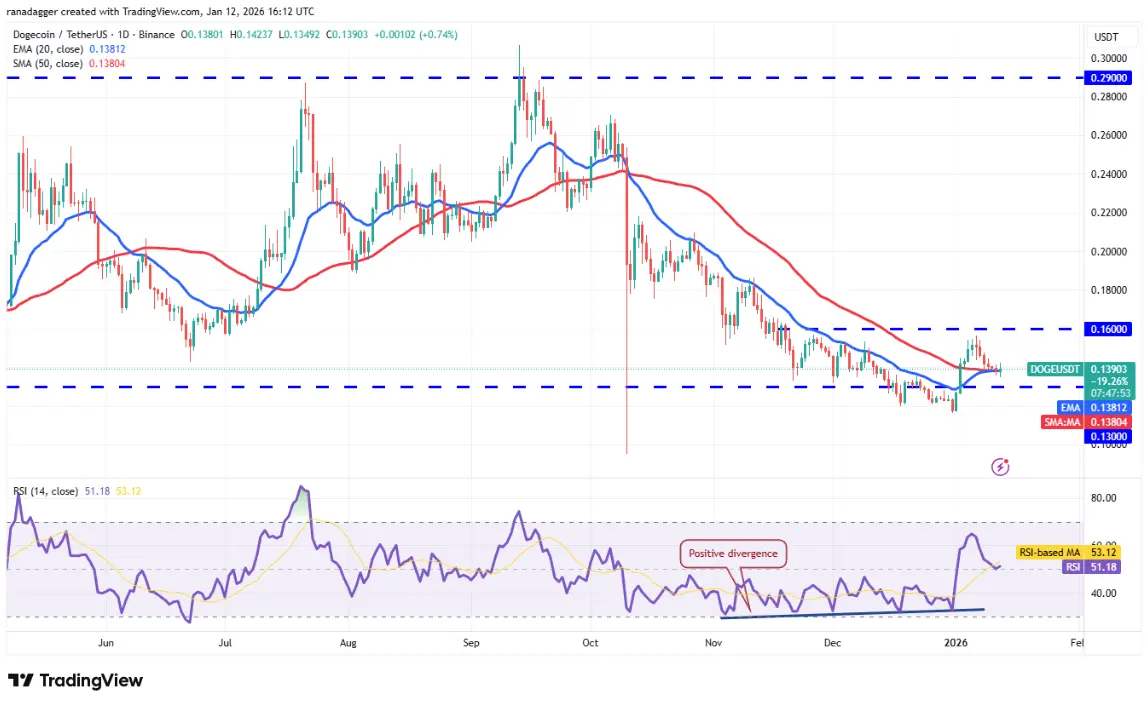 Daily DOGE/USDT Chart | Source: TradingView The sideways moving averages and RSI near the neutral zone suggest no clear advantage for either side. If the price drops below the moving averages, DOGE/USDT could retreat to $0.13, then to $0.12.
Conversely, if the price breaks out and closes above the resistance zone at $0.16, it indicates the market has rejected the support breakdown at $0.13. The price could then rise to $0.19, and further to $0.22.
Technical Analysis of ADA
Buyers are trying to keep Cardano (ADA) above the moving averages, but weak rebound momentum increases the risk of a sharp decline.
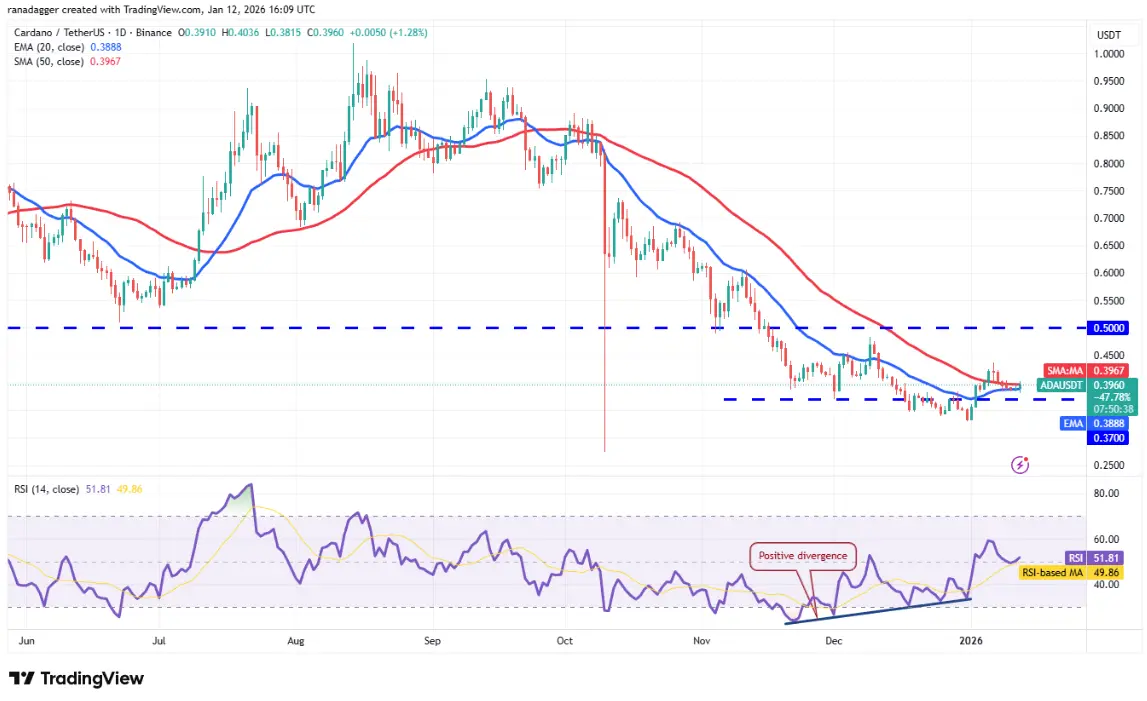 Daily ADA/USDT Chart | Source: TradingView If the price falls below the moving averages, ADA/USDT could decline to $0.37, then to $0.33. Bulls are expected to defend the $0.33 level strongly, because if this level is broken, the price could plunge to the October 10 low at $0.27.
The first positive sign would be a breakout and close above $0.44. If that happens, Cardano could rise toward the $0.50 zone – an important resistance level to watch. Buyers need to surpass $0.50 to confirm the return of the bullish trend.
Technical Analysis of BCH
Bulls attempted to push Bitcoin Cash (BCH) above the $670 resistance on Sunday, but bears maintained their stance.
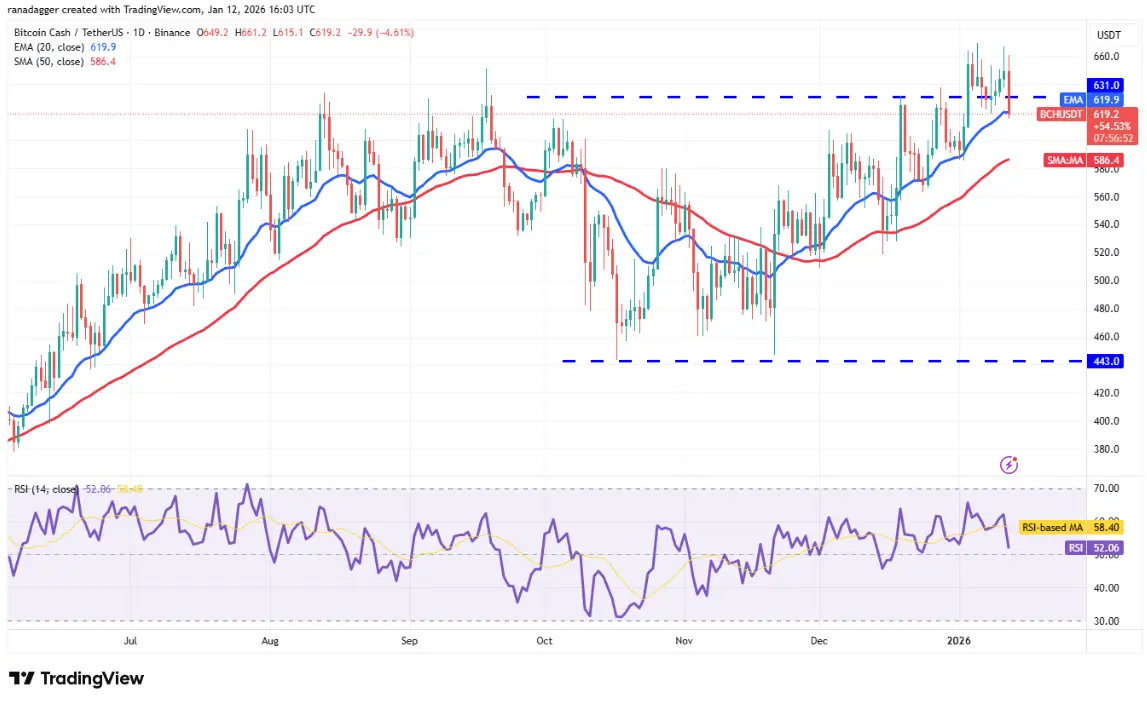 Daily BCH/USDT Chart | Source: TradingView Currently, the bears are trying to consolidate their advantage by pulling BCH below the 20-day EMA (619 USD). If successful, BCH/USDT could sharply decline toward the 50-day SMA at $586. Buyers are expected to defend this level, because a close below the 50-day SMA would suggest that the previous breakout above $631 might have been a “bull trap.” In that case, the price could plunge to $518.
On the other hand, if the price rebounds from the moving averages and breaks above $670, it indicates that the bulls are still in control. The pair could then advance toward the $720 zone, which is expected to be a strong resistance.
Related Articles
Crypto Market Struggles as Bitcoin and Ethereum Post Weak Q1 2026 Performance
Strategy Raises STRC Dividend to 11.50% as Bitcoin Buying Strategy Continues.
Bitcoin Eyes Iran Reactions as Oil Triggers 5% US Inflation Forecast
Whale Trader Pension-usdt.eth Secures $466K Profit After Surviving a $3.3M Bitcoin Drawdown